Summary – A top-down review of interesting calls and comments made last week in Treasuries, monetary policy, economics, stocks, bonds & commodities. TAC is our acronym for Tweets, Articles, & Clips – our basic inputs for this article.
Editor’s Note: In this series of articles, we include important or interesting Tweets, Articles, Video Clips with our comments. This is an article that expresses our personal opinions about comments made on Television, Tweeter, and in Print. It is NOT intended to provide any investment advice of any type whatsoever. No one should base any investing decisions or conclusions based on anything written in or inferred from this article. Macro Viewpoints & its affiliates expressly disclaim all liability in respect to actions taken based on any or all of the information in this article. Investing is a serious matter and all investment decisions should only be taken after a detailed discussion with your investment advisor and should be subject to your objectives, suitability requirements and risk tolerance.
1.Do extremes reverse or get more extreme to zero & infinity?
Remember what Charlie McElligott said to Erik Townsend of Macro Voices in their podcast last week? Mr. McElligott pointed out that CTA exposures were 98% long in bonds and described the CTA positions as “giving that 100% long signal” for bonds. Then he said in that podcast,
- “This is where you start getting some of those extremes that can sharply reverse; … you’re going to get a yields-up trade. You’re going to get probably a bear-steepening trade.” … I think that’s probably where we are right now. … “
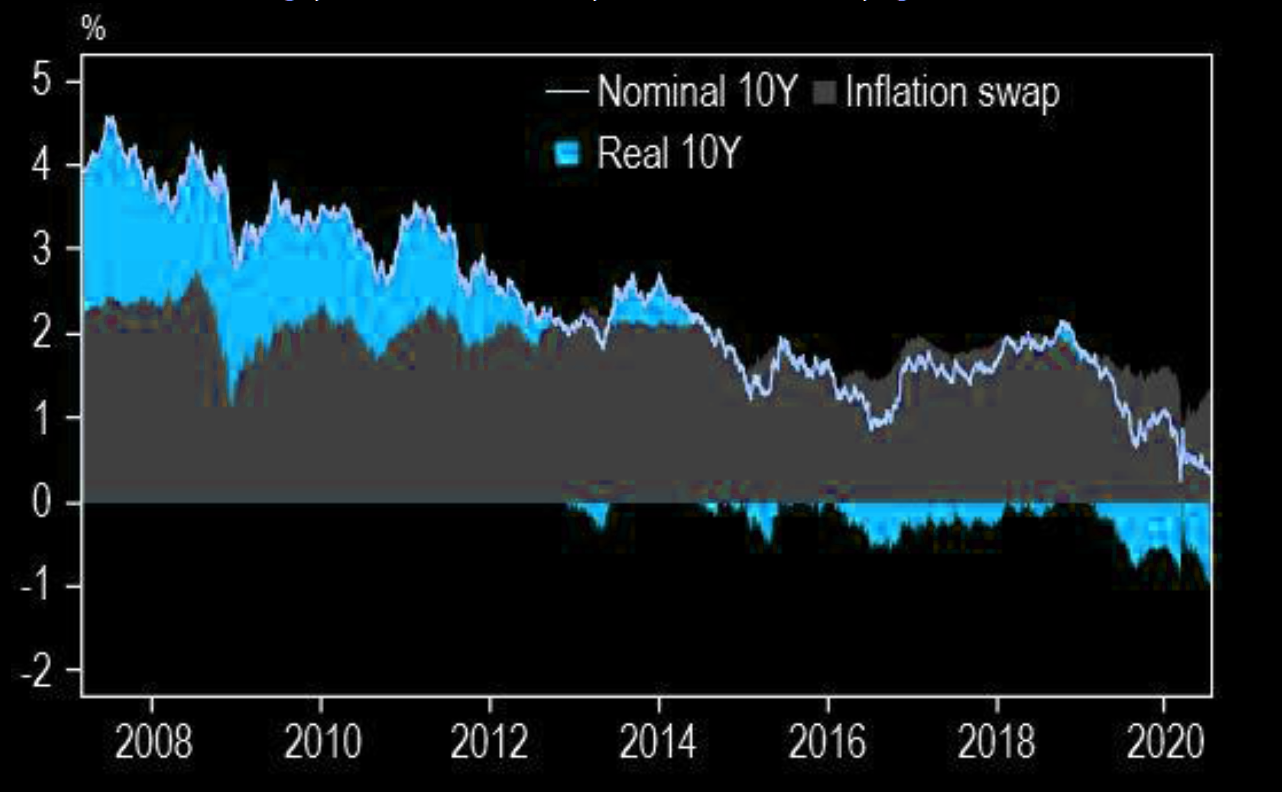
That’s the weird thing about extremes. They don’t listen to reason. Look what happened this week not just to nominal yields but also to real yields. The 5-year real yield made a new all-time low this week to minus 1%:
- Market Ear – Falling real yields – Real yields are falling amid central bank support and inflation pricing adjusting to fundamentals. How low will they go?
Read the prediction of Carter Worth, resident technician at CNBC Options Action on Friday evening:
- “.. there is every prospect that rates are going to zero … real rates on 5-year made new all time lows today of minus 1%; … that’s sort of the mantra – Rates to Zero & Gold to Infinity“
Then you have Priya Misra of TD Securities making the opposite call of Charlie McElligott on Friday on Bloomberg Real Yield: (Is that show is really back?). Ms. Misra is getting incrementally bullish on Treasuries now. Why? Due to rising covid risks, increasing political risk & positive seasonals, she said. She thinks her old trading range of 60-80 bps for the 10-year yield is too high.
Remember Bob Michele, head of JPMorgan Fixed Income Asset Management, the man who was among the early ones to predict in 1989 that the US 10-year Treasury yield would go to 1%. What did he say this week to BTV’s Jonathan Ferro?
- ” … Yields in the bond market, not just Government, but also in credit will be anything the Central Banks want them to be; … if the Fed wants to bring the US 10-year Treasury rate closer to the funding rate, they have the tools to do it; they don’t need to explicitly announce yield curve control, they can just do it by varying the purchases they make in the long-end vs. the short-end. … Yes, I think there will come a point in time, between July & November, months that are notorious for the market, that there will be some run-off that will move money to Government bond market & that will see the US 10-year yield converge to US Federal Funds rate ..”
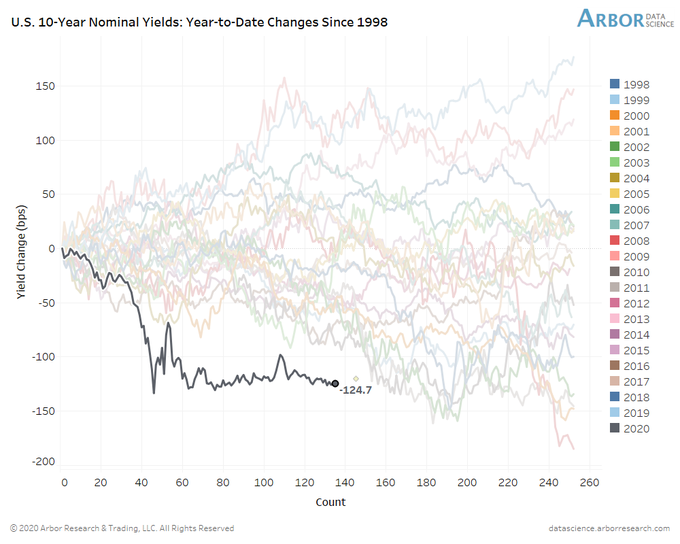
This was yet another week in which Treasury rates refused to go up despite the rally in stocks, even small cap stocks. But then Treasury yields haven’t gone up during the past three & half months, despite one of the greatest rallies in the S&P.
- Ben Breitholtz@benbreitholtz – July 15 – Rather impressive the US 10-year note’s YTD change in yield is still the most deeply negative (looking back to 1998), even after going NO WHERE for three and a half straight months!!!
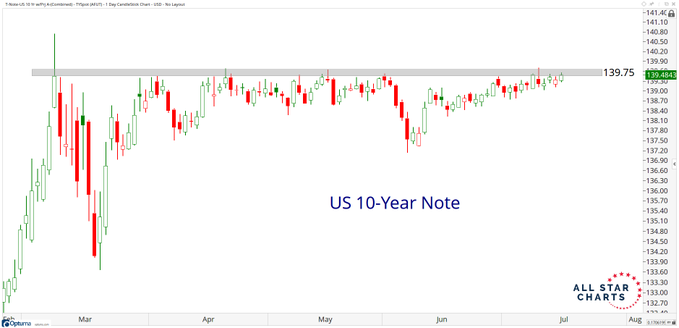
- Tom Bruni, CMT@BruniCharting – So…Treasuries about to break out or nah?
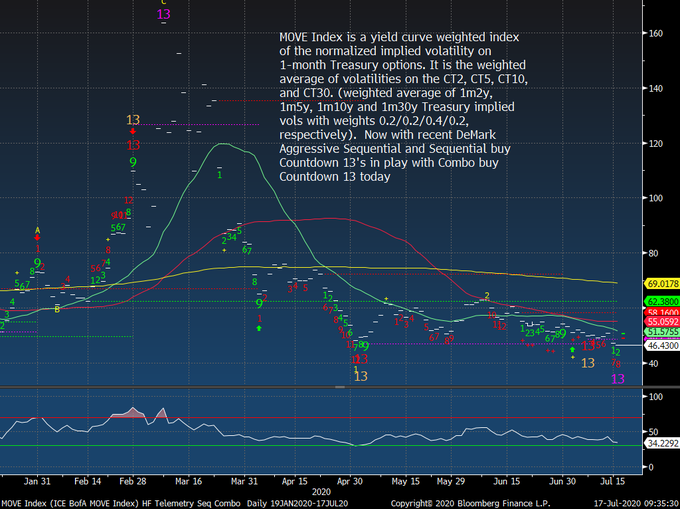
- Thomas Thornton@TommyThornton– MOVE Index – expect some Bond volatility ahead
2. BS, Amazon et al, Value Stocks
- “Our indicators tell us, we’re very close to a Lehman-like drawdown,” argues Larry McDonald, a former strategist at Société Générale who now runs The Bear Traps report.
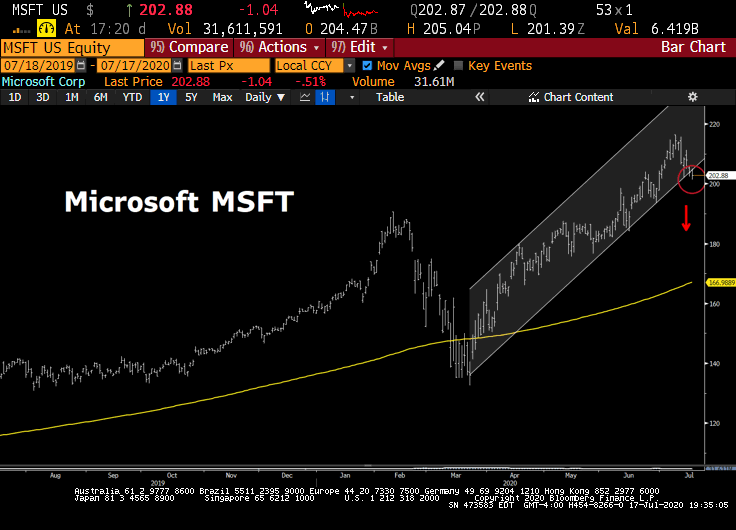
- Microsoft, very quietly lost $100B this week. On Friday, MSFT equity closed BELOW its March 2020 trendline, a VERY bearish signal for BIG Tech. In another disturbing turn of events, for only the second time since the March lows, MSFT closed BELOW its 20-day moving average. In our view, this is sure to bring in algos and momentum selling next week. The SELL Signals are lining up at the traffic light.
- SentimenTrader@sentimentrader– The Nasdaq 100 is on track for a 2% weekly loss. The S&P for a 1% weekly gain. Both are within 5% of their highs. The last time this happened was the week ending March 17, 2000. Hopefully this doesn’t make @fundstrat‘s head explode.
- SentimenTrader@sentimentrader – For the record, the only other week in their history when this triggered was Sep 15, 1995. Slight loss over the next month, then rally resumed.
So what was the big difference between March 2000 & September 1995? It was the difference between the Greenspan Fed & the Greenspan Fed. The 2000 Greenspan Fed was dead set on raising rates & removing liquidity from the markets to prick that telecom-technology bubble that they had created in 1998. In stark contrast, the 1995 Greenspan Fed was intent on lowering rates & injecting liquidity to make up for the turmoil they had created in 1994 by raising rates over 6 times.
So the key question is whether the 2020 Powell Fed is on a track to increase their balance sheet & market liquidity or on track to reducing it. Almost a rhetorical question, right?
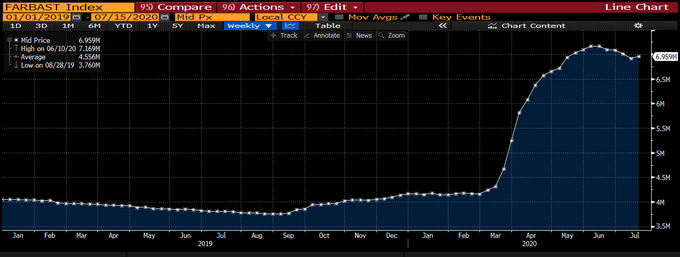
Remember MC/FB, our measure of valuation for secular growth cloud companies? MC/FB stands for Market Cap to Fed Balance Sheet ratio. When did the S&P hit its peak? Second week of June. And when did the Fed’s balance sheet stop growing? Mid-June. However, Amazon, Microsoft et al exploded to a new leg higher from mid-June until this Monday leading their MC/FB to an extended level.
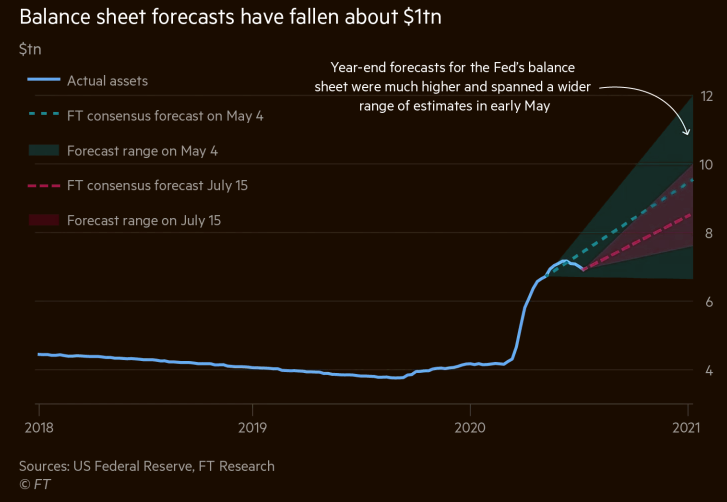
- Lisa Abramowicz@lisaabramowicz1 – The Fed’s balance sheet surged more than 70% this year through mid-June before stabilizing. Now Wall Street analysts are lowering their expectations for the Fed’s holdings at yearend to $8.5 trillion, about $1 trillion lower than average assumptions in Mayft.com/content/b269e4
- Market Ear – Fed’s BS sees small uptick, but Wall Street sees lower growth for the BS Full FT article, HTTPS://WWW.FT.COM/CONTENT/B269E432-ABE5
So what happens going forward may depend on what the Fed does with its balance sheet & whether Treasuries rally. Why the second? Read what Charlie McElligott also said in his podcast on Macro Voices:
- “… growth at any price meant stuff that can grow profits or grow earnings, regardless of the
economic cycle. So stuff like secular growth tech, right. The high fliers in tech. Nasdaq.
Those types of names have just gotten more and more crowded and they’ve become bond
proxies. They end up trading – they need low yields to justify their expensive valuations. They look like bonds. They’ve benefited from this massive bond bull market. And that’s where people have been headed. So what was a pure momentum portfolio was basically a long-growth short-value. …”
So what if Bob Michele & Priya Misra are correct and the 10-year Treasury yield starts going down instead of up as Charlie McElligott felt? Bob Michele also said on BTV that “we are seeing an acceleration in digital transformation in US & the global economy” and that they are trying to find suppliers to the digital space for adding to risk positions.
So if the estimates for year-end Fed balance sheet go back to $10 trillion (Dudley’s figure in his BTV comments)from today’s $8.5 trillion figure and if US 10-year yields break decisively below 60 bps, could Amazon, Microsoft et al rally? Better answered after their earnings next week & the week later, right?
3. S&P Next Week
Come Monday morning, we should get results from AstraZeneca & Oxford University about their phase 3 human trials of their CoronaVirus vaccine. That could the biggest impetus for the S&P on Monday.
- Joe Kunkle@OptionsHawk – Gap $SPX over brick wall 3235 Sunday night?
Mr. Williams expects the S&P to get to a new high or almost a new high by July 27 & then presumably decline. Do note that the original clip of Cramer was over 9 minutes long but that clip is behind CNBC’s firewall. So is this 2:26 minute extract a true & complete description of the views of Larry Williams? We don’t know. But we felt it was important to point out that the clip we highlight above may be not entirely accurate. It is certainly not complete.
Whichever way the S&P breaks could signal “a strong directional move“, according to Lawrence McMillan of Option Strategist:
- “In summary, the market is struggling to piece together a strong directional move either way. There was a wide trading range in April and May. And now there has been another one since mid- June. A breakout of this range would be a tradeable event. Meanwhile, short term signals (mBB sell and $VIX “spike peak” buy) can be taken when they are confirmed.”
4. Dollar, Materials & Gold
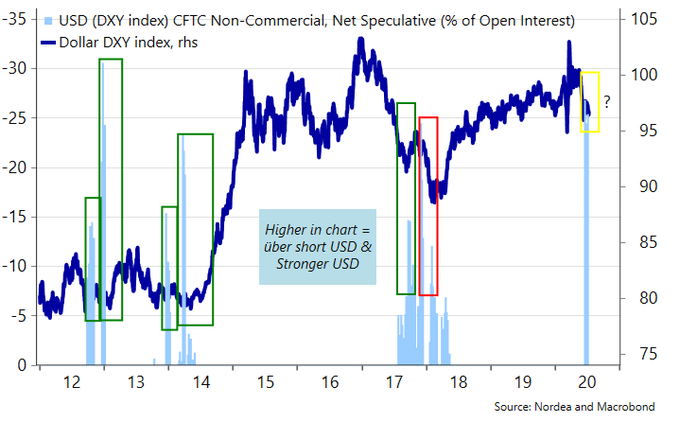
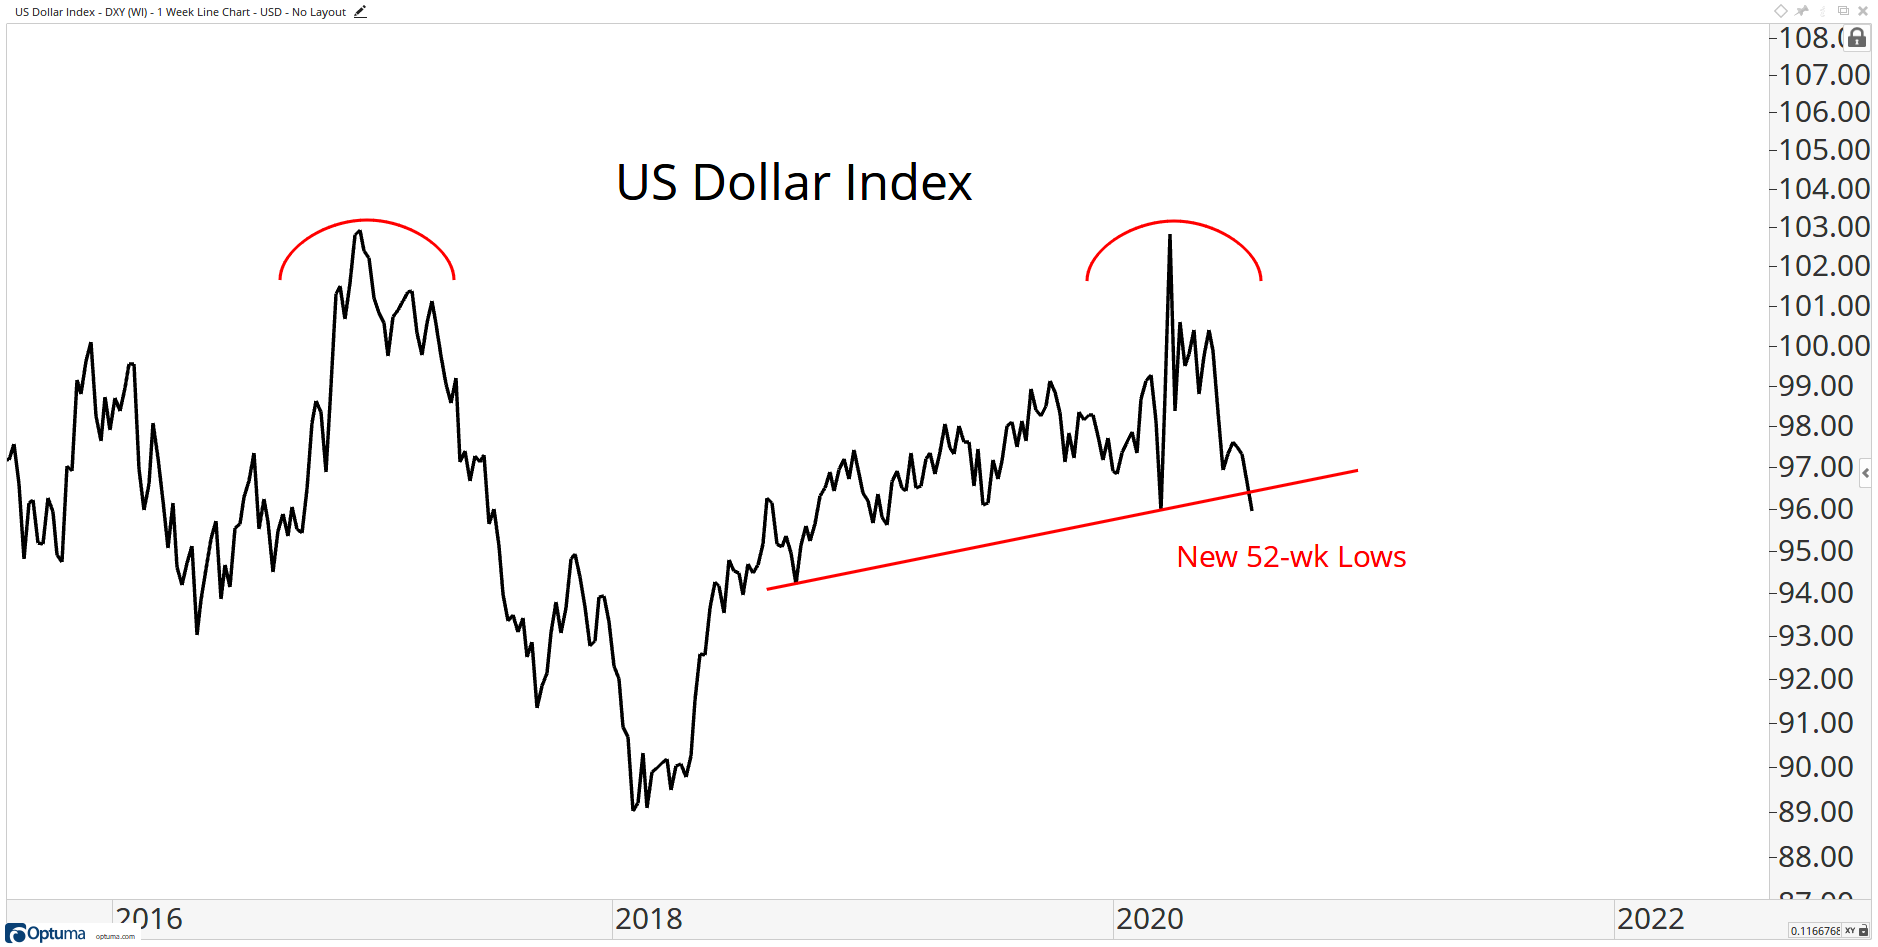
The U.S. Dollar closed down 70 bps this week. Is this ready for a breakdown or a short-covering rally?
- Morten Lund@meremortenlund – Short $USD positioning hasn’t been this stretched since 2012. My inner contrarian is screaming to go long USD. 4 out of the last 5 times, when positioning was also super stretched, the USD gained. Will markets be wrong-footed again? I think so.
On the other hand, J.C.Parets believes the opposite:
He writes:
- This was one of the major themes we discussed in our Quarterly Playbook last week. Commodities picking up, inflation protected bonds perking up, rotation into emerging markets and cyclicals…. It fits right? To me it all makes perfect sense.
Carter Worth recommended buying the Materials sector of the S&P via the ETF XLB on Friday.
Some argue that Gold represents much more than being a part of the materials complex.
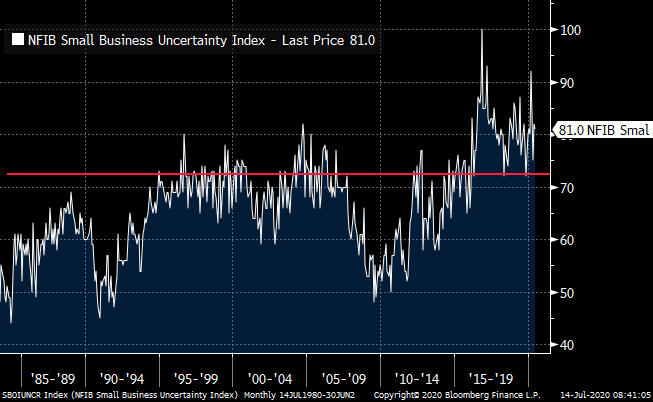
- Richard Bernstein@RBAdvisors – #Gold remains a core asset for us. @NFIB Small Biz survey shows across-the-board improvement EXCEPT for #uncertainty. Multi-year unprecedented territory continues.
Send your feedback to editor@macroviewpoints.com Or @Macroviewpoints on Twitter
