Summary – A top-down review of interesting calls and comments made last week in Treasuries, monetary policy, economics, stocks, bonds & commodities. TAC is our acronym for Tweets, Articles, & Clips – our basic inputs for this article.
Editor’s Note: In this series of articles, we clude important or interesting Tweets, Articles, Video Clips with our comments. This is an article that expresses our personal opinions about comments made on Television, Tweeter, and in Print. It is NOT intended to provide any investment advice of any type whatsoever. No one should base any investing decisions or conclusions based on anything written in or inferred from this article. Macro Viewpoints & its affiliates expressly disclaim all liability in respect to actions taken based on any or all of the information in this article. Investing is a serious matter and all investment decisions should only be taken after a detailed discussion with your investment advisor and should be subject to your objectives, suitability requirements and risk tolerance.
1.It continues or Does It?
The first “It” is certainly the current stock market rally. Look at the performance this week:
- Dow up 1.2%; SPX up 80 bps; RSP up 1.1%; NDX up 13 bps; RUT 1.5%; IWC up 1.3%; DJT up 2%; JPM up 8.8%; BAC up 6%; C up 8.2%;
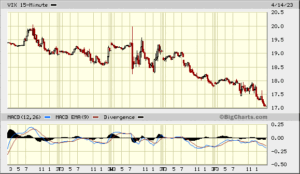
An analogous “It” was the VIX that has been falling since the week ended March 17. VIX was down 7.2% this past week & its most interesting day was Friday when it fell 4.1% with VXN down 4.55%. A down S&P day with a steep fall in VIX has often been deemed as bullish. Was the fall in VIX mainly due fears about Bank earnings dissipating on Friday morning with JPM up 9%?
But then why did VIX begin falling on Wednesday late afternoon?
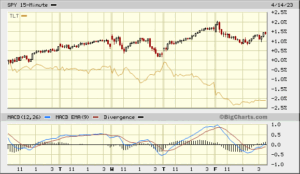
Surely it must be because of market friendly softer inflation data, right? Actually that is our second “It” that raises questions about continuation of what has been going on! The CPI & PPI were great for the Treasury market in the morning & then rates began moving up on both days. The contrast between S&P and TLT was dramatic especially on Thursday & Friday.
For the week, TLT was down 2.9%; EDV down 4.3% & ZROZ down 5% and almost all the decline came on Thursday & Friday, the 2-days when VIX fell hard and S&P rallied. Look at the weekly performance of Treasury yields & ask whether you expect to see that in a week in which inflation fears subsided, with Priya Misra of TD highlighting that “shelter came down with the lowest shelter reading in a year“, and that “shelter is a very large component of core CPI & it also tends to be a trending component“.
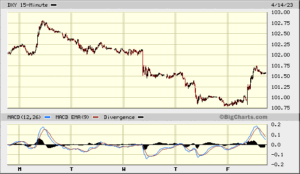
If that was not weird enough, the U.S. Dollar rallied on Friday after stabilizing on Thursday:
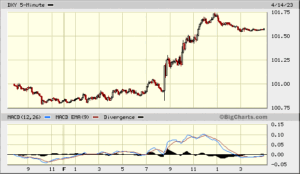
The 1-day chart of DXY for Friday looks more interesting:
So the U.S. Dollar began rallying, VIX began falling & TLT began rallying at the open but the S&P & QQQ kept falling until they began rallying at around 1 pm.
Could it be as simple as the below?
- Friday might have delivered a higher confidence in the U.S. Banking system
- That in turn reversed the overly steep fall in Treasury yields for the past month
- & simultaneously caused a steep fall in the fear index VIX
- & if the banking system is OK, then the U.S. Dollar should stabilize from diminishing fears of a banking crisis in the USA.
We must absolutely confess that we do not have a clue. But if we are even somewhat correct in our guesswork above, then how could the rally not continue? Especially if the question below by Barclays does get some currency?
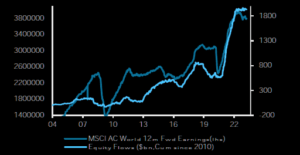
- Via The Market Ear – Fri 4/14 – Equity flows follow earnings – What if the earnings downgrade cycle is now over…? Source Barclays
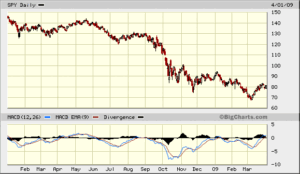
Of course, the earnings downgrade cycle does NOT have to be actually over. It merely has to lie dormant until say June 2023. And isn’t that what happened in April-May-June 2008?
2. Walls, & Views
Is relative calm good?
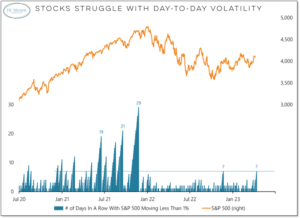
- Willie Delwiche, CMT, CFA@WillieDelwiche – Thu 4/13 – We’re at 7 days in a row without a 1% swing in the S&P 500 – that matches the longest such stretch we’ve seen since Nov 2021. Bear markets are characterized by day-to-day price volatility. Bull markets are characterized by extended periods of relative calm.
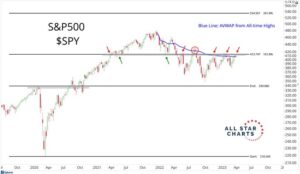
But is 4,160 a wall?
- Lawrence McDonald@Convertbond – Wed 4/12 – If you bought U.S. stocks… April 2023 vs. 4160; February 2023 vs. 4160; August 2022 vs. 4160; June 2022 vs. 4160; February 2022 vs. 4160; April 2021 vs. 4160 You are even… *S&P 500 into a massive supply wall…
Or is it simply a memory?
- J.C. Parets@allstarcharts – Fri 4/14 – can you say market memory?
Could breaching it just be a function of velocity & power? And what might propel both?
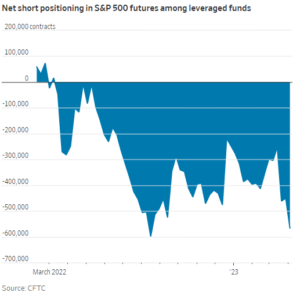
- Gunjan Banerji@GunjanJS – Tue 4/11 – Net short positioning in S&P 500 futures is at the highest level since **August 2022** among leveraged funds
How about going back another decade from the above?
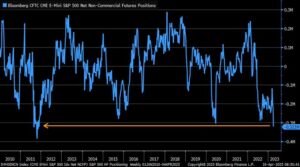
- Liz Ann Sonders@LizAnnSonders – Tue 4/11 – Hedge funds currently sitting with largest net short position in S&P 500 futures since late 2011
Is that as far back as the gurus can go? Not by a long shot! Look what Craig Johnson of Piper Sandler said on CNBC on Wednesday April 12:
- “going back to 1929, when you look at the fact that we haven’t seen in the first quarter a break below the December lows of last year, that has historically been a pretty bullish sign for the market; .. the market is up 83% of the time higher with a 13.7% return when you don’t break below December lows in the 1st quarter of the new year; that’s what we have seen this year“.
- “when you look at e-mini futures contracts, we are at levels right now that we have only seen at the lows of the market in 2020, 2011 & 2007; the world is already negatively positioned”
- “it is trendlines over headlines; trendlines suggest that market remains in well-defined uptrends; with all the negativity, stocks are not going down; they are starting to trend higher; we can get to 4625“
His near term target is 4200-4300. He also says we might be setting up for a big drop which is going to be bought. Another bullish view came from Jeff DeGraff on CNBC on Monday 4/10:
- ” … keeping this market under 4,000, its like holding a beach ball under water … there are several macro factors that are more favorable than not; one is very simply decline in the 10-yr yield, while that is not the most important factor, that relationship helps; … the more impressive is one with all the concern about a recession, with all the concern about a slowing economy, we are seeing that the BBB-spreads have been able to continue their downward ascent ; they have not been rising & I think that is good news; …. the market has been absolutely resilient & people are not listening closely enough to the message of that market .an important message of the markets … COT charts – commercials are extremely long hedges on the Dollar, what happens is that they are getting themselves into that position AFTER it has been a problem ; so statistically they are a group that you want to fade & they are mostly corporations; Dollar is going to be less important going forward unlike 2022 … “
But what about the QQQ?
From a technical perspective, she said, “QQQ rally is stuck between January 30th high of 12,880 and the 13210 in August; in needs to gather momentum in this area & that can absolutely come from better than expected earnings … every single market rally has been fueled by an earnings season; so “things are not that bad” will be followed thru at least for this quarter“. She also highlighted GOOGL & pointed out it has been above 26/40/200 week averages for 4 weeks in a row. She uses 101 as support & 110 as a milestone to overcome.
Jim Cramer had highlighted her work on Tuesday April 11. By now everyone knows CNBC asininely hides these “off-the-charts” clips of Cramer. Based on our hastily scribbled notes, below is our recollection of what Cramer said about the views of Ms. Inskip:
- “QQQ weekly chart turned bullish for the first time since Jan 22; big picture perspective – now going up; QQQ consistently closes above 13/26/40 weeks averages; … decent base forming; support at 313 & resistance at 332; if it breaks 332, then can rally further “
On the other hand, you have the Gentleman with the hot hand this year:
- Dan Niles@DanielTNiles – Fri 4/14 – $PNC -2% today despite mega cap banks being up on results. SPX up in March as Fed balance sheet +$392B in 2 wks following SVB. Now has dropped $91B over past 2 wks as bank stress subsides. Believe SPX in April will be down now that Fed support gone again & earnings season is here.
Finally what about Banks, especially Regional Banks? Look what another hot hand, John Mowrey of NFJ Investment Group, said on Friday on CNBC Closing Bell:
- “financials do look interesting here ; Regional Banks are at 200 bps premium over the 10-year Treasury plus dividend growth … much of the dislocation has already taken place …. ”
Frankly, we are a bit worried about the many bullish opinions featured above. So we seek to ward off the bad luck with the widely proclaimed bearish message of this past week from Chris Harvey of Wells Fargo – Sell Before May & Go Away:
3. Mauling by Big Bad Bears – A Turing Point
He is excellent not Bad & he has not been a Bear for long. But he is Big in the economic & investment world. In fact, he is so big that his firm should read ISI Evercore rather than the other way around. Listen to Mr. Ed Hyman:
- “I am in the recession camp – got the rates, got inverted yield curve & the money supply contraction – that’s Mike Tyson times 3. … there must be 25 indicators that show a slowing trend; … everything I look at is now slowing; rents are about to come off the boil; … they have already made a mistake; they have tightened too much; … I have seen enough; know where the boat is going .. ”
Then we come to David Rosenberg who needs no introduction. He has to be not just big but huge. Because CNBC’s Sara Eisen invites him often & she, in our opinion, is focused on mainly inviting women guests. Nothing wrong in that of course but we, in contrast, are committed to GS, otherwise known as Gender Secularity. Mr. Rosenberg announced this week that “I get a strong sense here that the turning point in the economic cycle has arrived.”
Those who have watched the “Renaissance Man” of Danny Devito need no introduction to the “Double D” term which we often apply to ourselves. Mr. Hyman referred to Mike Tyson times 3. Mr; Rosenberg simple says “three Ds”:
- “We have to keep in mind here the three “Ds” as they pertain to the shape of the inverted yield curve, the duration, depth, and dispersion have a 100% track record and the last time we had the three “Ds” behaving like this was in the spring of 1981,”
- “The real kicker for me is that, when you look at the areas of the employment pie that are most closely tied to Fed policy, I am talking about the banks, manufacturing, real estate, construction, and retailing, they fell 33k last month in the biggest setback in two years and the third sharpest drop since April 2020 when the economy was in lockdown mode.”
- “System-wide deposits have collapsed at a 30% annual rate over the four weeks to March 29th, and that sharp slump is now being mirrored on the asset side of banking sector balance sheets as outstanding credit has contracted 3.4% (led by a steep 18.6% plunge in C&I loans, a 5.4% drop in auto lending, and -3.4% in real estate). So, I see early May as the final hike, assuming they do go, and the only question is whether enough rate cuts are priced in because I get a strong sense here that the turning point in the economic cycle has arrived.”
Now we come to the Biggest of the Big, one whom we thought of as “prophetic” in 2007. In contrast to Mr. Hyman & Mr. Rosenberg, Mr. Fink said this week on CNBC –
- “I am not expecting a big recession in the US; … I am not sure we will have a recession in 2023; we may have one in 2024; it really depends on what is the pathway of inflation; what is the pathway of Fed; more importantly on how does this all play out in terms of credit spreads”
What does Mr. Fink think of inflation? He said the below in another CNBC clip:
- ” … inflation is going to be stickier for longer & 4% would be the floor for inflation … Fed might tighten a few more times … commercial real estate is the dominant asset that regional banks own .. we have seen duration mismatch & some outflow of liquidity .. we haven’t seen credit issues yet; question is going forward could higher rates for longer translate into more credit quality issues in the future? …”
This inflation clip has an important discussion about geopolitical transitions on inflation. Specifically Mr. Fink points out that re-orienting supply chains from China to the US will drive inflation higher on a sustainable basis.
Listening to Mr. Fink this week was a chilling deja vu experience for us. We recall him being similarly un-bearish in a CNBC conversation with Maria Bartiromo in April-May 2007. By the time he came back to speak with Maria Bartiromo in October 2007, Mr. Fink had turned decisively bearish & used the bubble word. It was a “prophetic” call and it was the perfect time to sell all equity positions. We can’t wait to hear his views about credit issues in July 2023 when he will return to discuss BLK earnings & then again in October 2023. Our guess is he will be decidedly bearish in October 2023 if not in July 2023.
Having brought it up, we cannot end this session without a clip from Renaissance Man:
4. Gold, Oil, & Rebalancing of Planet Earth
If the U.S. Dollar bounces higher as it did on Friday, what might it mean for Gold?
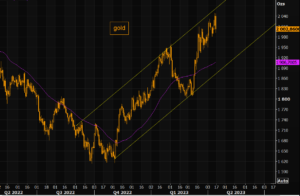
- Via The Market Ear – Fri 4/14 – Gold reversing? Gold is putting in a huge down candle today, right off the upper part of the big trend channel. The 50 day is way down. A close below 2k, and 1950 becomes the next big support. Source Refinitiv
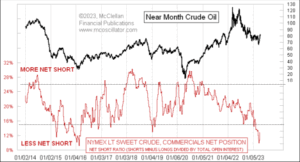
Regarding oil, we suggest you read this week’s article by Tom McClellan titled Crude Oil at Major Price Low, Per COT Report Data. A couple of excerpts are below:
- “OPEC+ also apparently believes that current prices are too low, and so on April 2 that organization announced a cutback in production, which caused an immediate $5 jump in oil prices. The commercial traders were right about prices being too low. Since that action by OPEC+, the commercial traders have raised their net short position just slightly, matching the price action. But they are still net short as a group in a very minimal way, indicating that there is a lot more room for oil prices to rise before this indicator would say that prices have risen too far.”
Notice that we have avoided the big issue that could cause serious turbulence in markets this summer. That issue is the Debt Ceiling. It could create ramifications that would affect the Fed’s decisions materially. It might also signal a new inflationary era going forward in our planet that is rebalancing itself. This topic was discussed at length on MacroVoices with Larry McDonald. Watch the entire clip when you have an hour or watch it in segments.
Send your feedback to editor.macroviewpoints@gmail.com Or @MacroViewpoints on Twitter
