Summary – A top-down review of interesting calls and comments made last week in Treasuries, monetary policy, economics, stocks, bonds & commodities. TAC is our acronym for Tweets, Articles, & Clips – our basic inputs for this article.
Editor’s Note: In this series of articles, we include important or interesting Tweets, Articles, Video Clips with our comments. This is an article that expresses our personal opinions about comments made on Television, Tweeter, and in Print. It is NOT intended to provide any investment advice of any type whatsoever. No one should base any investing decisions or conclusions based on anything written in or inferred from this article. Macro Viewpoints & its affiliates expressly disclaim all liability in respect to actions taken based on any or all of the information in this article. Investing is a serious matter and all investment decisions should only be taken after a detailed discussion with your investment advisor and should be subject to your objectives, suitability requirements and risk tolerance.
1.Key 5-minutes of last week
Before those key 5-minutes was a “first time” event as Carley Garner of DeCarley Trading said on Bloomberg Markets on August 8, 24 at about 12:05 pm (minute 4:30 to minute 11:55):
- “I have been doing this for a very very long time & today is the first time I witnessed a Weekly Jobless Claims rally; this is really unbelievable price action; I would like to point out again we are extremely complacent here; I have heard a lot more chatter about market being at the bottom than at the top; if you look at the monthly chart, you can make a case we are closer to a top than a bottom; ….”
She is correct about the rally at 8:30 am on Thursday but, as Bloomberg Surveillance team might point out, weekly jobless claims have become a sort of pre-market indicator for economic strength-weakness. So we have seen a few up moves based on a surprisingly up jobless claims number.
- PS: The work of Ms. Carley Garner was featured by Jim Cramer the week before in one of his Off-the-Charts segments on Mad Money. Obviously, CNBC webmasters did not feature it on CNBC.com. In this context, a suggestion to Bloomberg Markets & to Bloomberg TV – Invite the technician featured by Jim Cramer on CNBC Mad Money a couple of days afterwards on Bloomberg TV as Bloomberg Markets invited Carley Garner this week. It would be a smart play by Bloomberg & viewers can benefit despite CNBC’s blockage .
Getting back to Ms. Garner, we would also like to gently & respectfully point out that it is kinda gutsy to speak so boldly ahead of a Treasury auction at 1 pm, especially a 30-Year Treasury auction. As CNBC’s Kelly Evans pointed out just after 1pm on Thursday that it was an awful auction. Rick Santelli came on & emphasized that (omitted by CNBC webmasters as usual).
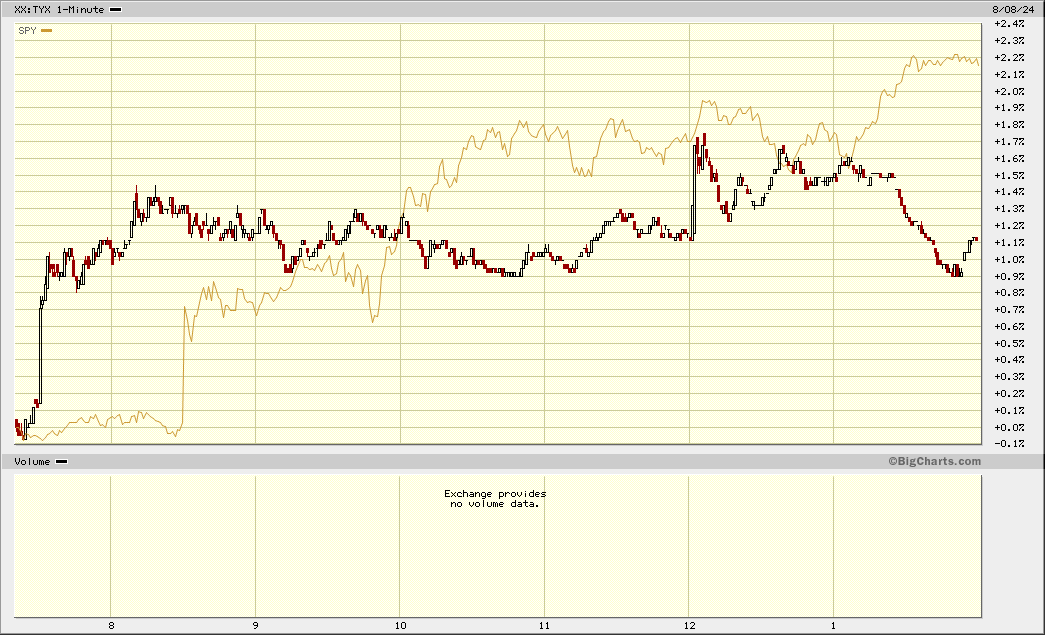
Instantly, the 30-year Treasury yield went up & S&P fell. Then voila!!! Just a minute or two later the big reversal. Look at the 1-minute interval of Thursday’s SPX vs TYX (30-yr yld) to see what a bababa-boom moment that was:
Seriously folks, this stunning & big reversal in 30-yr yield & SPX happened from 1:00 pm (auction) to 1:05 pm. When we first did this chart with a 5-minute interval, we couldn’t see it. But look at the above 1-minute chart again & see how fast & big the reversal was.
Actually forget simple words like reversal. Because
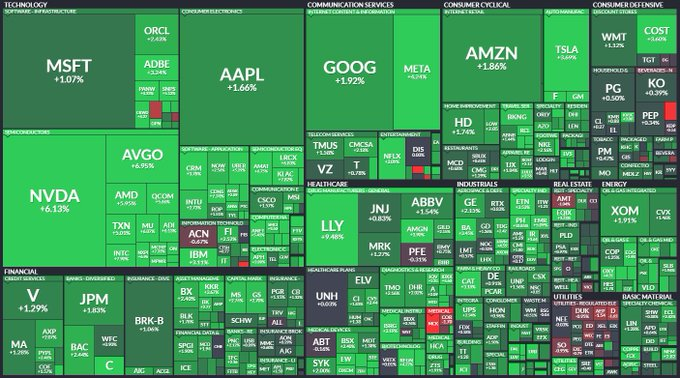
- The Kobeissi Letter@KobeissiLetter – Aug 8 – BREAKING: The S&P 500 officially posts its best day since November 2022.
What sounded the gun to rally within a minute or two of the ugly 30-year auction? We don’t know or care but let’s take a shot. Remember, as Carley Garner pointed out that, the stronger than expected jobless claims released at 8:30 am settled fears about the labor data collapsing. That caused the first up move. Moving to the 1:00 auction, remember that both the 3-year & 10-year auctions were deemed Ugly on Tuesday & Wednesday. So there might have been worry about the 30-year auction. And yes it was bad but was it viewed as NOT AS UGLY as expected? Or was it simply a sigh of relief that the auction was done & over?
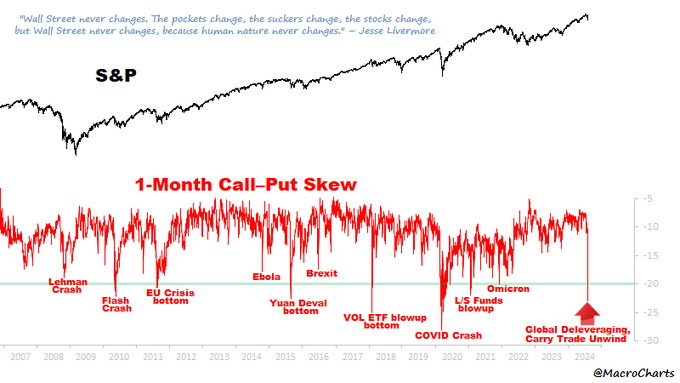
Was this sigh of relief aided by the positioning chart released by @MacroCharts on Tuesday, August 6 under the caption “Human nature never changes … “?
Has the best day since November 2022 corrected this skew shown above? Not really.
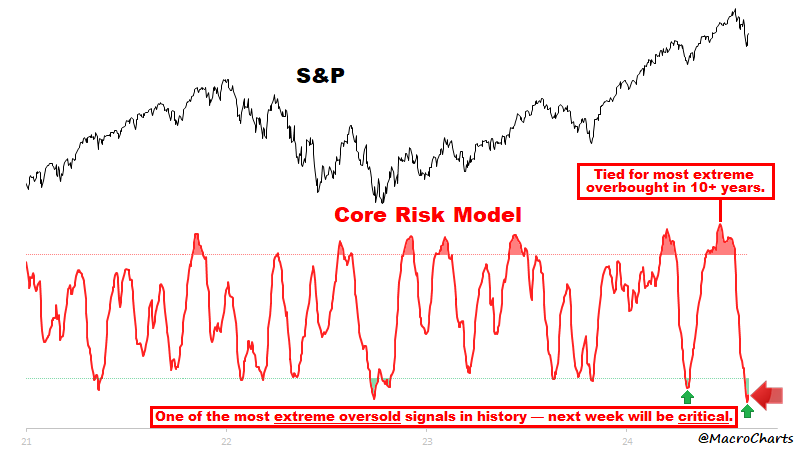
- Macro Charts@MacroCharts – Aug 10 – One of the most extreme oversold signals in history. Next week will be critical.
Ok, but is it ok to buy without someone noticing a breadth thrust in the market? Fortunately, thanks to CNBC’s Frank Holland, we found that Craig Johnson of Piper Sandler had Raised his year-end S&P price target from 5050 to 5800 & that his principal reason was a breadth thrust he saw in the market!!!
- ” … when our 26-week new highs indicator turned positive, also our breadth measure has expanded; there was a huge breadth thrust that took place in the market Frank … everything has kinda reset again… all we have done … is pull back to the breakout points whether its in the Russell, whether its in the S&P, or whether its in the Nasdaq; but the most unusual thing that has happened right now & why we want to roll with these changes is we have seen a correction in the Nasdaq & we haven’t even broken below the 200-day moving average; same thing with the S&P 500; this is a breadth thrust I think we want to trust at this point; I think that’s why we want to be long equities & why we upped our year-end price objective to 5,800 from 5,050 ; this is a definitely a pull back to buy“
However, Craig Johnson does not think the washout in Mag 7 & or Semis is completely done. He would prefer to buy in “Financials & Industrials if we get the shallow recession“.
And this was during early early morning on Thursday, the day that post the 30-yr auction became the best day for the S&P since November 2022. Kudos to Craig Johnson for his gumption & to CNBC’s Frank Holland for putting this in his show AND allowing Johnson to patiently make his case. Watch the clip yourselves:
Speaking of a member of Mag 7, another view on the same day as Mr. Johnson:
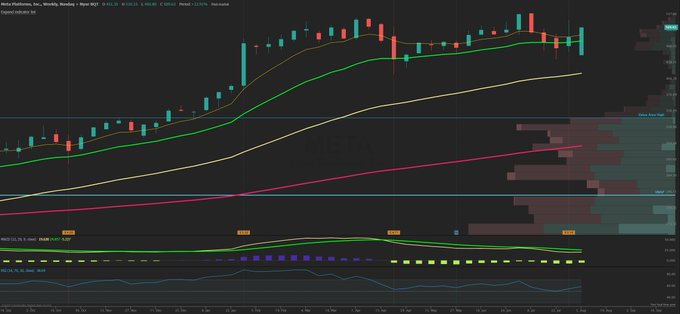
- Jason@3PeaksTrading – Aug 8 – $META weekly candle laughs at your carry trade selloff.. Saw late day buyers of 1200 Sept 6th $530 calls at $10.75 to $11.65
Had you heard of AI 1.0 vs. AI 2.0? If not, watch the clip below of veteran investor Paul Meeks explain it. He is “very comfortable” with AI 1.0 stocks, mainly Semis & the hyperscalers because they are actually accelerating their investment spending. He is not sold on AI 2.0 stocks yet; these are stocks that will have money-generating apps after the infra-buildup.
But what about the PE today of these Mag 7 type AI companies or the promise they have suggested to investors? Ankur Crawford of Alger explains in a careful & softly stated discussion with CNBC’s David Faber:
- ” .. If you look at Microsoft’s AZURE, it went from being a ZERO-$ business 7 quarters ago to a $6 billion run-rate today; I would challenge any one to tell me another business that grew from zero to $6 billion in year & half; this $6 business inside of 2 years will be closer to $20 billion in revenue; how much CAPEX do you need? Capex actually makes a lot of sense to me because the demand that they are selling into is significant”
- “if you look at individual kind of ideas of how productivity will improve; we just spoke to a Pharma company which just saved $70 million by using ChatGPT to help them improve the packaging that plastics were in; that’s almost an infinite ROI; so we think we are very very early on ; we have to remember ChatGP kinda exploded onto the scene less than 2 yrs ago & its already on pace to make significant change to productivity; “
- “.. for a majority of companies (not Apple) the PE ratios are actually quite interesting; they are not actually highly valued; … when you are at the beginning of a cycle as significant as this you cannot look at the next 12 months in earnings; you really have to look at what is the earnings power of the business at a fully blossomed state; in 2026, MSFT PE is 20-22 & META has a sub-market PE; that isn’t bubblesque or richly valued”
2. Next?
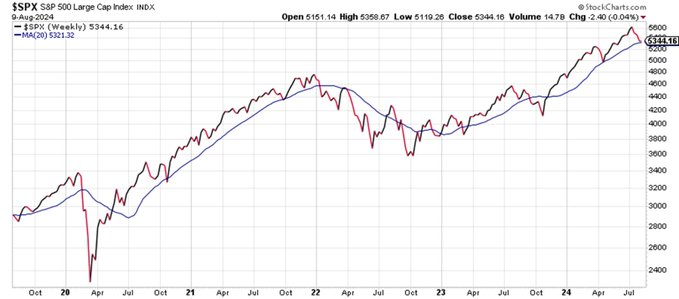
- Ryan Detrick, CMT@RyanDetrick – S&P 500 20-week MA has been significant over the past five years. Sitting on it right now.
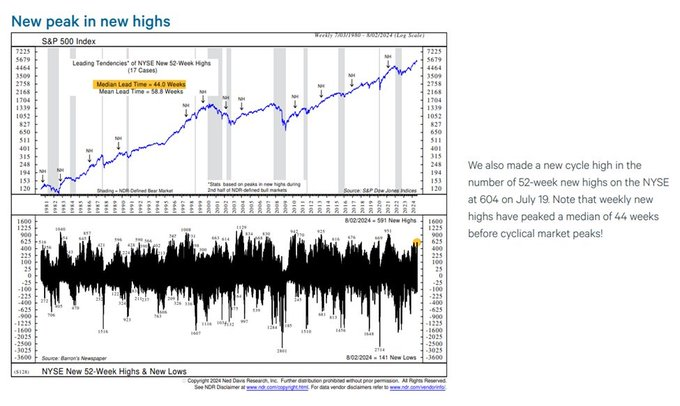
Craig Johnson spoke above about 26-week new highs. Below points out new cycle highs in 52-week highs:
- Seth Golden@SethCL – Ned Davis Research confirms, still much time on the bull market clock⏰ New cycle high in 52-wk highs set on July 19 and $SPX peaks tend to take place a median of 44 weeks after this breadth achievement. $SPY $QQQ $NYA $DIA h/t @RyanDetrick
From a tried & true observer:
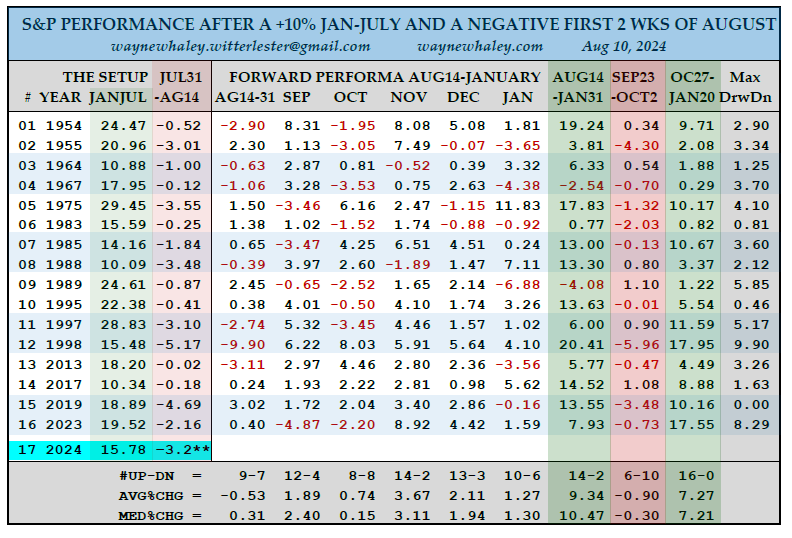
- Wayne Whaley@WayneWhaley1136 – WHEN A NEGATIVE 1ST TWO WEEKS OF AUGUST IS PRECEDED BY A +10% JANUARY-JULY . One of 26 studies on 14 markets shared with commentary subscribers this am – waynewhaley.witterlester@gmail.com. The S&P was up 15.8% in the first 7 months (Jan-July) of 2024 and, as of Aug11, is down 3.2% in August. The S&P has a history of going counter trend in August with early August weakness after a strong year tending to strengthen the case for a bullish finish. For example, since 1950, there have been 16 years in which a double digit, first seven months of the year (Jan-July) was followed by a negative first two weeks of August. The following Aug14-January time frame was 14-2 in this setup for an avg 5 1/2 mt gain of 9.34%. The 5% moves were 12-0 to the positive with the worst drawdown as measured from Aug 14 of the single digit variety. The weakest period, on avg, was Sept23-Oct2 which was 6-10 for an avg loss of 0.90%. The strongest time frame was Oct27-Jan20 which was positive in all 16 of those setups for an avg, 8 week, gain of 7.27%.
And,
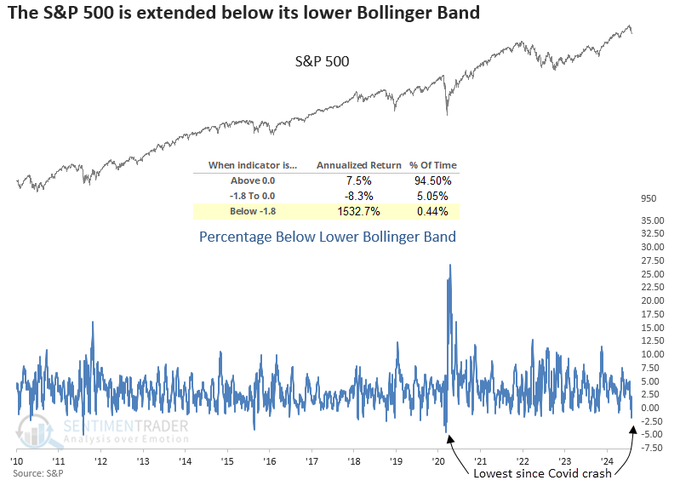
- SentimenTrader@sentimentrader – Aug 8 – For only the 21st time since 1928, the S&P 500 closed more than 1.8% below its lower Bollinger Band, with the index in a long-term uptrend. Similar price patterns preceded an 85% win rate for the world’s most benchmarked index over the subsequent six months.
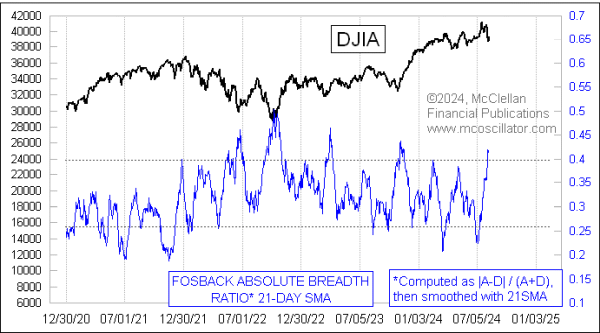
Not many things are described as Absolute. An exception is the Fosback Absolute Breadth Indicator described on Friday August 9 by Tom McClellan:
- Years ago, famed analyst Norman Fosback created an indicator to look at what it means when breadth numbers get really big. …. The large breadth numbers we have been seeing results in a high reading for Fosback’s indicator. And these high readings are reliably associated with important bottoms for stocks. This makes sense, because the bottoming process for stock prices tends to be violent, sometimes with false snapback up days. The current reading is not the highest ever, but it is high enough to mark a good price bottom. And I am talking about more of a bounceback than just one or two up days. Sometimes the highest reading seen on a spike like this comes after the lowest price low, as the big breadth numbers leading the market upward out of that low keep pushing this 21-day simple moving average higher.
3. Treasuries
As Katy Kaminski of Alpha-Simplex said on Bloomberg Surveillance on Tuesday morning (min 52:03 to min 59:48),
- “I think what’s hard about Bonds is that they are very convex; when they move they move very quickly; so its not like you have a couple of days to watch that move; once there is realization that something has to be done by the Fed, people react; …. this time you saw a much stronger reaction in the last couple of months which could indicate we have some sort of trigger when the narrative has shifted to worrying about economic slowdown… the truth is positioning matters … when sentiment shifts, when the trends change, that causes a lot of turbulence … “
Her tense was correct because we not only saw turbulence in the Treasury market the week before (7/29 to 8/2) but we saw a huge move in Treasury yields with 30-yr yield down 34 bps; 20-yr down 34 bps; 10-yr down 39 bps; 7-yr down 43 bps; 5-yr down 45 bps; 3-yr down 48 bps; 2-yr down 50 bps & 1-yr down 45 bps. And yields fell on Monday 8/5 as well.
So when Katy Kaminski spoke, she was speaking after a humongous move in Treasury yields; meaning it was time for some reversion. And it happened. The 30-yr yld rose by 22 bps from Tuesday morning to Thursday afternoon. The 10-yr yield rose by 18 bps from Tuesday to Friday. Then came Friday with the bababa-boom moment at 1:05 pm after the 30-yr auction. On Friday, the 30-yr yield & 20-yr yield fell by 6.5 bps each; 10-yr fell by 6 bps & 5-yr fell by 4 bps.
That action seems consistent with what Ms. Kaminski said about Commodities on Tuesday morning:
- “Commodities – what scares me is you see a pivot in positioning the way you see in past recessionary or selloff traits. … momentum seems to be on the side of a disinflationary bust… right now given the direction of the signals in commodities, do see some deflationary tendencies, shorter signals in commodities may indicate weakness in demand; you see long signals in Bonds … we really do need to think about deflation & what that could mean … “
And she proved right – CLF down 6%, FCX down 2.1%, MOS down 1.3% for the week. Next week CPI & PPI are on deck.
4. Geopolitics
The real Geopolitical danger for the markets is retaliatory attacks by Iran against Israel. We have not believed that Iran would do something as suicidal as that, double especially now that US has publicly & militarily committed to defend Israel.
Frankly, we believe that Iran’s leadership is scared to death about what Israel could do & will therefore only threaten verbally. Below is a clip that argues the same.
Regarding Jews & Hindus, we saw the following this week:
 India Naftali@indianaftali – In a show of unity, Israeli leaders and the Jewish community are speaking out against the extreme violence targeting Hindus in Bangladesh, drawing parallels to their own painful history. This growing alliance between Hindus and Jews reflects a deepening bond, especially since the conflict with Hamas last year. @i24NEWS_EN https://x.com/i/status/1821875391834800157
We think the reaction to the nature of the coup in Bangladesh is going to surprise many. Already & in a stark contrast to the past, angry protests against killings of Hindus have shocked organizations & governments beginning from normally anti-Hindu UN. Given how Congress PM Indira Gandhi is still lauded for her armed intervention in East Pakistan (which became BanglaDesh after surrender of 93,000 Napak troops), there is zero chance PM Modi & his team will allow violence against Hindus & more broadly allow BanglaDesh to foster an Islamic Napaki terrorist environment.
Already the Chief Justice of Bangladesh Supreme Court & a few other Judges plus Head of BanglaDesh Reserve Bank have resigned. It is going to be hard to see how BanglaDesh manages its finances without real peace. Look at the map to see that BanglaDesh is surrounded on 3 sides by India & by the Bay of Bengal on the 4th side. We hear that textile companies that created the export franchise of BanglaDesh are already planning to move to Bihar State in India. We don’t see any major multinational remaining in a Bangledesh that has become inimical to India or discriminatory to Hindus.
Regarding UK, the best comment we saw came from a well-known journalist/podcaster from India:
- Smita Prakash@smitaprakash – Aug 5 – UK created Pakistan in 1947. Now Pakistan is being created in the UK.
Our bottom line is that the next 4 months might be eventful. No one can say with confidence who will be President in January 2025, Kamala Harris or Donald Trump. So the combatants in every conflict might either choose to accelerate their efforts or postpone their plans depending on which side they think will win.
Now to our own favorite idea or fantasy – Merger between Australia & America. Frankly we are being polite because we really mean joining of Australia with USA as the newest state of our Union. We first wrote about this idea on September 3, 2011. We wrote then & still feel today this will be the 21st century equivalent of the Louisiana Purchase of 1801-1802. About 10 years later, we called AUKUS Eminently Sensible on September 19, 2021.
Today we find a discussion on X (Twitter) how the AUKUS deal will essentially make Australia the 51st state of USA. The biggest opponent of this “merger” is Paul Keating, former PM of Australia:
- Guardian Australia@GuardianAus- – Aukus pact will turn Australia into ‘51st state’ of the US, says Paul Keating
Send your feedback to editor.macroviewpoints@gmail.com Or @MacroViewpoints on X.
