Summary – A top-down review of interesting calls and comments made last week in Treasuries, monetary policy, economics, stocks, bonds & commodities. TAC is our acronym for Tweets, Articles, & Clips – our basic inputs for this article.
Editor’s Note: In this series of articles, we include important or interesting Tweets, Articles, Video Clips with our comments. This is an article that expresses our personal opinions about comments made on Television, Tweeter, and in Print. It is NOT intended to provide any investment advice of any type whatsoever. No one should base any investing decisions or conclusions based on anything written in or inferred from this article. Macro Viewpoints & its affiliates expressly disclaim all liability in respect to actions taken based on any or all of the information in this article. Investing is a serious matter and all investment decisions should only be taken after a detailed discussion with your investment advisor and should be subject to your objectives, suitability requirements and risk tolerance.
1.Interesting Friday in March
Got to begin with:
- Walter Deemer@WalterDeemer – chart

How about a statistical probability projection on market action in April from a time-tested analyst?
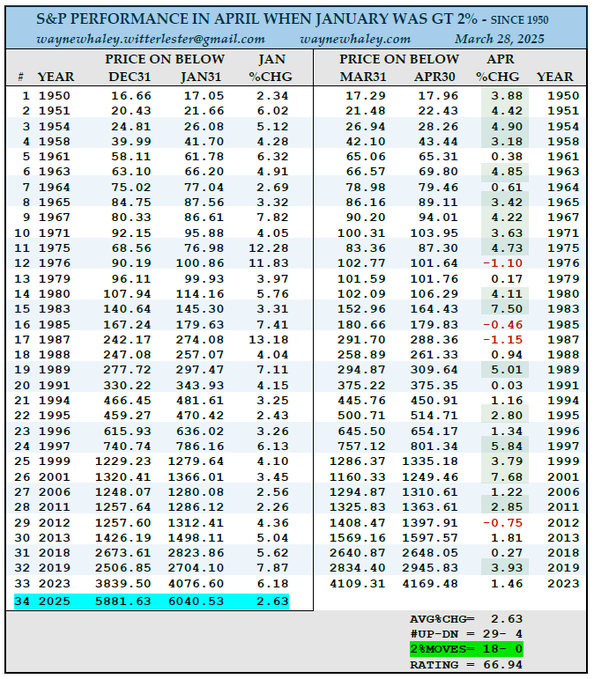
- Wayne Whaley@WayneWhaley1136 – Sat – A 29-4 APRIL COMPLIMENTS OF A +2% JANUARY – The month of April is 53-22 since 1950 for an average monthly gain of 1.46%. January of 2025 was up 2.70%. January has a great record as a Barometer for the rest of the year especially it’s Earning Season sister, April. Since 1950, if January was up at least 2%, April was 29-4 for an average monthly gain of 2.63%. Note that the 2% moves in April in this +2% January setup were 18-0 to the positive side. One of 18 studies on 14 markets along with market commentary shared with commentary subscribers this weekend. waynewhaley.witterlester@gmail.com
In case you wondering what Signor Detrick is saying?
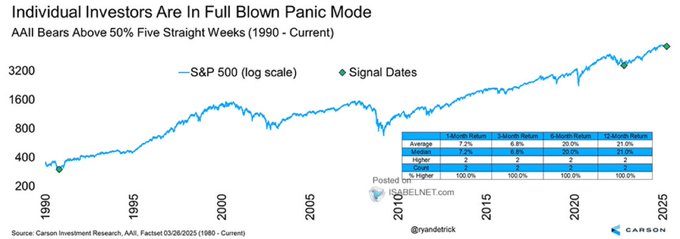
- Steve Burns@SJosephBurns – Mar 28 – Historically, when bearish sentiment in the AAII poll surpasses 50% for five straight weeks, US stocks have shown an average return of 21% over the next 12 months, with positive returns occurring 100% of the time since 1990 Via @RyanDetrick
Was there any one who came in on Friday afternoon & was positive? One man we heard was Craig Johnson of Piper Sandler who thankfully was allowed to speak for a couple of minutes just before 5pm on CNBC. As we recall, he called this week’s sell-off as a re-test & pointed to the “extremely low volume“; he also said there were “no buyers out there“; he said that “sentiment measures are really extreme” and he “wants to be greedy when others are fearful“.
Why was Craig Johnson relegated to the last couple of minutes of Friday’s 4 pm show when the host & presumably the show’s handler knew he was going to say Buy? Especially when the show spent several times longer discussing theory about China in the show’s opening segment! Then the CNBC show did NOT put the clip of Mr. Johnson’s bullish statements on YouTube or on CNBC.com!!!!
As we recall, Craig Johnson has come on CNBC during some previous serious downturns & essentially said buy. On those occasions, he has been proved right. So why was his appearance not put on CNBC’s website? Was a theoretical conversation about China so important to CNBC on that turmoil-ridden Friday after the close? As we have said before, CNBC’s priorities perplex us.
Below is a summary of the thoughts of a sensible practitioner:
- Larry Tentarelli, Blue Chip Daily@bluechipdaily –
– Weekly chart trends for SPX and NDX are weaker, with lower weekly closing lows, but still above recent pullback lows.
– Friday’s bond market action says the Fed Put is further off than many think, which is a negative.
– X/Fintwit sentiment, which is one of my favorite contrarian indicators, usually a great fade, is as bearish as I have seen it since 2022.
– While the risk is to the downside in the index charts right now and I am positioned much more defensively, there could be wide ranges this week with April 2 and then NFP on Friday.
– 202 large caps are higher YTD, + over the 20, 50 and 200-sma, so there are plenty of charts working currently. 138 of these are +10% or more YTD.
– With that said, if the indices make lower lows, I expect most SPX charts to pull back.
– I have been reducing my index exposure over the past 6 weeks, increasing cash and upgrading positions to charts in uptrends, but in smaller than average sizing.
– Using the 2018 tariff cycle as a blueprint for 2025 is a bad bet. Each market has unique circumstances. Focus on the current charts.
– As long as SPX and NDX stay under the 200-day MA, I will stay positioned much more defensively.
A quick look at the last week via US Indices & some key stocks:
- VIX up 12.1%; Dow down 96 bps; SPX down 1.53%; RSP down 1.1%; NDX down 2.39%; SMH down 5.9%; RUT down 1.65%; MDY down 1.1%; XLU down 1.04%;
- AAPL down 15 bps; AMZN down 2%; GOOGL down 6%; META down 3.5%; MSFT down 3.3%; NFLX down 3%; NVDA down 7.3%; MU down 16.8%
2. US vs. Europe & China
The evidence is clear so far in 2025:
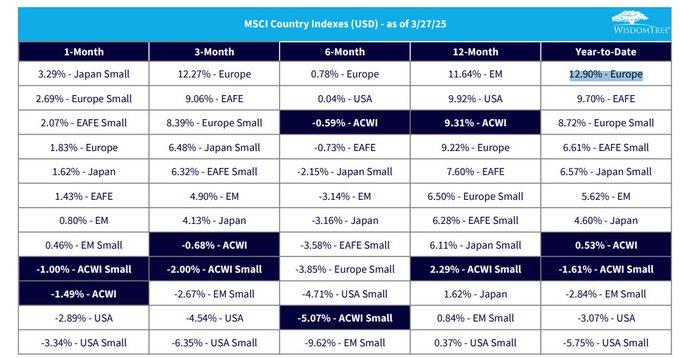
Mike Zaccardi, CFA, CMT 🍖@MikeZaccardi – Europe is having a year! +13% YTD. USA dead last.
Given this near-consensus, we were pleasantly surprised to hear Stephanie Link say on CNBC Half-Time on Tuesday that “I would fade Europe in a heartbeat”; … Europe over USA is done“.
We also saw:
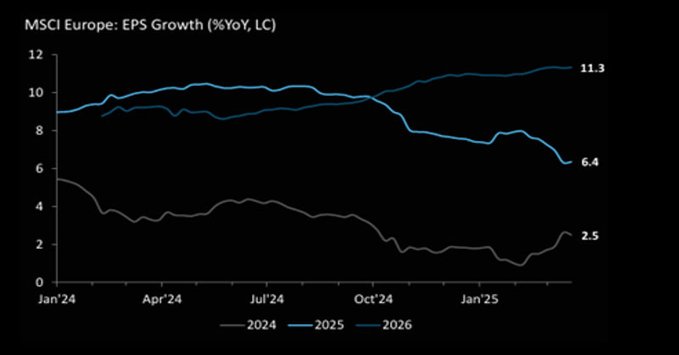
- The Market Ear@themarketear – Europe being Europe…Earnings expectations in Europe (consensus) may have already peaked and appear to be declining.
Also on Tuesday, we saw:
- zerohedge@zerohedge – Chinese Tech Stocks Plunge From 3 Year High To Correction In Just 5 Days
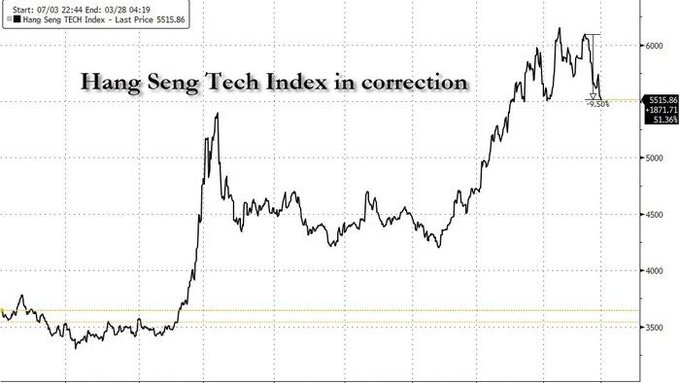
That brings us to the clip that CNBC Closing Bell Overtime chose to feature as its top story after a horrible day in the US Stock market while relegating to the bottom Craig Johnson’s bullish views on US stocks. Read what Gary Dvorchak, Blueshirt Group managing director, said at the beginning of the segment:
- ” .. I want to put in some context … Chinese Government has very few options now to stimulate the economy; China is in a depression; there is no doubt about that; and they are also in a pretty nasty bout of deflation right now; … exports your way back to growth & more robust economy is going to be very difficult to impossible … so the Chinese government, rightly, is looking at every single option “
This is important stuff no doubt in a strategy sense but the clip doesn’t include any views about the Chinese Stocks/ADRs US investors own. We don’t get why CNBC chose this “robust” discussion to lead the after-market show on the worst Friday of 2025.
Stephanie Link said on Tuesday on CNBC Half-Time that she only owns China via US companies in China. Then she added “Best value internationally is India; best earnings growth between now & 2030; that’s where you have to put money; you will see 6% type growth“. For a more detailed discussion on India, see the clip of Jim Walker, Chief Economist of the Alethia Group in Honk Kong.
A quick look at last week in International Stocks;
- EEM down 1.8%; FXI down 2.2%; KWEB down 1.5%; EWZ down 2%; EWY down 3.7%; EWG down 2.7%; INDA down 23 bps; INDY up 98 bps; EPI down 28 bps; SMIN down 1.9%;
3. Fixed Income vs. Equities
Think back to 2007-2008. How long did the Fed resist lowering rates despite steady erosion in the soft data? They waited too long & then they panicked to little avail. Now we are seemingly back to a similar situation. The soft data is not only getting weak but it is getting weaker & faster. But it is not yet showing up in the hard data, labor data. So this Fed is publicly resistant to the idea of easing sooner.
This was brought up again this week by Max Kettner, chief multi-asset strategist at HSBC, a man who has been right more often than wrong. Look what he said to BTV’s Jonathan Ferro this week:
- “what changed I think now is we see a much more sort of a broader based slowdown among all the soft in the survey data; CEO confidence – we have had the biggest 1-month slump since September 2008. Philly Fed had the biggest 2-month drop in new orders in history; that series go back almost 55-60 years; …”
So what could happen? Kettner said:
- ” I don’t think it will take 3-4-5 months; its not going to be a recession that’s coming in the second half; I do fear that we might get a pretty sharp slowdown in the data very early on; very very soon“.
So Kettner is now negative on US Equities & Under-weight High -yield credit & Under-weight Investment Grade credit. Guess that leaves Treasuries. Now look what Treasury rates did on Friday despite a stronger PCE number:
- 30-yr yield down 9 bps; 20-yr down 9.4 bps; 10-yr down 10.8 bps to 4.261%; 7-yr down 11.1 bps to 4.12%; 5-yr down 11.2 bps to 3.986%; 3-yr down 9.7 bps to 3.9%; 2-yr down 8.6 bps to 3.9%; 1-yr down 5.8 bps to 4.05%
Another money manager agrees:
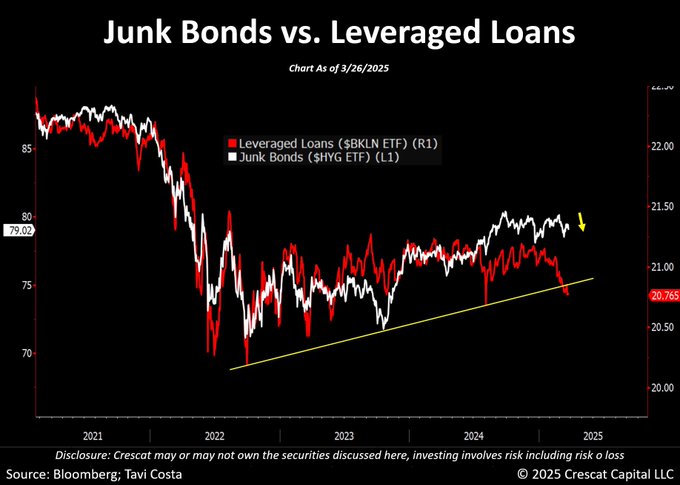
- Otavio (Tavi) Costa@TaviCosta – This is a very important chart. Leveraged loans have already broken down, and junk bonds are just starting to roll over, in my view. We are starting to see clearer signs of credit deterioration. My 2 cents: A blowout in credit spreads remains one of the most underappreciated risks in the market today.
The Fed signals that it doesn’t care yet. Is that because they disagree with the above risks OR because they are terribly afraid of a really big storm they face in the Treasury market?
How do we know while Fin TV economic reporters don’t know or pretend to not know? We know because, despite being of simple minds, we can read. Read what 4 economics luminaries named Anil Kashyap, Jeremy Stein, Jonathan Wallen & Joshua Younger published last Wednesday, March 26, 2025 on Brookings.edu. CNBC viewers might recall that Steve Liesman recently said Fed Chair Powell considers Anil Kashyap as the smartest economist he has met.
The title of their article is – Treasury market dysfunction and the role of the central bank. Excerpts below might help understand the scale of the problem.
- Thinly capitalized hedge funds’ growing role in the enormous and rapidly expanding market for U.S. Treasury securities poses a clear and present danger to financial stability that warrants a new approach from the Federal Reserve during times of extreme market stress,
- authors examine changes in the Treasury market since March 2020, when the Federal Reserve purchased more than $4 trillion of Treasuries and government-backed mortgage securities to calm turmoil in those markets triggered by the COVID pandemic.
- “These problems threatened to spill over into other markets as well, potentially interrupting the smooth flow of credit and impairing the implementation of monetary policy,…. It is natural to wonder whether such episodes of fragility will become more frequent and/or more severe as the Treasury market continues to grow.
- The vulnerability arises because the hedge funds, which are more lightly regulated than broker-dealers, finance their Treasury holdings almost entirely by borrowing against them. Thus, any number of shocks can lead the hedge funds to quickly exit the trade, requiring the broker-dealers to step in, at least in the short term.
- The authors recommend that the Federal Reserve, in periods of extreme stress, be prepared to take over the hedge funds’ positions. As before, the Fed could stand ready to purchase Treasury securities but it would also, as the hedge funds do, take offsetting short positions in derivatives.
So the Fed has to be ready to take over the mega ($4 trillion+?) Treasury positions of Hedge Funds? How puny does that make the Long Term Capital bailout? Is this why the financial stocks did what they did last week?
- BAC down 2.8%; C down 2.3%; GS down 4.2%; JPM up 23 bps; KRE down 1.8%; EUFN up 3 bps; SCHW down 94 bps; HDB up 2%; IBN down 6 bps;
How bad did it get in March 2020? As the report states – “the Federal Reserve purchased more than $4 trillion of Treasuries and government-backed mortgage securities to calm turmoil in those markets triggered by the COVID pandemic“. How much bigger would be a 2025 purchase bailout? Let’s not even think how tiny was the Long Term Capital crisis that threatened to destroy Wall Street!
Those who prefer to have someone explain such stuff to them instead of reading it might watch the clip below. We would recommend you ignore the sensation creating title of the clip that really focuses on the above Brookings Report:
With all this stuff, are we glad we have an expert like Treasury Secretary Scott Bessent to manage this mess which was left behind by whoever? You Bet!
4. Our two cents
Despite all the above, we tend to concur with Craig Johnson, Ryan Detrick & the others who are looking ahead. Not because we know even a fraction of these veterans know but because we are simple in our mind & thinking. Think back to March 2023 when Schwab stock cratered because of bond maturity crisis. Think way back to March 2008 when the Bear Stearns hedge funds cratered. One worked well, one didn’t. BUT remember that both blowups in March-April were smoothened without a crisis. What we see is that crisis that erupts in March-April is almost always gets addressed & at least temporarily solved without major market damage.
We expect the same with the fast & frightening stock market correction going on & the specter of the basis point turmoil in the Treasury market. We can’t speak about the September-October timeframe but this crisis in March-April 2025 should get resolved to the upside.
But when Friday close is as bad as Friday March 28 was, prudence since 1987 dictates purchase of 1-2 days puts way out of the money, such as for example March 31 QQQ 450 puts for $0.12 cents. Probably amateurish stupidity but 12 cents is worth a pleasant weekend!
Send your feedback to editor.macroviewpoints@gmail.com Or @MacroViewpoints on X.