Summary – A top-down review of interesting calls and comments made last week in Treasuries, monetary policy, economics, stocks, bonds & commodities. TAC is our acronym for Tweets, Articles, & Clips – our basic inputs for this article.
Editor’s Note: In this series of articles, we include important or interesting Tweets, Articles, Video Clips with our comments. This is an article that expresses our personal opinions about comments made on Television, Tweeter, and in Print. It is NOT intended to provide any investment advice of any type whatsoever. No one should base any investing decisions or conclusions based on anything written in or inferred from this article. Macro Viewpoints & its affiliates expressly disclaim all liability in respect to actions taken based on any or all of the information in this article. Investing is a serious matter and all investment decisions should only be taken after a detailed discussion with your investment advisor and should be subject to your objectives, suitability requirements and risk tolerance.
1.NFP Friday
A smallish beat in the Non Farm Payroll report seemed to do the trick.
(DXY)
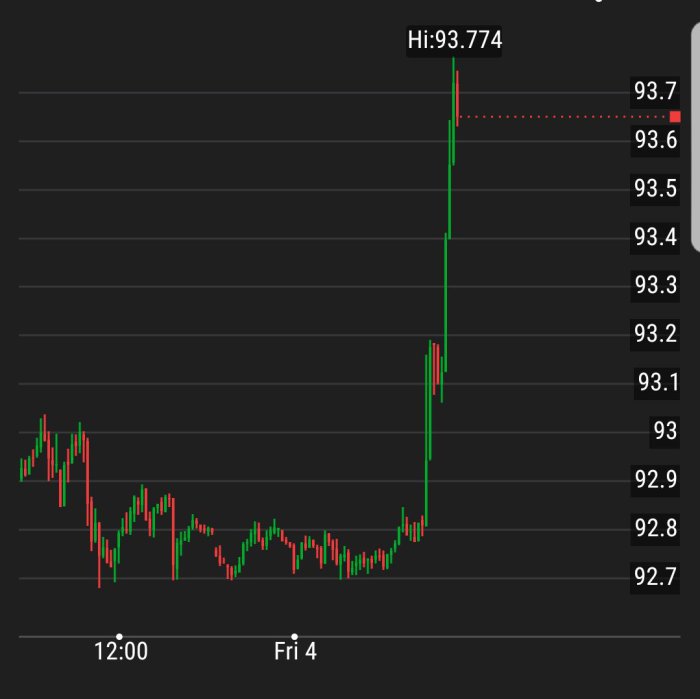
On Friday, the Dollar rallied by almost 80 bps; Treasury yields rose, Gold-Silver fell, the Russell 2000 outperformed the Dow, S&P, Nasdaq & EEM. This was a reversal of not just this week but of the past two weeks.
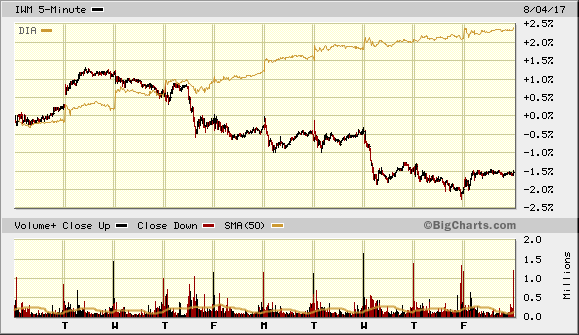
Built into the above two is the outperformance of the Dow Jones over the S&P. Is that solely due to a few high price Dow stocks rallying hard or is there a message in there? One view seemed negative:
- Jeffrey GundlachVerified account @TruthGundlach – Seems to be an eerie acceptance of riskier and riskier bond strategies lately. And now the Dow up 9 days in a row with S&P DOWN same period!
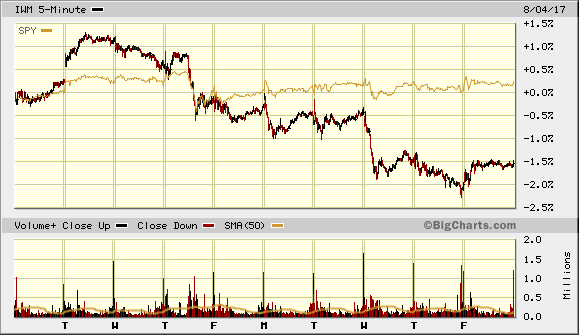
There is no question about the consolidation action in the S&P or about the negative action in the Russell 2000 of the past two weeks. Thursday’s close seemed particularly bad leading the normally bullish Tony Dwyer of Cannacord Genuity to point out that the Russell 2000 had broken below its 50-day while the Dow made a new all-time high. That has meant, Dwyer said, a median decline of 1.5% in 79% of such cases.
Friday’s action did seem to shine a different technical light with the Russell 2000 coming awfully close to regaining its 50-day average; the Transports bouncing off their 200-day and the Dollar making a double bottom off of an oversold condition not seen since 1978 per Tony Dwyer.
But nothing has changed looking at it from a two-week view – Dollar is still a little lower, the Dow is 500 points higher, S&P is a bit higher, both Nasdaq & NDX are lower, the Russell 2000 is 1.7% lower (was that the median decline of 1.5% described by Tony Dwyer?); Treasury yields are still higher; Gold, Silver & Oil are all higher.
So while the Dollar, Transports have bounced off important levels & the Russell 2000 is close to doing so, the jury is still out on Friday’s bounce.
- Jeffrey GundlachVerified account @TruthGundlach – Last time this mood took over it ended very badly. Look at your investments with 2009 eyes. Did you tail hedge then? Should you risk up now?
But before we look at 2009, shouldn’t we look back to 2007-2008?
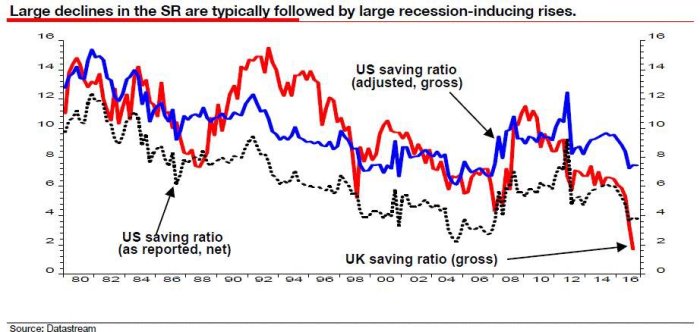
- Holger Zschaepitz @Schuldensuehner Jan2008 is here again, SG’s Edwards says as recent data shows slumping household saving ratios in both US & UK. This was last seen in 2007.
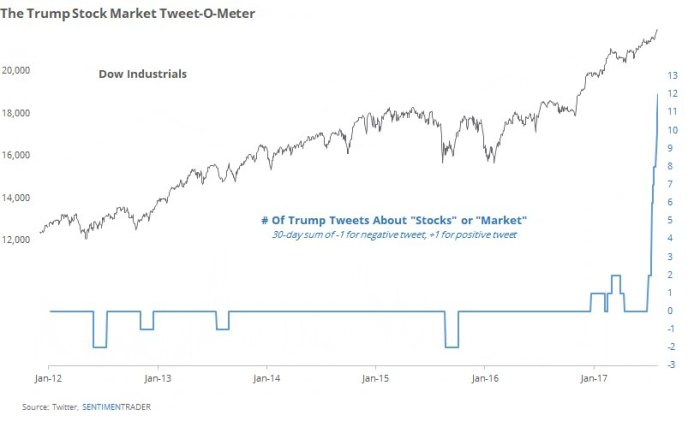
 We don’t think Gundlach was referring to the below when he mentioned “mood” in his tweet above. But it is an interesting indicator!
- SentimenTraderVerified account @sentimentrader It’s time to update the
@realDonaldTrump Stock Market Tweet-O-Meter. Going parabolic.
Gundlach is also right, we think, in saying things could end very badly. But when? Because even a bearish indicator is suggesting we have a couple of months or so.
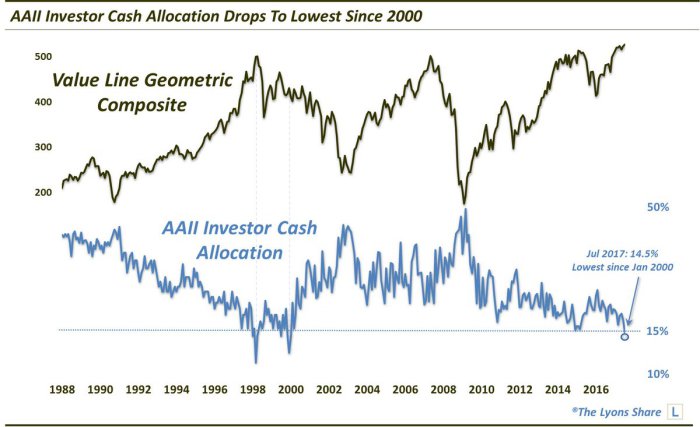
- Dana Lyons @JLyonsFundMgmt 6 minutes ago- ICYMI>ChOTD-8/2/17 Are Investors Running Out Of Cash? $SPY $VALUG Post: https://lyonssharepro.com/2017
/08/are-investors-running-out- of-cash/ …
- Specifically, the July 2017 reading of investor cash came in at 14.5%. This was the lowest level in the survey since January 2000. In fact, the only lower readings in the survey’s history back to 1987 occurred in January-April 1998, July 1999 and November 1999-January 2000.
Note that in all these previous cases, the real decline didn’t start for a bout 3-6 months after the lows in Cash.
Our own posture is to wait till next week to see if Friday was a real bounce or a one day wonder. No point opining or charting until then.But if we are forced to make a bet for early next week, we would bet on trades that reduce the divergence of the past two weeks – Russell 2000 outperforming SPY, SPY outperforming Dow & Dollar rising.
2. Step Function!
The Scaramucci-Priebus theater seems so old doesn’t it? Nobody is talking about it anymore. And it was only a week ago. The new White House regime led by Chief of Staff Kelly seems so much better, doesn’t it?
That has been the reality of the Trump campaign & now the Trump Presidency. Think back and you will see every reorganization has come with an emotional & media explosion and every one has lead to a better outcome. Manafort replacing Lewandowski led to a successful Republican convention. Then came the Bannon & Conway hire after a media explosion.
Thinking about this graphically, you see that the Trump journey has been an ascending step function with each step higher than the previous one. It is just that the jump from one step to another comes with a highly theatrical event with an emotional climax.
Think about this Step Function analogy when the next event strikes & the media explodes into an emotional frenzy. This analogy will let you enjoy the theater without getting perturbed.
Send your feedback to editor@macroviewpoints.com Or @MacroViewpoints on Twitter
