Summary – A top-down review of interesting calls and comments made last week in Treasuries, monetary policy, economics, stocks, bonds & commodities. TACs is our acronym for Tweets, Articles, & Clips – our basic inputs for this article.
Editor’s Note: In this series of articles, we include important or interesting Tweets, Articles, Video Clips with our comments. This is an article that expresses our personal opinions about comments made on Television, Tweeter, and in Print. It is NOT intended to provide any investment advice of any type whatsoever. No one should base any investing decisions or conclusions based on anything written in or inferred from this article. Macro Viewpoints & its affiliates expressly disclaim all liability in respect to actions taken based on any or all of the information in this article. Investing is a serious matter and all investment decisions should only be taken after a detailed discussion with your investment advisor and should be subject to your objectives, suitability requirements and risk tolerance.
1. Fed on deck
This was the best week of the year and it really began at the depth of the decline on Thursday, October 16th. The S&P is up 100 handles since that Thursday’s close. Such is the power of the QE word uttered by a Fed-head. Recall what James Bullard, St. Louis Fed President, said to Michael McKee of BTV on Thursday, October 16:
- “I also think that inflation expectations are dropping in the U.S. And that is something that a central bank cannot abide. We have to make sure that inflation and inflation expectations remain near our target. And for that reason I think a reasonable response of the Fed in this situation would be to invoke the clause on the taper that said that the taper was data dependent. And we could go on pause on the taper at this juncture and wait until we see how the data shakes out into December.”
The pause in the final taper of $15 billion is not important by itself. However, what that pause would signal is critical. After all, inflation expectations are critical to Chair Yellen as they are to Mr. Bullard. And they are going in the wrong direction:
- Monday – A Evans-Pritchard @AmbroseEP – HSCB’s David Bloom today. “negative inflation surprises intensifying” in G7/Asia.

We do not expect the Fed to pause this last taper, especially after the terrific rally in the stock market. But will they signal a more dovish attitude towards raising interest rates? Will the Fed statement back up the concern expressed in the minutes of the last FOMC meeting released on October 8th? Or will the Fed statement be substantially similar to the one released on September 17th? What has been factored in the rate markets? One view is:
- Friday – Matthew B @boes_ What are we calling this one?
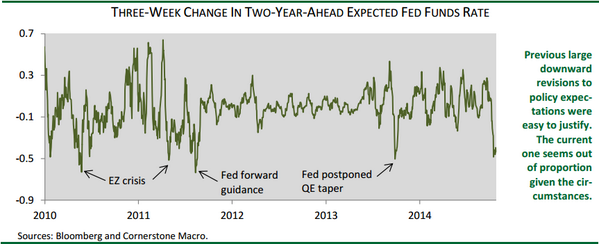
Some recall the FOMC meeting on October 31, 2007 which came after a massive rally in stocks. Bernanke disappointed the markets with a more hawkish than expected statement and stocks sold off in November 2007. Today is a different scenario with all the central banks maintaining a zero rates policy with a verbal commitment to QE. That is why the markets behaved this week with the conviction that last week’s decline marked the bottom after a 10-% correction.
Many people have talked about 2007 but is it possible we see a 1999 type run to the end of the year? The Fed gives a dovish signal, BoJ talks QE on Friday, & Draghi follows up with expectations if not actual buying. The U.S. data comes in OK just like the earnings this week. Republicans take the Senate in November and Ebola becomes less scary. Can we see a stampede into year-end in search of performance?
2. U.S. Dollar
What will a dovish Fed mean for the U.S. Dollar? Hedge fund icons don’t think that matters:
- Kyle Bass to CNBC’s David Faber – “On 29th, we think we taper to zero; we are going to take that last $15 billion & taper to zero; two days later, the bank of Japan meets & I think Kuroda is gonna go & have his Draghi moment; … Europe/Draghi is really going to go all in to get to overt QE … you have the US tapering to zero … that environment will mean strong dollar no matter how anyone looks at that;”
- John Burbank to Faber – “with the Fed actually ending QE, the Dollar can rally; dollar rallying in 3rd quarter really upset a lot of positioning; the $ stopped rallying beginning of October and then stocks took on all the volatility since; longer term I think, the S&P & the Dollar are what you want to own;”
On the other hand,
- Friday – Walter Murphy @waltergmurphy – Let’s be careful. I can count today’s $DXY pullback as wave 4-of-5 from the May 78.91 low. Cd be set up for the biggest correction in months
And the sentiment picture seems ripe for change to:
- Tuesday – J.C. Parets ?@allstarcharts – there’s still a crazy amount of extreme bullish sentiment towards US Dollar. I can’t own it in the face of all that $DX_F $UUP u can have it.
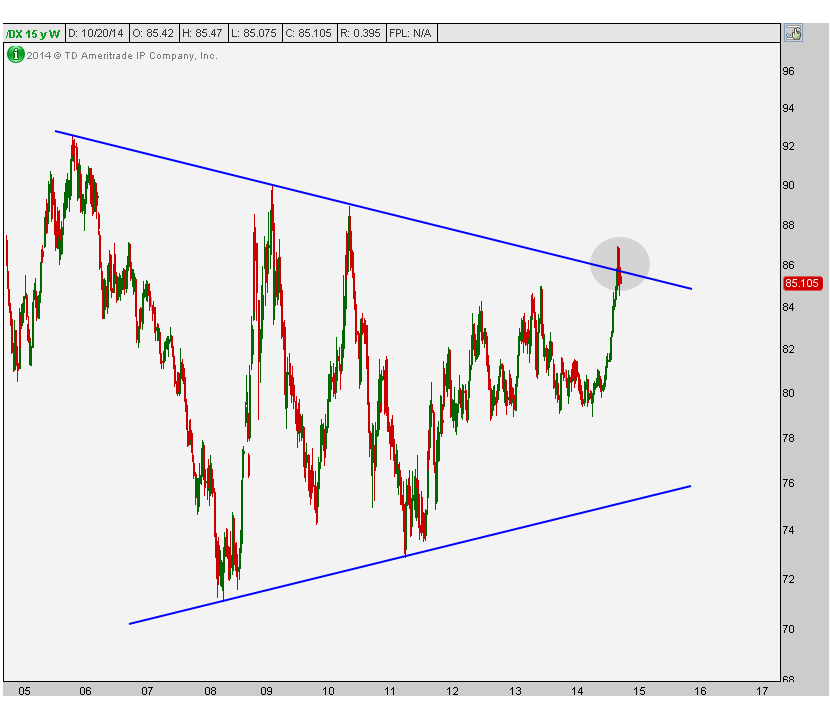
On Monday, Parets posted an article titled Was That A Failed Breakout in the US Dollar? In that article, he uses a chart to demonstrate the crazy bullish sentiment referred to in his tweet:
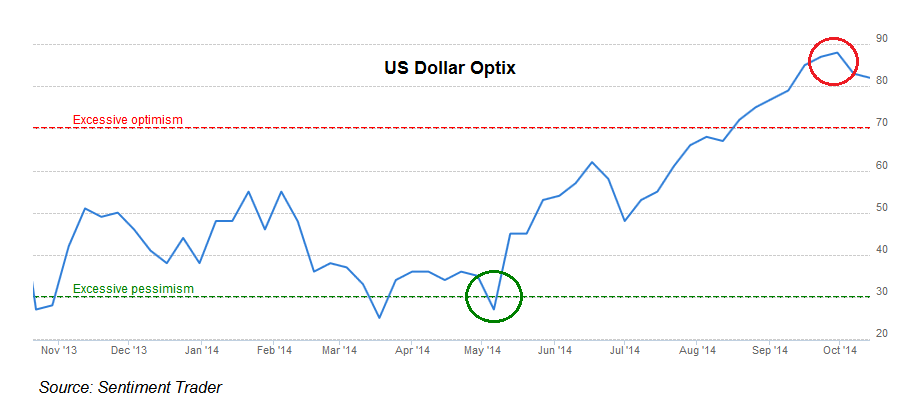
Then Parets looks at the chart:
- “Here we are looking at a weekly candlestick chart of the US Dollar Index. Since 2005 we have been in a symmetrical triangle well-defined by these two converging trendlines. After the epic rally since May, prices exceeded the upper of the two trendlines. But as you can see in this chart, it doesn’t seem to be holding:”
His summary?:
- “When price action and sentiment agree with one another, we generate great signals. … At this point, it is really starting to look like a failed breakout. … This is such an interesting market right now ….”
Chair Yellen will rule on this debate between fundamentals & technicals on Wednesday, October 29.
3. U.S. Equities
We think simplistically that what Chair Yellen says will determine both the if & how of the year-end stock rally. Others, like David Kotak of Cumberland Advisors, come to that decision with deliberation and analysis. He thinks that “interest rates at the short end of the yield curve will remain very low well into 2015 and then rise slowly.” So he wrote on Friday:
- “… we are all-in. We think we will see new highs and above 2,000 in the S&P 500 Index before the end of this year. We think a market-priced at 16 times earnings is cheap in a climate of near 2% 10-year riskless US Treasury yields. $125 S&P 500 index earnings for 2014 multiplied by a 16 P/E equals a 2000 price of the index. Forward earnings (next year’s estimates) are expected to rise 6% to 8%, so the forward-looking P/E is lower. Thus, an equity risk premium (ERP) calculation suggests that this stock market can go higher. Right now, the ERP suggests owning US stocks. They are cheap, relatively speaking, and are headed higher unless the market believes that interest rates are going to make a meaningful upward move. If you think interest rates are going to spike higher, stop reading here and sell your stocks.”
David Rosenberg of Gluskin Sheff wrote this week:
- “US recession risks are barely above zero … spells a sustained bull market, notwithstanding the brief intermittent corrective activity along the way; components of the conference board’s leading economic index suggest that we are at least two years away from the next recession; Bear markets are caused by tight money, recession, or both these conditions do not apply, nor will they until 2016 at the earliest; There was more damage than met the eye during this latest corrective phase but a lot of the excess has come out.”
John Burbank of Passport Capital was more cautious in his comments to CNBC’s David Faber:
- “longer term I think, the S&P & the Dollar are what you want to own; whenever risk avoidance ends, you are gonna want to own growth; we are fully invested & fully hedged … very possible for market to top in this rally & move lower“
Scott Minerd of Guggenheim is also cautiously optimistic:
- With the anticipated seasonal pattern of higher volatility in September and October now largely fulfilled, we anticipate more positive seasonal factors over the next two months. Over the last 68 years, the S&P 500 has averaged monthly gains of 0.9 percent in October, followed by even stronger increases of 1.2 percent in November and 1.8 percent in December.
- The current dark cloud that hangs over Europe is a serious threat and something that investors should closely monitor. If the anticipated seasonal strength—which is typically driven by an influx of cash into pension funds that their managers are keen to put to work—is not forthcoming, investors should seriously question how much further the current bull market can run. As of now, we remain cautiously optimistic as we await some crucial economic data.
Ryan Detrick argues for a strong year-end rally in his article Three Charts That Scare The Bears:
- “active managers just panicked. Looking at the National Association of Active Managers (NAAIM) Exposure Index it shows active managers just threw in the towel. I discussed this survey in this article over at See It Market, but I like this survey as it looks at the overall equity exposure of active managers. So this isn’t just some average Joe’s opinion. The recent reading of 9.97 was the lowest level of equity participation since September 2011. In fact, levels this low have been nice buying opportunities recently.”


Detrick ties this together via:
- “October is also known for making some major lows the second half of the month. This of course sets up the historically strong end of year rally. … don’t forget the single most bullish factor stocks have going for them is the fourth quarter of the second year of the Presidential Cycle (so this quarter) is the strongest quarter every four years.”
Bearish technicians have been proven wrong this week. Carter Worth who recommended selling at the end of last week thereby missing the best week of the year. But he remained steadfast on this Friday on CNBC Options Action:
- “I wish we had gone down more to 1700, to really reset valuations, … We bounced so quickly we haven’t allowed the market to engage in true price discovery. All that’s happened is, we’ve returned to a difficult level. I suspect more selling is to come.”
Also wrong was Jonathan Krinsky of MKM Partners who, according to the Wall Street Journal, wrote on Monday:
- “We came into last week looking for a tradable rally, … While that low may very well stand, in our view the game has changed sufficiently enough that the v-shaped rebound we have become accustomed to over the last two years is unlikely to occur this time around.”
These are veteran smart technicians but, as we have said before, when markets smell more QE, charts get run over. But what about traders who see a potential 2007 like pattern like @NorthmanTrader whom we featured last week? On Monday, he tweeted with foresight:
- Monday afternoon – Northy @NorthmanTrader – This is what it looks now

- “I’m firmly in the camp that eventually we will see a deeper correction, but for now the market may just be following the 2007 script and produce higher prices still. Sellers need a breakdown that sticks and so far the only evidence we have are symptoms of Ursus Interruptus. I wait for evidence for more.”
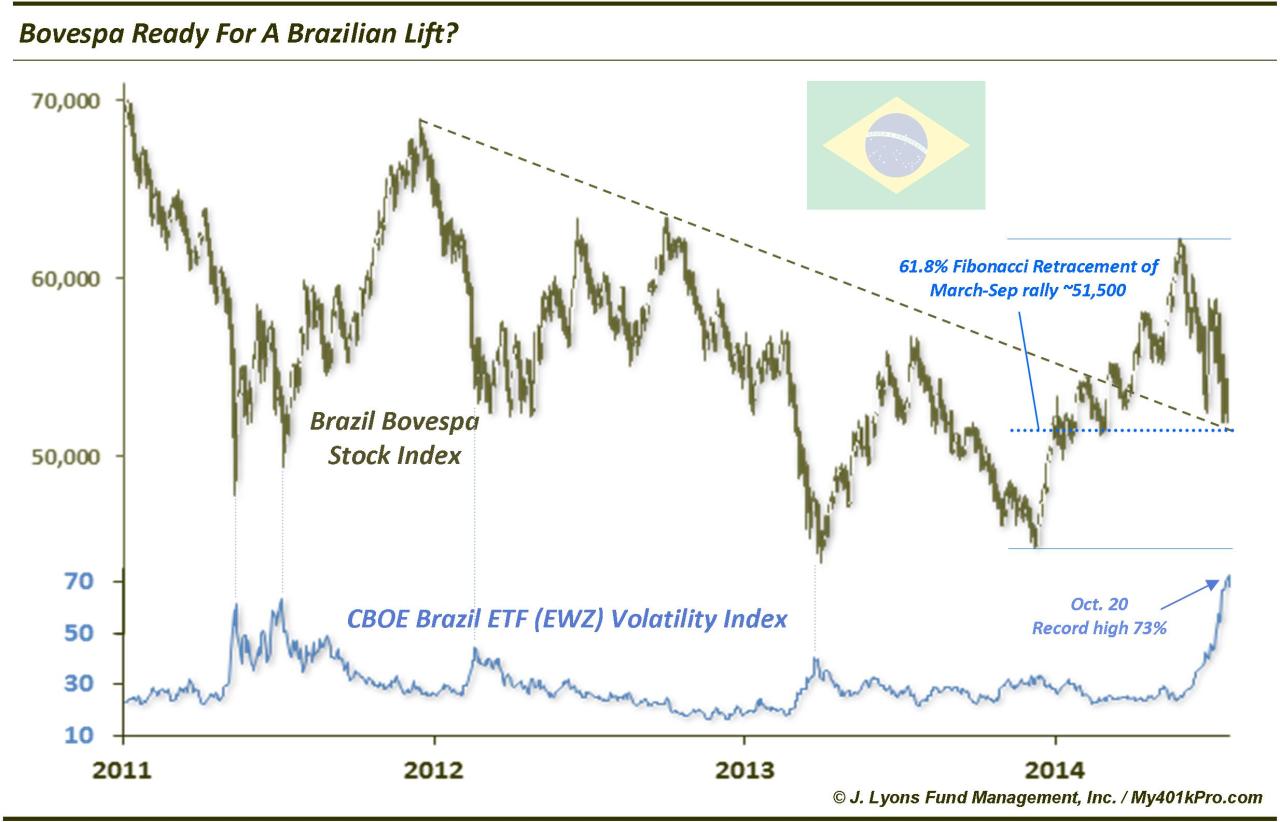
- “Current prices are at key potential support levels and the “fear guage” Volatility Index on Brazilian stocks is at a record high. These conditions should provide at least a temporary lift to the market. Of course, markets don’t always do what they “should” do. If the Bovespa cannot hold this key level, especially in the event of an unfavorable election outcome, the market may continue to sag.”
- Thursday – Futures Magazine @FuturesMagazine – Treasuries: Could see strong selling soon http://www.futuresmag.com/2014/10/23/treasuries-could-see-strong-selling-soon

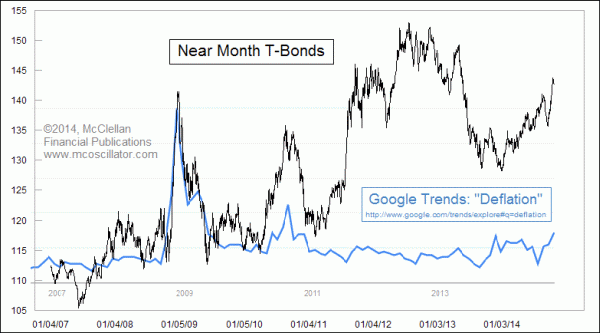
- “The result is a crude but workable overlay which allows us to see that when the subject of “deflation” gets really popular in the press, that tends to mark a top for T-Bond prices. How much of a top may be different from one instance to another, but the principle is relatively consistent.”
- Monday – John Authers @johnauthers Gold lovers and chartists, this one’s for you. Has gold made a triple bottom? Thoughts welcome….
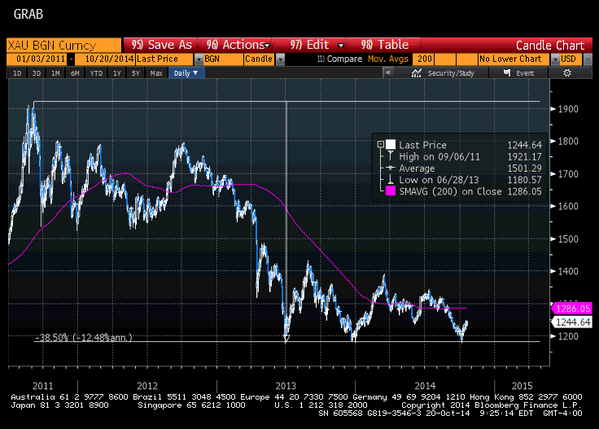
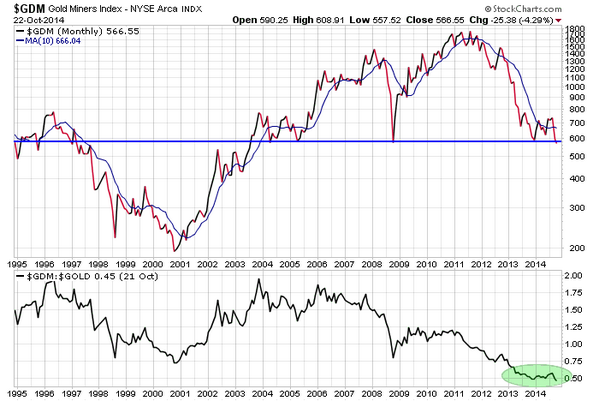
- Wednesday – Jesse Felder @jessefelder – Gold miners ($GDX) have not been this cheap relative to gold ($GLD) in at least 20 years (no pos.)
