Summary – A top-down review of interesting calls and comments made last week in Treasuries, monetary policy, economics, stocks, bonds & commodities. TAC is our acronym for Tweets, Articles, & Clips – our basic inputs for this article.
Editor’s Note: In this series of articles, we include important or interesting Tweets, Articles, Video Clips with our comments. This is an article that expresses our personal opinions about comments made on Television, Tweeter, and in Print. It is NOT intended to provide any investment advice of any type whatsoever. No one should base any investing decisions or conclusions based on anything written in or inferred from this article. Macro Viewpoints & its affiliates expressly disclaim all liability in respect to actions taken based on any or all of the information in this article. Investing is a serious matter and all investment decisions should only be taken after a detailed discussion with your investment advisor and should be subject to your objectives, suitability requirements and risk tolerance.
1.”Beautiful, the Best”
And they say, economics & numbers are unromantic. Frankly, we don’t remember so many people speaking so eloquently about payroll numbers.
- DowVerified account@mark_dow – Beautiful numbers. The best numbers.
Guess what David Rosenberg said about Friday’s NFP numbers?
- David Rosenberg@EconguyRosie– Nothing quite like writing up the payroll synopsis from Barbados. The report was as sunny as the weather here and compels me to revisit the 9th inning cycle theme.
Revisiting 9th inning cycle theme is a big deal indeed. But didn’t unemployment go up a bit?
- Ben CasselmanVerified account@bencasselman– Unemployment rate rose, but so did participation — more people reentering the labor force.
Jim Cramer said “this economy is very strong and it is not overheating“. Rick Santelli pointed out there was “no wage pressure“. Jim Paulsen of Leuthold Group called it Goldilocks & wondered “if Fed is done a bit“.
Strategist Tom Lee took a fast break from pushing BitCoin to opine:
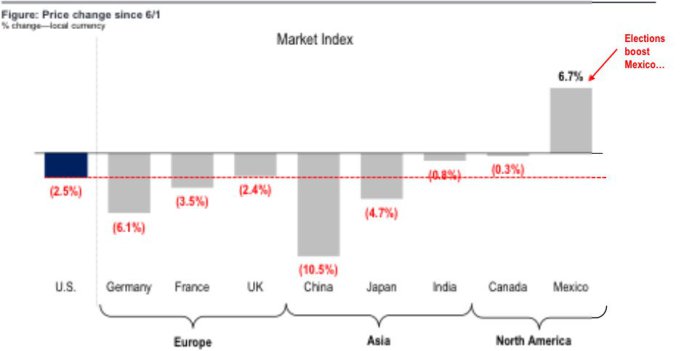
- Thomas Lee@fundstrat – MACRO: while we do not favor trade wars, it is curious that US stocks meaningfully outperformed Europe/China since trade tensions escalated (6/14)… suggesting potentially
@realDonaldTrump is on the right track. And as such, US stocks may be overdue for contrarian rally
What is another way of describing the above chart – a “very serious synchronized global growth downturn” that has not yet touched America and makes it harder to see a recessionary shock in the US. That is what Lakshman Achuthan of ECRI said on BTV:
With mega-serious terms like “very serious synchronized global growth downturn”, shouldn’t you expect the below?
- ((The Daily Shot)))@SoberLook – Chart:
@CreditSuisseGlobal Risk Appetite Index –
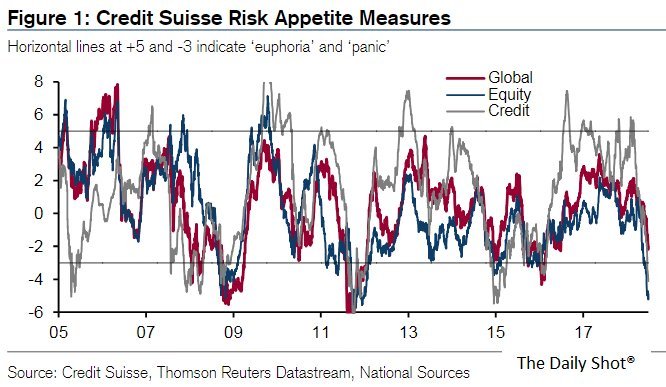 With all of that, are you surprised to see the result?
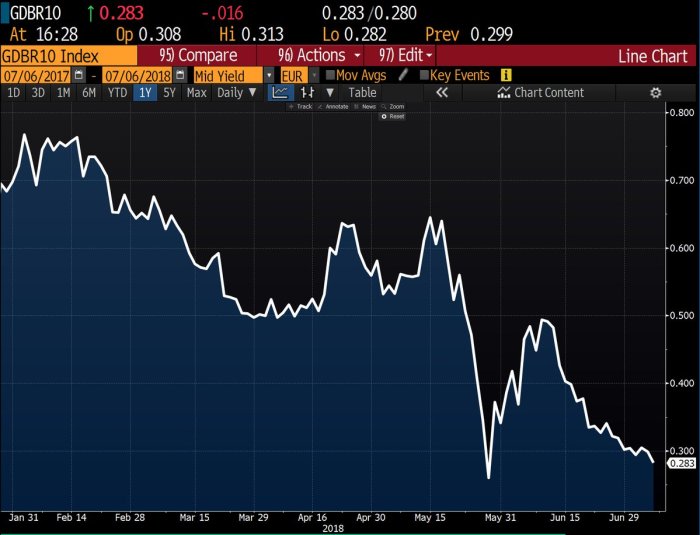
- jeroen bloklandVerified account@jsblokland –
#Germany‘s 10-year bond#yield has fallen from almost 0.80% to less than 0.30% since February.
2. Treasuries
Rick Santelli spoke on Thursday about the large Pension Fund demand for long maturity Treasuries and how that might be the bigger reason for continued flattening of the Treasury yield curve. Santelli has also spoken about how the 7-10 year curve might invert before others. Well, the 7-10 year spread closed the week at 4 bps and the 10-20 year spread at 5 bps. Is it time for the Fed to be done a bit as Jim Paulsen said on Friday morning?
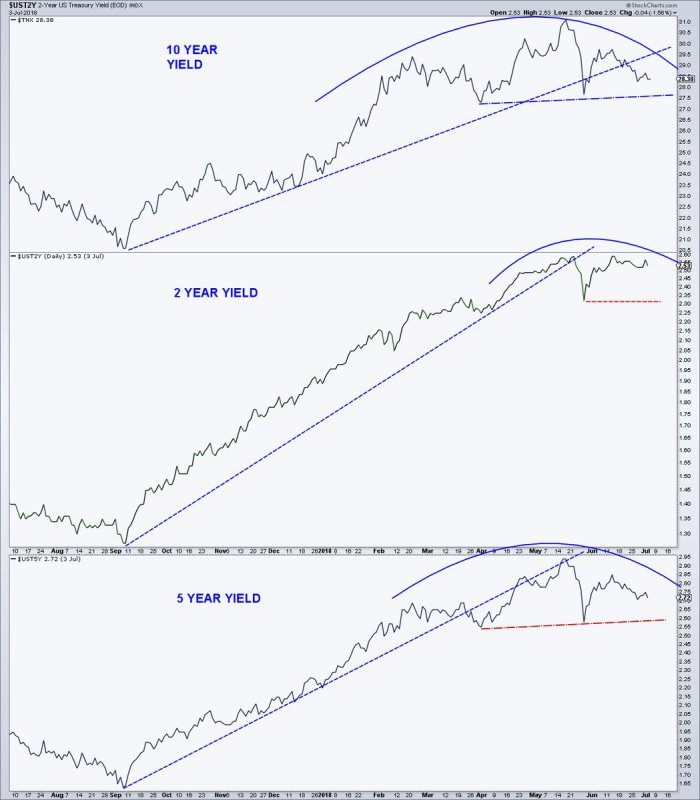
The shorter end of the Treasury market is signaling something like that:
- Mark Arbeter, CMT@MarkArbeterTreasury notes/yields just pausing or rolling over?
$TNX Market rates (treasuries) move before government rates (fed funds).
This was a good week for Treasury bulls as yields kept falling, especially at the long end with 30-year yield down 6.3 bps & 10-yr yield down 3.7 bps. In contrast, the 2-year yield rose by 1.3 bps on the week. TLT rallied by 85 bps and EDV, the Zero Coupon ETF, rallied by 1.5%.
Bullish action led to bullish recommendations:
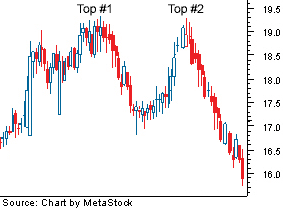
- Mike Seery@seeryfutures– What Is A Double Top Chart Pattern ? Look At 10 Year Notehttp://seeryfutures.com/conten
t/what-double-top-chart-patter n-look-10-year-note#.Wz5Lh39ka WE.twitter… #commodities#futures trading
If correct, shouldn’t it mean breaking below some recognizable level?
- Blake MorrowVerified account @PipCzar – 10yr setting up a bullish wedge which could mean the 10yr yield breaks 2.80 soon
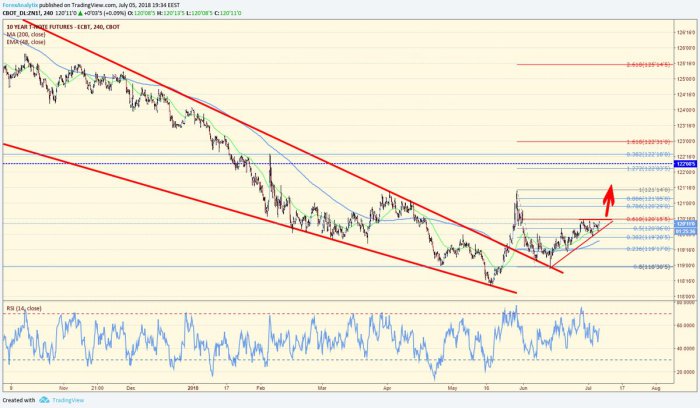 If it does, where could it go?
- Tim SeymourVerified account @timseymour – head and shoulders UST 10yr chart to 2.60% IMO
But is there any one who sees resistance looming above?
- Greg Harmon, CMTVerified account @harmongreg – Dragonfly Capital – 3 Strikes and You’re Out for Bonds? http://dragonflycap.com/3-stri
kes-and-youre-out-for-bonds/ … $TLT
“Treasury Bonds ($TLT) have also been surging over the last two weeks. Friday morning sees the Bond ETF back at resistance. In fact it is the third time at resistance. Will it be 3 strikes and you’re out for Treasuries?”
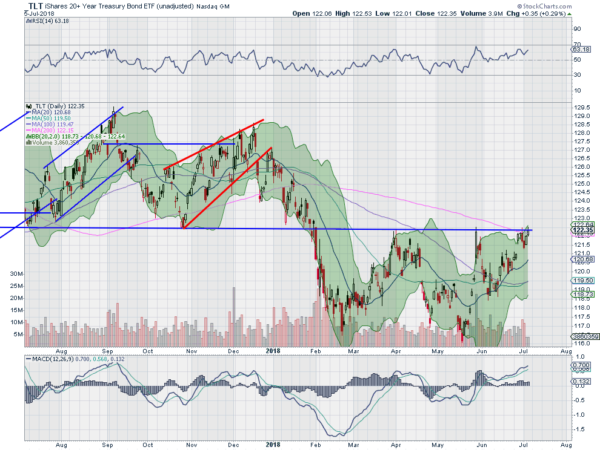
- “Momentum supports more upside. The RSI is rising in the bullish zone. The MACD is rising and positive. Neither indicator are at extreme levels. The price is right at the 200 day SMA though. Below that remains bearish for many, so Friday’s close carries a lot of weight. An overshoot often accompanies moves that drive to important levels. If the ETF can hold over 123 into next week and continue higher then buyers may start to flock in. A failure again and subsequent break below the June low will bring calls for the end of bonds again.“
A Treasury rally can be bullish for risk assets as well. But the following, if it occurs, will not be:
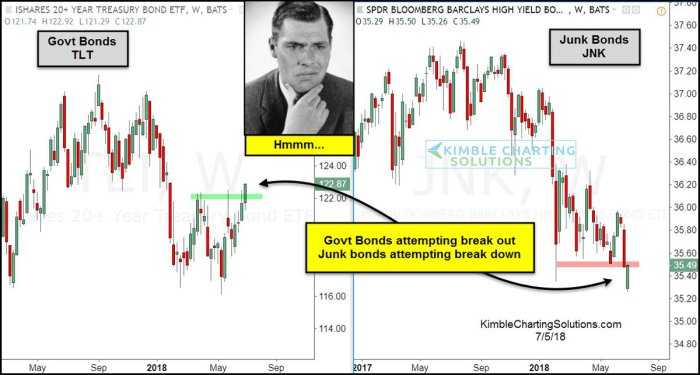
- Chris Kimble @KimbleCharting – Govt bonds attempting a break out, junk bonds attempting break down at the same time.
$JNK$TLT$SPY
3. T-word
- Ray DalioVerified account @RayDalio – Today is the first day of the war with China
Strange isn’t it? As late as Thursday evening, people were fearful of trade tariffs becoming effective at 12:01 am on Friday, July 6. Then came Friday morning and the tension seemed to have lessened substantially, perhaps due to greater worries about the Non-Farm Payroll report. And after that report? It is almost as if the markets said “trade, what’s that?“
This might be laughed at by some & perhaps it should be. But to us, the markets felt on Friday morning as we recall market sentiments on January 17, 1991. Then the stock market had gone through a 20% correction since Saddam invaded Kuwait in August 1990. There was serious nervousness about the start of the bombing campaign on January 17, 1991. But the reverse happened. The bombing began and the stock market took off. Probably because the uncertainty had ended and the markets were convinced of US success.
Probably we are totally wrong but that is sort of how we felt on Friday morning. The tariffs had been imposed, the uncertainty was over and the Non-Farm Payroll report was so sunny that all fears of a trade war backfiring on America were at least temporarily put away.
Interestingly, Ian Bremmer, founder of the Eurasia Group, came on CNBC to argue that tariffs, while they might rise higher than now, will not do damage to US economy or even to global trade, which is kinda what the markets concluded after the payroll number.
Since tariffs on physical goods involve shipping, how countries handle shipments or deliberately mishandle shipments can affect trading costs. Listen to Lori Ann LaRocco of CNBC explain this somewhat in the clip below. The clip is 2 weeks ago but may now be more relevant given the implementation of the first set of tariffs.
This is a topic that interests us. We plan to read Ms. LaRocco’s book “Dynasties of the Sea” and review it, assuming we understand this complicated subject.
4. US Stocks
Encouraging signs were evident earlier in the week to smart gurus which they were kind enough to share on Twitter:
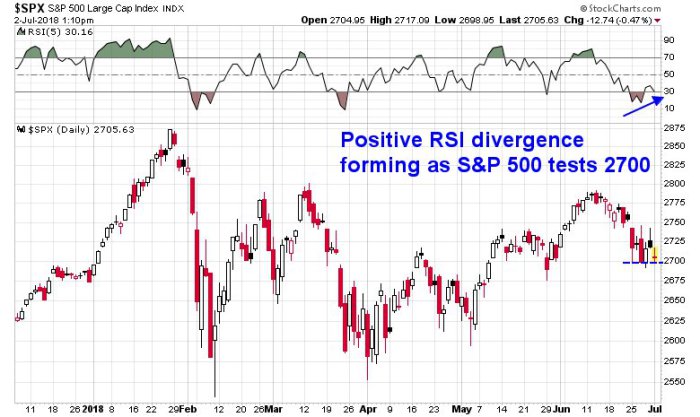
- Cam Hui, CFA@HumbleStudent – Mon Jul 2 – Positive RSI divergence forming as
$SPX tests 2700. Watch the close!
 Then just before the rally on Thursday,
- J.C. Parets@allstarcharts– Thu Jul 5 – S&P500 coiling tight
- Neil Blalock, CMT@NeilBlalock – Thu Jul 5
$SPYStarting to see higher lows in this tight coil. In both price and relative strength.
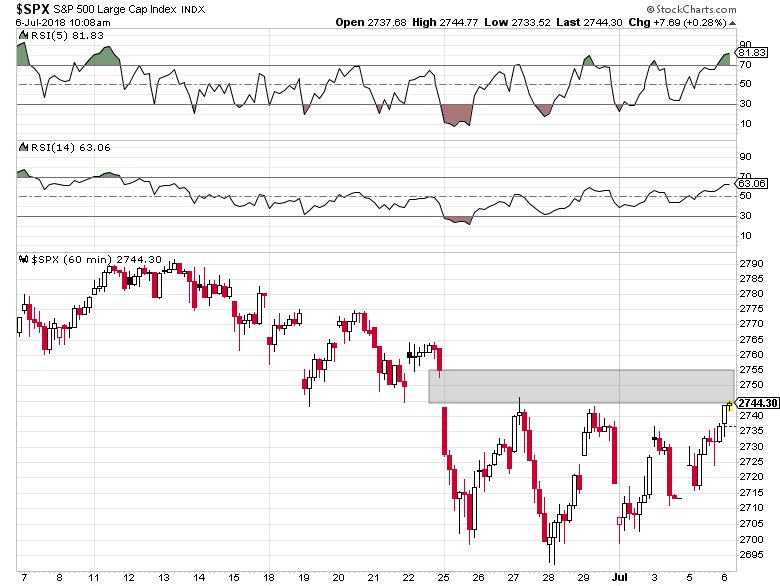
The S&P did explode out of this coil and rallied both on Thursday afternoon & on Friday. Did any of these gurus say what’s next?
- Cam Hui, CFA@HumbleStudent– Gap decisively filled. Next major
$SPX resistance: 2800 Everyone have a good weekend
 That’s the S&P. What about small caps?
- Peter BrandtVerified account@PeterLBrandt –
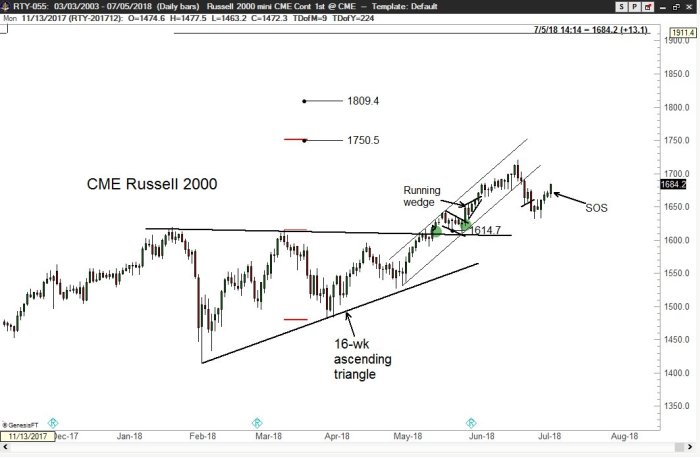
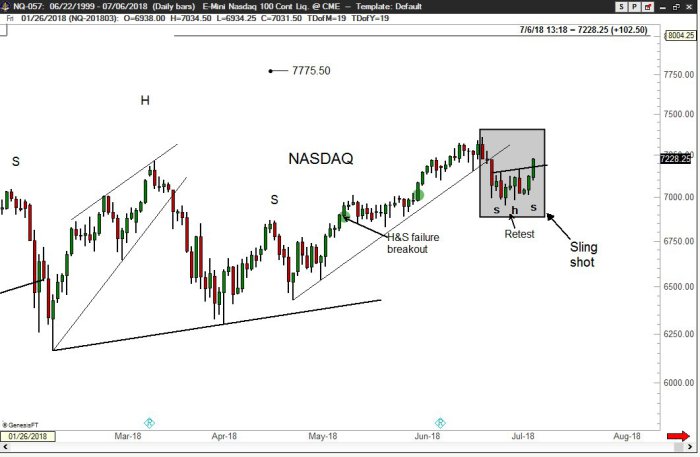
#classical_charting_101Today’s SOS in Russell likely re-confirms major uptrend. See Factor Alert dated July 2. This was signal I was looking for.
- Peter BrandtVerified account@PeterLBrandt– This is called a “sling-shot” to higher prices.
$NQ_F$QQQ
 That’s technology, the largest sector in the S&P. Next is Health Care which was highlighted on Friday by Carter Worth of CNBC Options Action via XLV. That brings us to Financials, the sector that just can’t go up. Is there any one who is optimistic on Banks?
- J.C. Parets @allstarcharts – looks like a squeeze higher in bank stocks is ready to get going. I’m positioning accordingly. Like some of the regionals. Check out
$RF – I like it long if we’re above 17.50
That brings us to the most cursed sector in global stocks – Submerging markets as it is often called. Interestingly, this sector outperformed US stocks on Friday, post NFP. Is goldilocks good for EM? It has been in the past with steady to lower Dollar & Treasury yields stable to falling. But who is putting on a trade on EM?
- Greg Harmon, CMTVerified account @harmongreg – added
$EEM Aug 43.50 calls, looks like this is turning, at least ST
Send your feedback to editor@macroviewpoints.com Or @MacroViewpoints on Twitter
