Summary – A top-down review of interesting calls and comments made last week in Treasuries, monetary policy, economics, stocks, bonds & commodities. TAC is our acronym for Tweets, Articles, & Clips – our basic inputs for this article.
Editor’s Note: In this series of articles, we include important or interesting Tweets, Articles, Video Clips with our comments. This is an article that expresses our personal opinions about comments made on Television, Tweeter, and in Print. It is NOT intended to provide any investment advice of any type whatsoever. No one should base any investing decisions or conclusions based on anything written in or inferred from this article. Macro Viewpoints & its affiliates expressly disclaim all liability in respect to actions taken based on any or all of the information in this article. Investing is a serious matter and all investment decisions should only be taken after a detailed discussion with your investment advisor and should be subject to your objectives, suitability requirements and risk tolerance.
1.”Cain and Moore are right“?
We were so stunned to read this that, for a brief moment, we actually wondered who Moore was and whether the author meant to say Cain and Abel. Not joking folks. That was our instant thought. Because the author of the statement has been scathing towards President Trump’s economic pronouncements since the 2016 election.
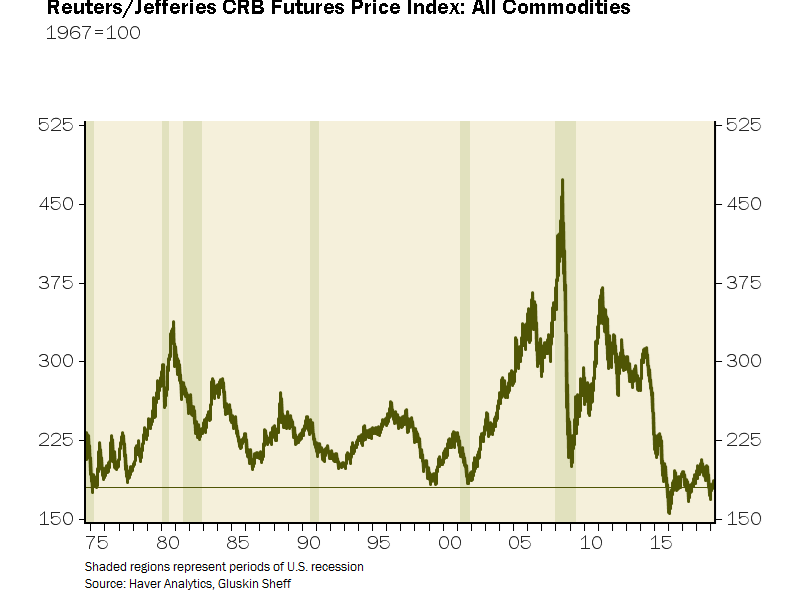
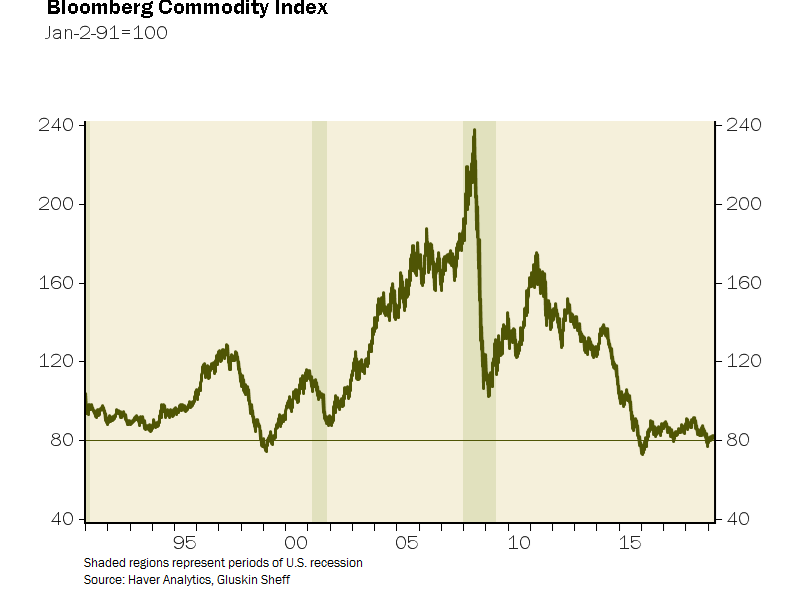
- David Rosenberg @EconguyRosie – Excited about the big reflation trade? Take a good hard look at the charts below. Global deflation, not inflation, is the primary fundamental risk. I can’t believe I’m saying it, but Cain and Moore are right!
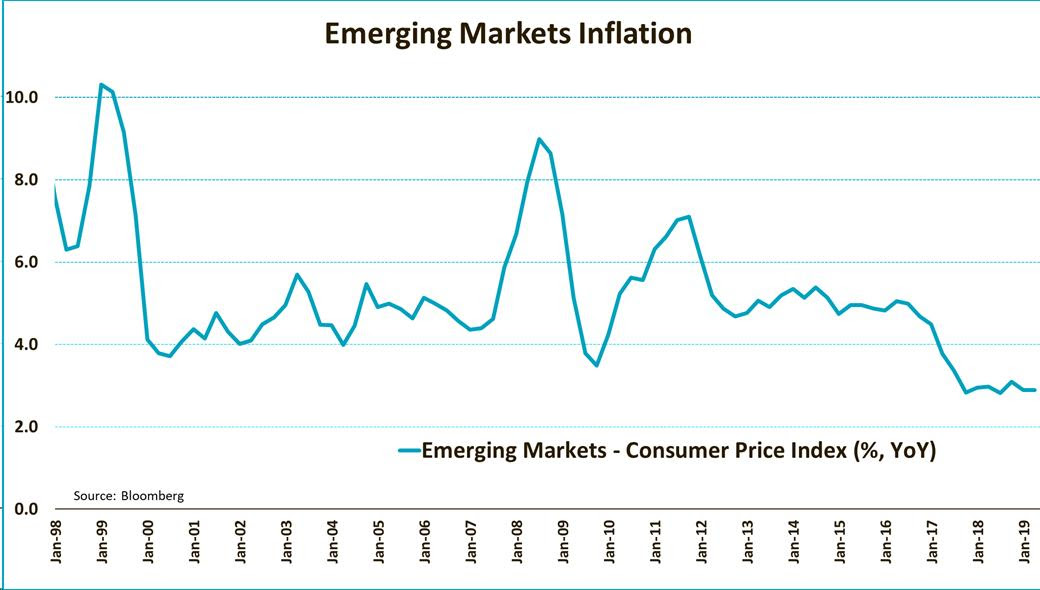
But what about commodity inflation coming here from emerging markets?
- jeroen bloklandVerified account @jsblokland – One source of ‘developed market’ #inflation used to be ’emerging market’ inflation, #China being the best example, but this is no longer the case. Emerging market inflation has fallen below 3%.
But Rosenberg’s tweet was on Thursday, April 4, a day before the Non Farm Payroll number. Surely, a stronger than expected jobs number & a higher wages number would create some inflation concerns. And that number did come in at 196,000 with last month revised from 20K to 33K.
But,
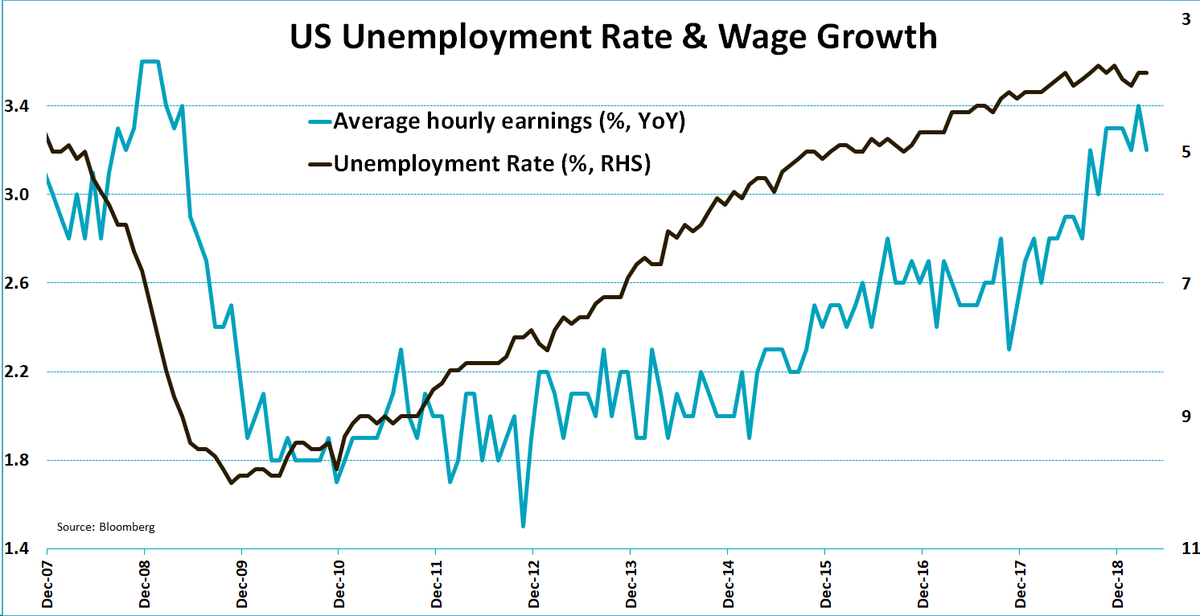
- jeroen bloklandVerified account @jsblokland – US #wage growth unexpectedly fell to 3.2% in March, down from 3.4%. #Inflation risks from labor market remain limited.
Not just inflation decline but also,
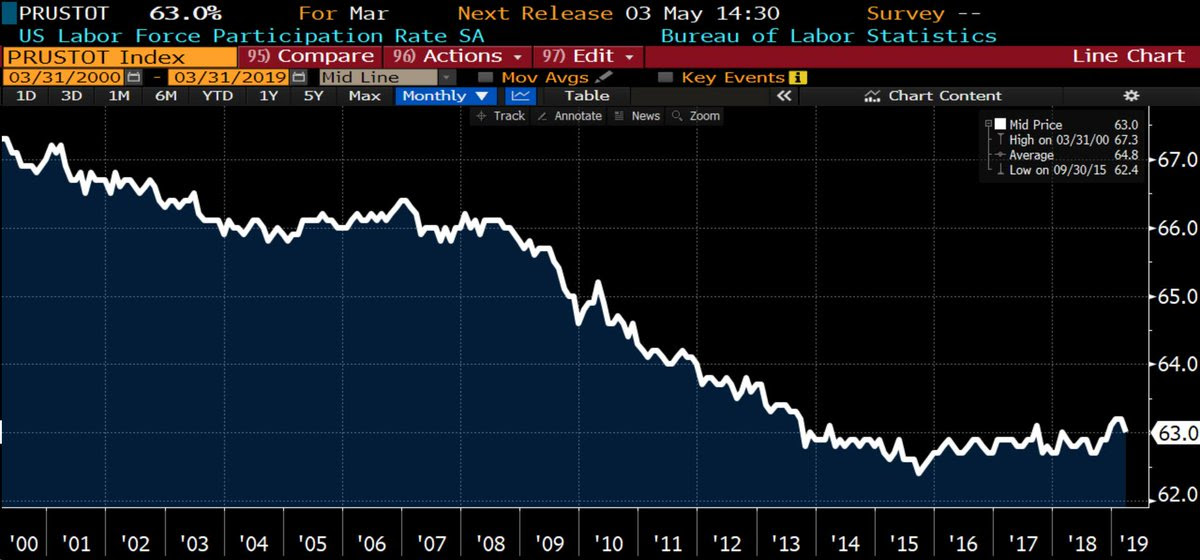
- jeroen bloklandVerified account @jsblokland – US labor force participation unexpectedly fell in March, after a gradual rise the months before. Perhaps the most disappointing aspect of this month’s jobs report…
The statement above is actually rosier than the jobs added reality:
- David Rosenberg @EconguyRosie – The Potemkin labor market! Over half of the payroll gains so far this year have come from the BLS ‘birth-death’ model!! Three-quarters from this ‘magic wand’ in Feb-March. Meanwhile…household employment has shown NO growth at all year-to-date.
But what is the “key” in this payroll data?
- David Rosenberg @EconguyRosie – The key in the payroll data was the 5k drop in cyclical employment. Negligible wage growth. Hours worked was all a construction skew. Declines in manufacturing jobs and overtime are an ominous sign.
Is there an overlooked & leading indicator that suggests the same?
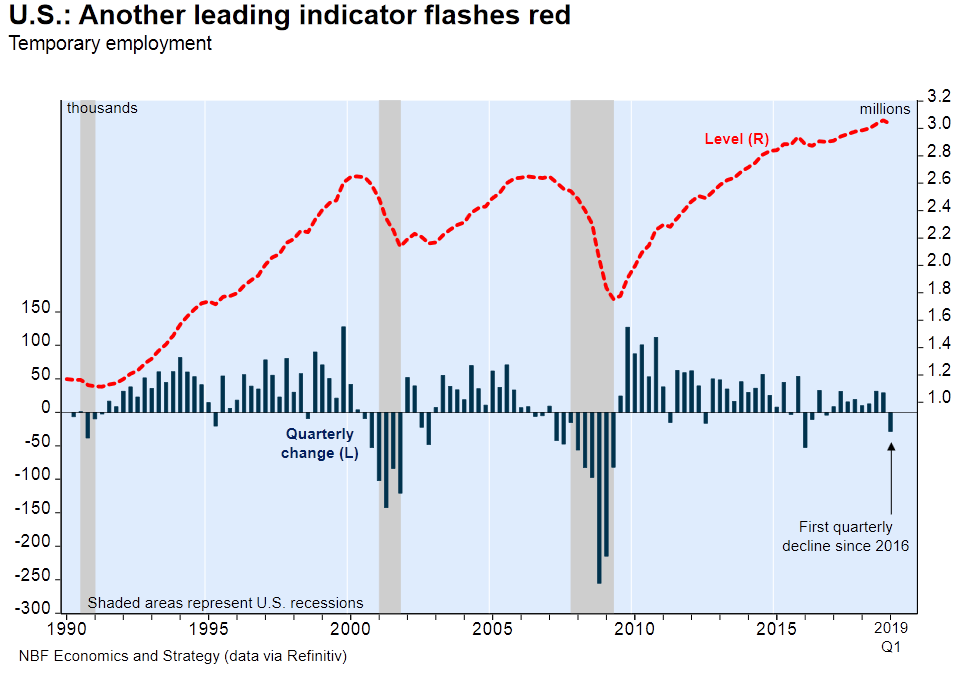
- Babak@TN – While most of the attention today is on the positive headline NFP numbers, a small red light is blinking warning of potential weakness: temporary employment, a LEI, declined in 1Q chart via National Bank
Could there be a more negative way to describe job growth?
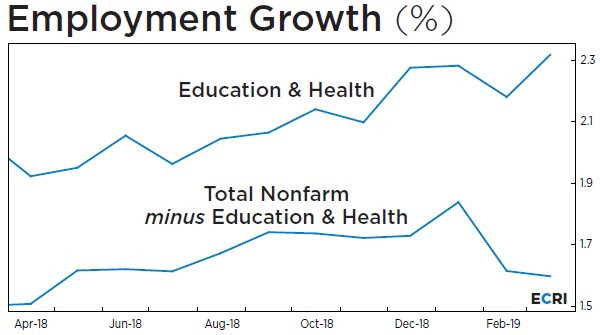
- Lakshman AchuthanVerified account @businesscycle – The more cyclical component of #jobs growth remains under pressure, with yoy nonfarm jobs growth excluding education and health falling to an 11-month low.
What does it mean for the economic cycle?
- David Rosenberg @EconguyRosie – When we see declines in transports (-2k), retail (-12k) and manufacturing (-6k), you know that the cycle is showing signs of fatigue. Bond market has this figured out.
Yes, indeed! A few minutes prior to 8:30 am on Friday, we had jotted down yields along the Treasury curve – 30-yr at 2.943%; 10-yr at 2.54%; 7-yr at 2.436% & 5-yr at 2.346% .
As soon as the NFP number hit, yields rose instantly. But then yields along the 30-5 year curve fell & closed down in a parallel shift down 3.6 bps on the day. The 3-year, 2-year & 1-year yields closed down 2 bps & 1.5 bps & 1 bps resp. from their pre-NFP levels.
In contrast, the U.S. stock market rose in happiness because it considered the NFP numbers as perfect for rallying. The S&P 500 and NDX rose about 50 bps while the Russell 2000 rose by almost 100 bps.
What gives? As Jim Bianco told Rick Santelli, the bond market & the stock market do give different messages at turns. That was not merely true in 2007 but also in 2009 when the bond market was saying things will get better while the stock market was falling off a cliff. This time Bianco is siding with the slowing growth message of the bond market.
2. Treasury Rates
Kudos to Jeff York for call on Wednesday, March 27:
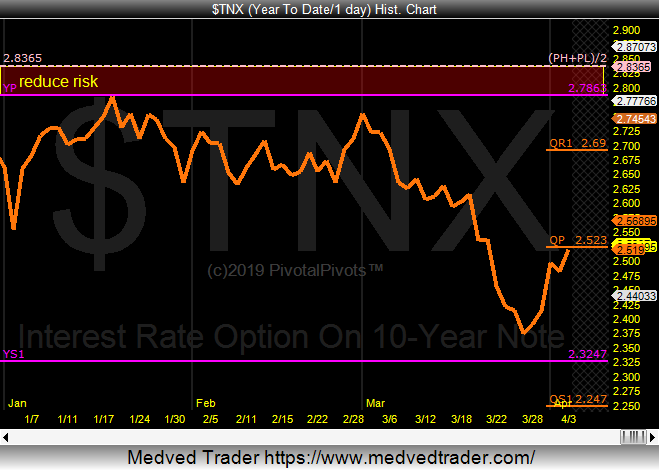
- Jeff York, PPT @Pivotal_Pivots – Wed Mar 27 – 10 yr. bond yields $TNX is near my 1st. 2019 target at the Ys1 pivot @ 2.32%. YP to Yr1 is a computerized algorithmic move @PivotalPivots.
The bottom in the 10-year was at 2.35%. Fast forward to just a few minutes after Friday’s jobs number when the 10-year yield touched close to 2.55%. A rise of 20 bps in just about a week. That’s fast, so fast that it might suggest a reversal. In fact, Jeff York called it on Wednesday, April 3:
- Jeff York, PPT@Pivotal_Pivots – 10 yr. bond yields $TNX today, is testing resistance at the Qrtly Pivot(QP). The QP, should be strong resistance @PivotalPivots.
 But the bond market movements are more about positioning, right?
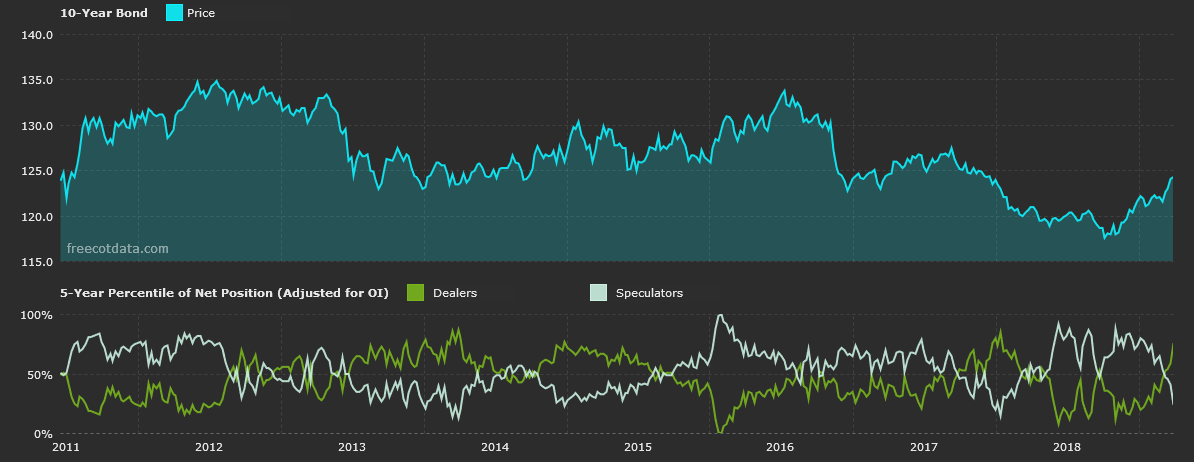
- Movement Capital@movement_cap – specs got more net short 10yr futures during the recent bond rally. yikes https://freecotdata.com/bonds
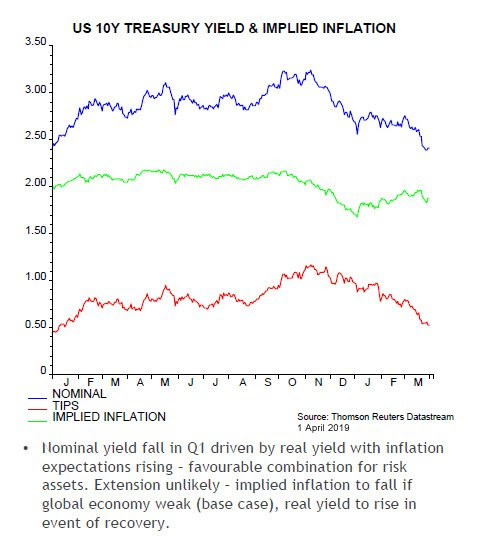
An important question is whether rates are falling because of falling inflation or falling growth?
- Jenna & John@StrategicBond – Bulk of the Q1 move in US 10-year Treasury bonds has been falling real yields, while inflation expectations have actually risen a little; per Simon Ward, our Economic Adviser.
 So is there anything that might suggest a further fall in rates due to slowing economic growth?
- Liz Ann SondersVerified account @LizAnnSonders – Recession model from @NDR_Research based on @OECD_Stat show high likelihood of global recession underway (FWIW, global recessions are generally when global growth slows to <3%…not defined same way as US recessions)…caveat: fortunately, some data has been rebounding
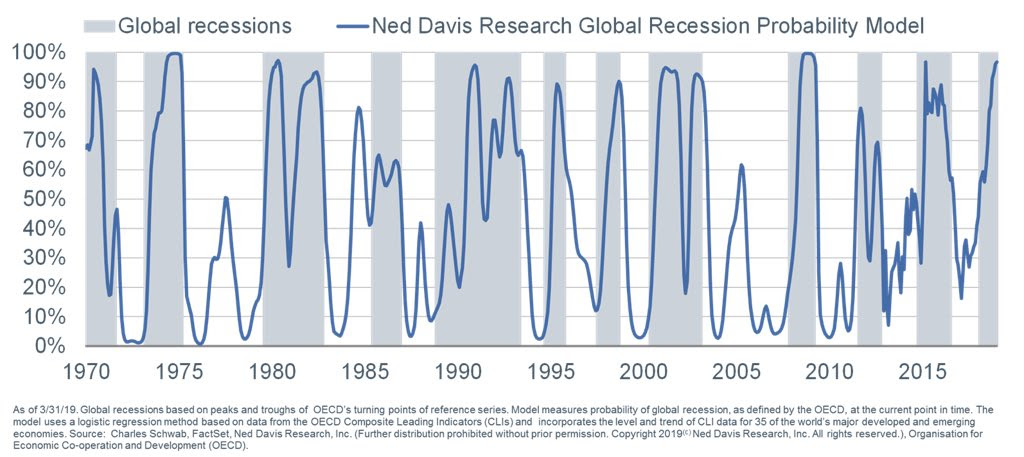 The R-word is not near in the US yet and may not even be realized globally. But isn’t it sensible & pragmatic to take out some insurance or do a stitch in time, as it were? That is why we wrote two weeks ago:
- “Chairman Powell did the right thing this past Wednesday. Now he needs to signal to markets that he will double down if needed and possibly even when if it is not needed. The only way to do so is to CUT interest rates by 25 bps in June and even possibly in April if the data keeps going bad with a subsequent rate cut in June.”
But we are simple folks and have neither the standing nor the gift of persuasive eloquence of Cool Tone Larry ( in an obvious nod to one of our favorite actors):
Our strongest recommendation to Chairman Powell is to listen, watch & imbibe this style. That alone would enable him to not scare markets the way he did in his last two FOMC pressers.
Now if you like getting scared and, frankly, even if you do not, you should watch the 31 minute Real Vision video with Lakshman Achuthan of ECRI, titled Cycling into Slowdown. The first section, in a Complexity Theory kinda way, speaks of a window of vulnerability developing in the economy that given an exogenous shock can send the economy into recession.
The real message of the video (filmed on March 13, 2019) is that we are “getting closer & closer to a window of vulnerability” in the US & global economy. He says that “the prospect of a sustained upturn in PMIs any time soon is pretty low“. His coup de grace is that the “leading indicators in non-financial services where 2/3rds of Americans work have rolled over & are decelerating“.
This is a very different message from Larry Kudlow’s but the solution is one that President Trump & Dr. Kudlow are suggesting, right? Wouldn’t that make Cain & Moore right as well?
3. VIX
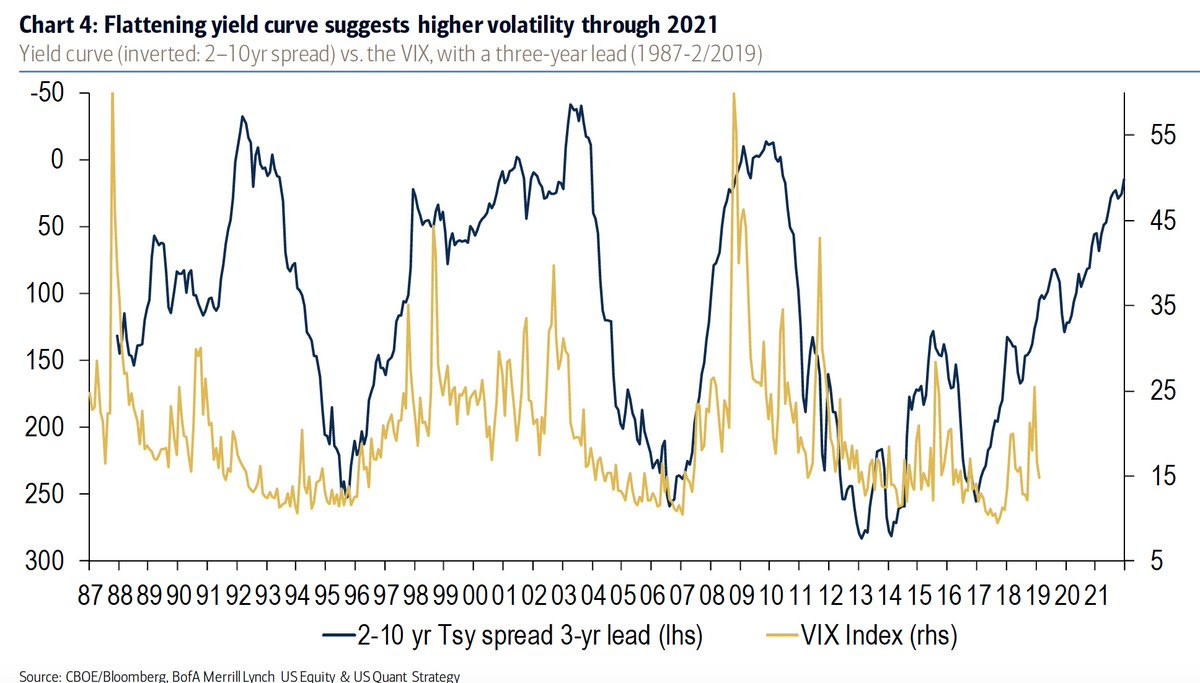
First a message of the Yield Curve to VIX (kinda a repeat of what Raoul Pal & Mehul Daya tweeted last week):
- Holger Zschaepitz @Schuldensuehner – This chart highlights the madness of markets. Volatility has dropped despite flattening of the yield curve. Flattening yield curve suggests higher volatility through 2021, acc to BofAML.
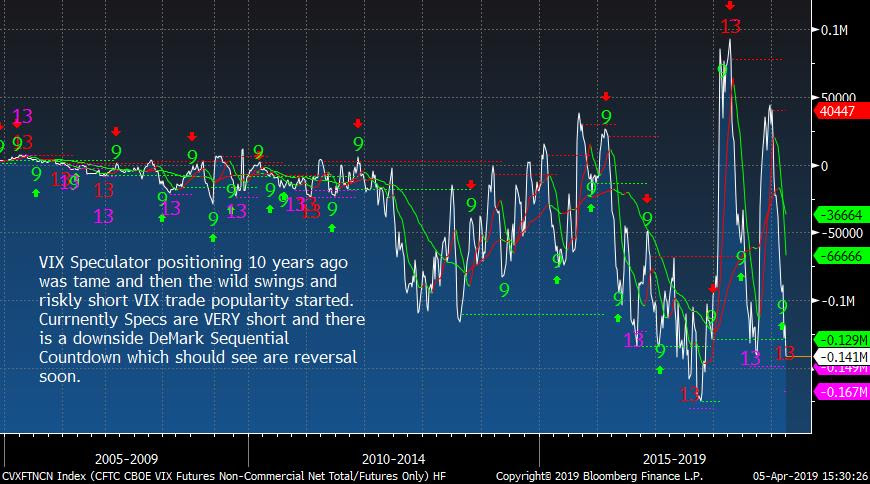
But $VIX closed below 13 this week. So the trend is towards a lower & lower VIX. But is that trend near exhaustion?
- Thomas Thornton @TommyThornton – $VIX Speculator positioning shows them set up very short. With a DeMark Sequential Countdown 13 present a reversal soon could really squeeze the hell out of these shorts
4. Stocks
If $VIX has a DeMark 13 count, shouldn’t stocks have a DeMark 13 count in the reverse direction? Actually, more ominously,
- Thomas Thornton @TommyThornton – And DeMark Countdown 13’s on most of the major indexes around the world. This is different setup from September 18 top as Europe and Asia peaked in January 18 and never recovered. This is more like January 18. Extreme bullish sentiment and Countdowns = TOP
Combine the two above and?
- Thomas Thornton @TommyThornton – Add to the mix very low short interest on the major ETF’s in the US and very high short exposure on $VIX. Keep buying or bye bye? My view is it is essential to take down risk if long.
What about bullish sentiment? See below without their accompanying charts (which can be seen on Twitter):
- Thomas Thornton @TommyThornton – $SPX and $NDX bullish sentiment is extreme at 87% bulls. (it was 4% bulls at the low in December when we covered nearly everything and went 90% net long)
And about Europe?
- Thomas Thornton @TommyThornton – Euro Stoxx 50, CAC 40, FTSE 100 DAX bullish sentiment shows each one over 90% bulls. This is very extreme
Forget about exhaustion & reversals for a minute. The S&P has great momentum. The S&P was up 2% & the NDX & Nasdaq were up 2.7%. The Russell 2000 was up 2.8%. The Transports were up 3.1%. So a natural question is about risk-reward from these levels:
- SentimenTraderVerified account @sentimentrader – $SPY has gapped up for its 7th straight session, and it’s on the heels of a 100-day high. That hasn’t happened since January 2018. Over the past 20 years, here’s the risk/reward over the next 3 months.
The guru opinions we featured last week were all bullish. That led us to wonder how ironic it would be if this week saw a downdraft. This week was a resounding confirmation of the bullish opinions. In contrast, this week’s guru opinions are all bearish. So we have to wonder, even hope, for an ironically bullish week next week.
5. Dollar, EM & Gold
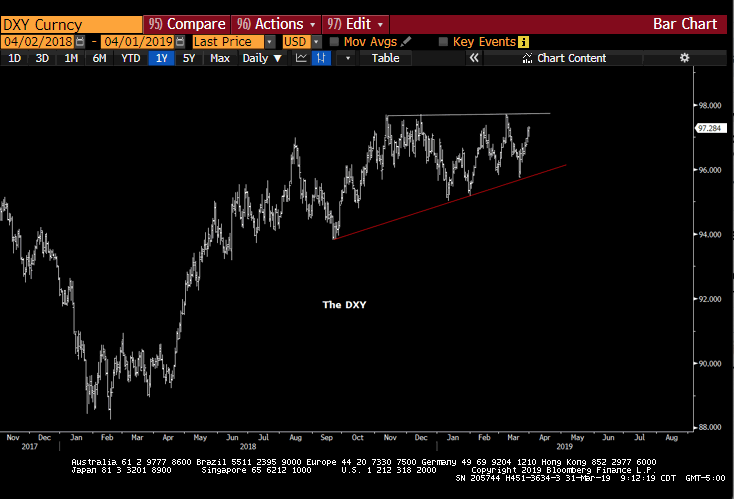
- Raoul PalVerified account@RaoulGMI – Bonds and Dollars. I think this will be likely the theme for 2019. I starting to re-add dollars to my core trades. Just finishing off my April Global Macro Investor (GMI) publication on it now.
A strong Dollar should be negative for emerging markets. But,
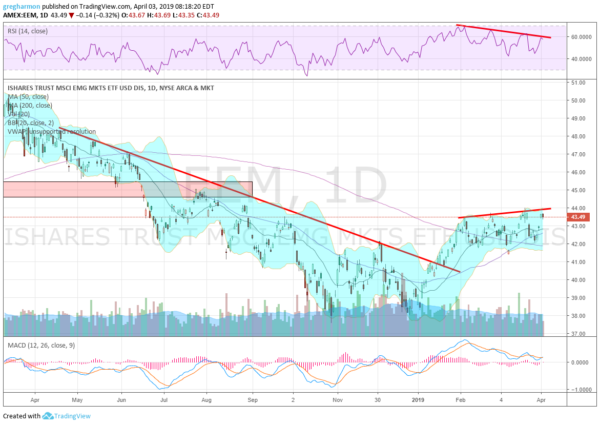
- Greg HarmonVerified account@harmongreg – Wed Apr 3– Dragonfly Capital – Emerging Markets About to Party http://dragonflycap.com/
emerging-markets-about-to- party/…$EEM - There are some strong positives in place for Emerging Markets. First they broke the long downtrend resistance in January and kept going. Next they confirmed a double bottom by rising over the December bounce high. They have been consolidating in a bull flag over the past 2 months, which suggests a Measured move to about 48 on a break to the upside.
- During the consolidation the momentum indicators have also reset from overbought conditions. The MACD is back near the zero line and has plenty of room to move back higher now. The RSI is bouncing off of the lower end of the bullish zone. But the one concern is that the bounces have been making lower highs since the start of February. This divergence is not a show of strength. Emerging Markets may break out higher but taking a cautious stance until they do seems prudent for now.
What about Gold?
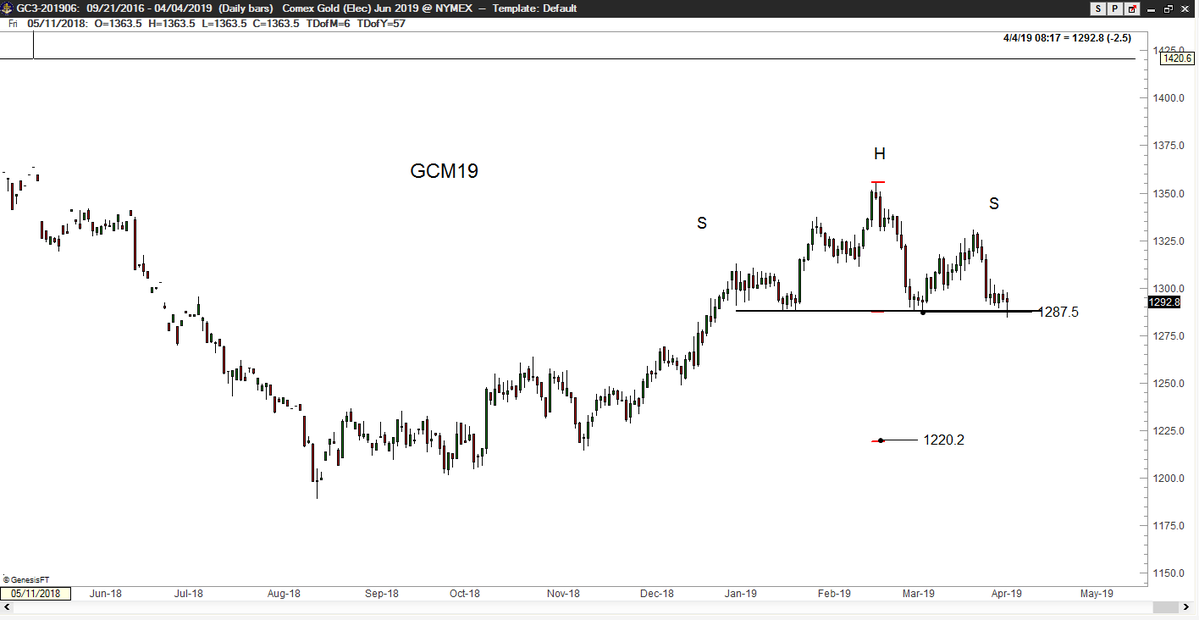
- Peter BrandtVerified account @PeterLBrandt – Gold is a low-risk buy with a very measured risk. A close below 1282 would launch a sharp down move. $GC_F
 And what can we say about Oil except to say we have no clue what is going on. Oil was up 5% this week, perhaps due to Libyan civil war. Frankly, with economies slowing down all over the world, Dollar rallying somewhat & rates falling, why is Oil on such a ramp? Last time we saw that was in 2008. And we don’t want to think about that, at least not right now.
Send your feedback to editor@macroviewpoints.com Or @MacroViewpoints on Twitter
