Summary – A top-down review of interesting calls and comments made last week in Treasuries, monetary policy, economics, stocks, bonds & commodities. TAC is our acronym for Tweets, Articles, & Clips – our basic inputs for this article.
Editor’s Note: In this series of articles, we include important or interesting Tweets, Articles, Video Clips with our comments. This is an article that expresses our personal opinions about comments made on Television, Tweeter, and in Print. It is NOT intended to provide any investment advice of any type whatsoever. No one should base any investing decisions or conclusions based on anything written in or inferred from this article. Macro Viewpoints & its affiliates expressly disclaim all liability in respect to actions taken based on any or all of the information in this article. Investing is a serious matter and all investment decisions should only be taken after a detailed discussion with your investment advisor and should be subject to your objectives, suitability requirements and risk tolerance.
1.Jaws II?
Look at the picture of jaws below from the November election to now?
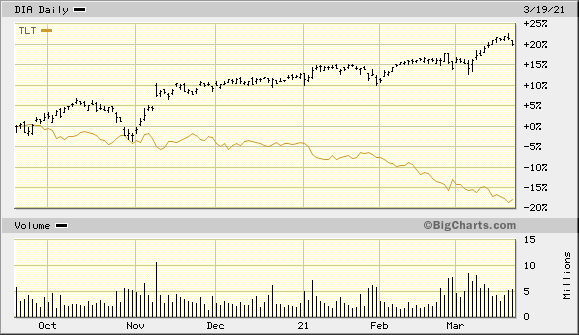
Now think back what Jaws I or the all-time Jaws chart we described last week:
- “Remember the last time 30-year Treasury bonds kept going up in yield & down in price while cyclical stocks kept going up? That divergence became so great that even the Wall Street Journal displayed the two charts on page A1. That was Q3 1987.”
Guess who voiced this analogy on this Fed day? Scott Minerd of Guggenheim said on BTV that “reminds me of 1987“.
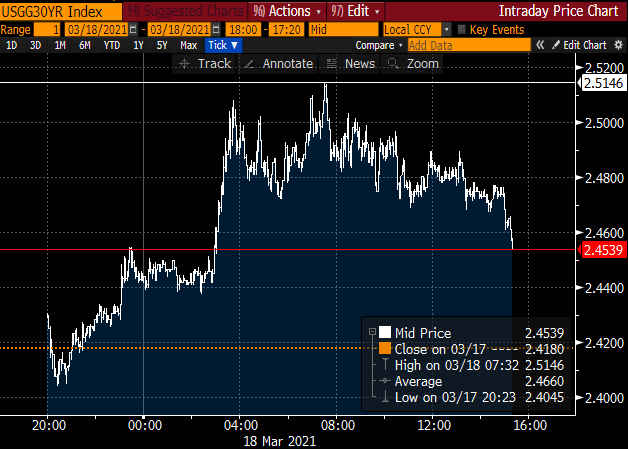
Leaving that for the next phase of Jaws II, we wonder how much more damage can Jay Powell do from here on out? The bond market seems to have wondered that as well on Thursday afternoon:
- Brian Chappatta@BChappatta – late afternoon bid for the long bond
And the bid continued on Friday with the 30-year bond closing down a couple of bps on Friday. Ordinarily, we would feel ok about the bond market next week. By “ordinarily”, we mean a week when Powell does not speak. Alas, he speaks twice next week and not just to investors or media but to his bosses who now dominate him & his “independent” Fed.
Despite the mayhem on Thursday morning, the Fed announced that the SLR will not be renewed. So with a deluge of Treasury borrowings ahead, the Fed decided to obey the dictats of nutso elected reps and reduce liquidity!
- Jim Bianco@biancoresearch – *FED: RELIEF FROM SUPPLEMENTARY LEVERAGE RATIO EXPIRES MARCH 31 They did make the announcement today and, in my opinion, the political pressure exerted by Waters, Warren and Brown warning them to not extend this relief made the Fed blink. And you thought they were independent.
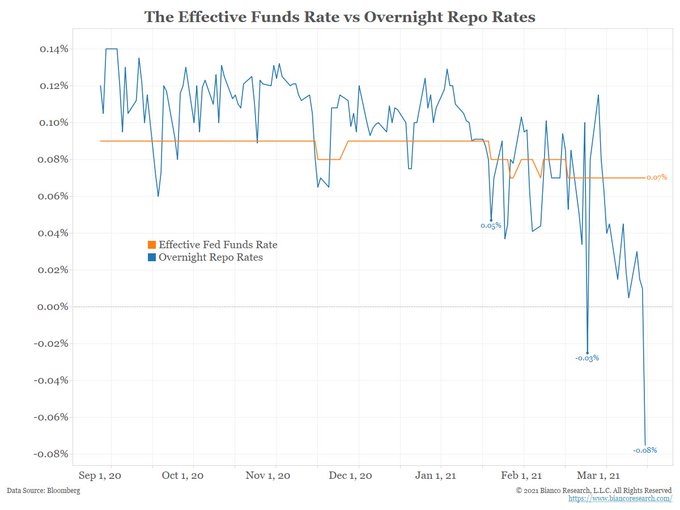
Perhaps they think any liquidity problems this might create for future auctions will be seen later at which time the Fed can re-establish the SLR. But is the “plumbing” already signaling something?
- Jim Bianco@biancoresearch – More charts that suggest we might be having a plumbing “issue.” (An “issue” is what you have before it turns into a “problem”). And note that a plumbing issue is not a financial crisis.
2. Has he scared them enough?
On Fed afternoon, the stock market loved what Powell told them and the top line of the Jaws II rose up. It felt great and also because Treasury rates actually fell after the FOMC statement. The 10-year yield fell from 1.666% at about 1:45 pm on Wednesday to close at 1.646%, or down 2 bps. The 7-year fell by 3 bps from 1.31% at 1:45 pm pre-Fed to close at 1.28%; the 5-year fell by 4 bps from 84 bps to 80 bps.
So Powell did not scare them this time. But we saw yields explode up 7-8 bps when we woke up very early morning on Thursday. Guess what, no one on CNBC said “rates are going up for the right reason” on Thursday morning because stocks cratered as they usually do when rates explode up. But bonds caught a bid on Thursday afternoon as they do when the stock market comes unglued.
So who scared them if Powell didn’t? Kathy Jones said that rumors about Japan widening the JGB band “triggered 8-9 bps rise in a very short time“. Then the Fed announced the end of the SLR extension.
The question is what else can Powell say to scare them further. He has been ultra dovish about the short end of the Treasury curve & he has absolutely refused to even allude to any type of yield control at the long end of the Treasury curve. Also look what he did this week:
- Holger Zschaepitz@Schuldensuehner – #Fedramped up its balance sheet by $113bn to fresh ATH at $7,693.5bn. Fed’s holdings of US Treasury securities rose by $22.63bn to $4.912tn, while holdings of US mortgage-backed securities rose by $87.99bn to $2.221tn. Fed’s total assets now equal to 36% of US GDP vs ECB’s 71.5%
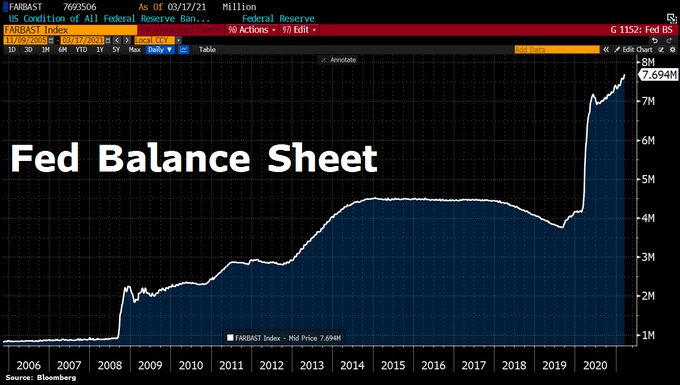
He really couldn’t cause lot more damage at this juncture, could he?
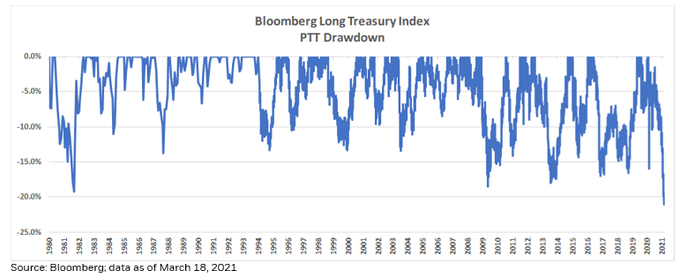
- Rick Rieder@RickRieder – We’re in the midst of witnessing #BondMarketHistory, as the peak to trough drawdown for the Barclays Long Treasury Index now exceeds -20% (not including today’s move), its worst #drawdown going back 40 years and meeting what many consider to be a bear #market!
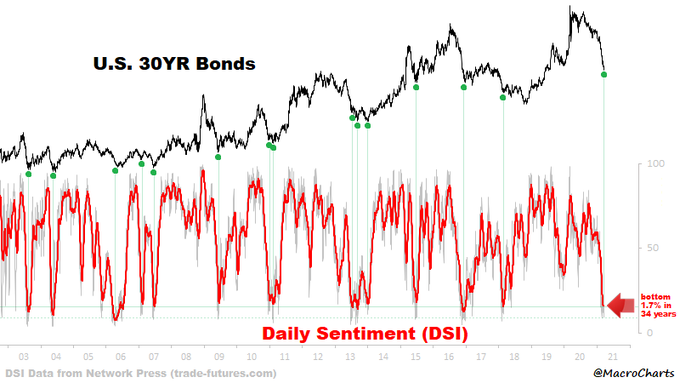
If this is the worst drawdown, what do you think sentiment is saying? Perhaps saying “is that all you got“?
- Macro Charts@MacroCharts – Bond Sentiment is extremely oversold – where Major bottoms formed. The 21dma is at bottom 1.7% in history – watch for a turn UP at any moment. A turn in Bonds would be very Bullish for Growth Stocks and Precious Metals/Miners – which have been quietly *basing* for weeks.
Is there any event-based catalyst ahead for the bond market? Yes but not for next week. The month-end & quarter-end is the week after next. Major institutions typically rebalance their bond-equity portfolios by buying some of what has been sold off & selling some of what has worked too well. That is the reason JPM’s macro guru Marko Kolanovic said on Thursday that “the bonds will find a bid now“.
That’s ok but is there any fundamental or economic reason for Bonds to do better? One reason was discovered in the Fed’s own outlook by you know who:
- David Rosenberg@EconguyRosie – Mar 17 – Implicit in the Fed’s softer than expected 2021 GDP outlook of 6.5% is a complete growth relapse in Q4. Anyone notice its 2022 and 2023 forecasts barely budged? No fiscal multiplier. That’s the hidden story here.
Hmmm! But we do really like pictures!
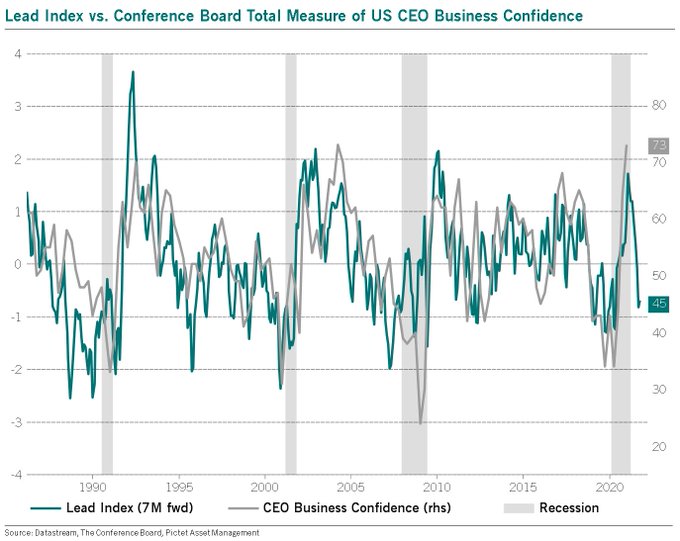
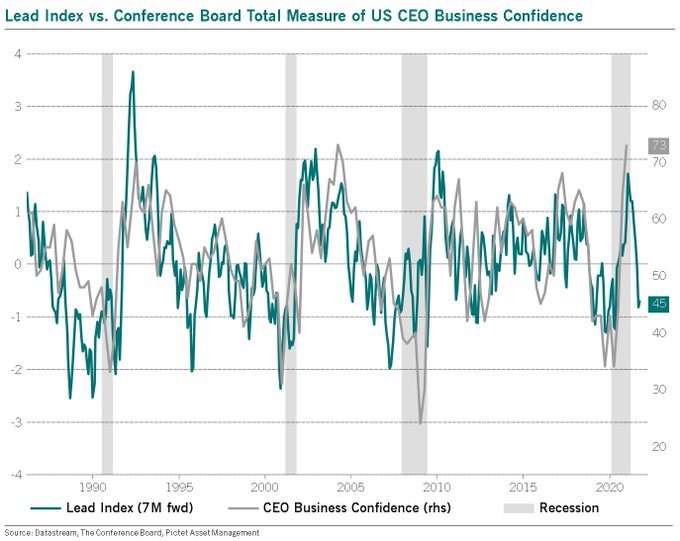
- Julien Bittel, CFA@BittelJulien – Elevator up, elevator down? CEO Business Confidence in the US just rose to a 17-year high. Only 4% of the time since 1976 have CEOs been so optimistic. Meanwhile, lead indicators have moved sharply lower. Suggests a very different look to H2. Let’s see. Will revisit soon.
All this assumes that the Powell, Kuroda, Lagarde gang has run out of things to scare the bond markets. How safe is that assumption? We will all have to wait & see.
3. Stocks
The chart below does suggest that Jaws II is likely to get less wide:
- Julien Bittel, CFA@BittelJulien – Mar 16 – S&P 500 vs. US 30-year bond. Only 6X in the last 30+ years have US equities been >20% above their 200DMA vs. US 30-year bonds. The ratio currently stands at 33% above the 200DMA, highest since February 2011.
That doesn’t mean the S&P will go down a lot. And small declines should be fine as long as the $SPX doesn’t close below 3870 according to Lawrence McMillan of Option Strategist. And he adds,
- “Volatility generally remains in the bullish camp. The $VIX “spike peak” buy signal is still in effect and will be as long as $VIX does not re-enter “spiking” mode. Moreover, the trend of $VIX is down, as both $VIX and its 20-day moving average are below the declining 200-day moving average.”
And look what a Demarkian did on Friday?
- Thomas Thornton@TommyThornton – Covered trading shorts $QQQ and $SPY Will reengage next week
But narrowing of Jaws II might mean a change in the leadership in the US Stock market. For example, Mike Wilson of Morgan Stanley downgraded the Small Caps Sector arguing that the whole cycle is going to be the fastest just as the 2020 recession was the fastest. He said we have moved from early cycle to mid-cycle dynamic already. And the Russell 2000 fell 2.8% this week while the Big cap indices were down less than 1%.
Tony Dwyer came on CNBC Fast Money to downgrade Financials, one of the best performers since last May.
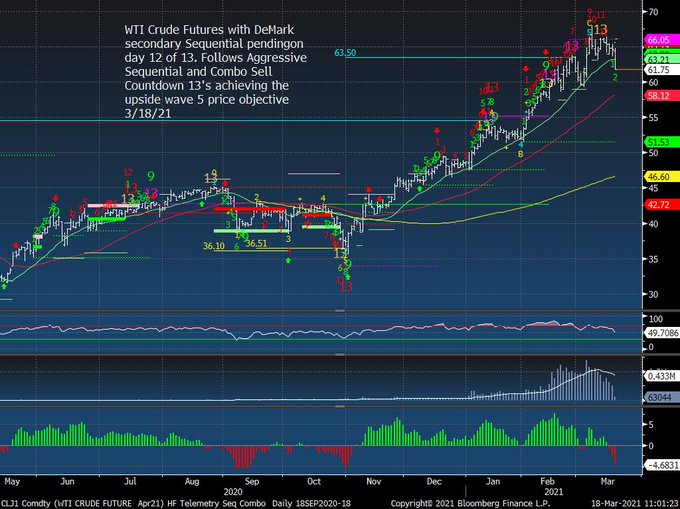
Marko Kolanovic did warn a bit about a dip in the S&P during the month-end, quarter-end rebalance but said his medium term target for the S&P was 4400. He also said buy energy to benefit from the rebalancing of equity portfolios:
That fits in with what a DeMarkian said on Thursday:
- Thomas Thornton@TommyThornton – Mar 18 – Back in Oct I turned very positive on energy sector with the DeMark buy Countdown 13’s on this chart. Took some profits in Jan and bought back again and recently sold all my energy longs. I would like to buy the dips in the coming weeks.
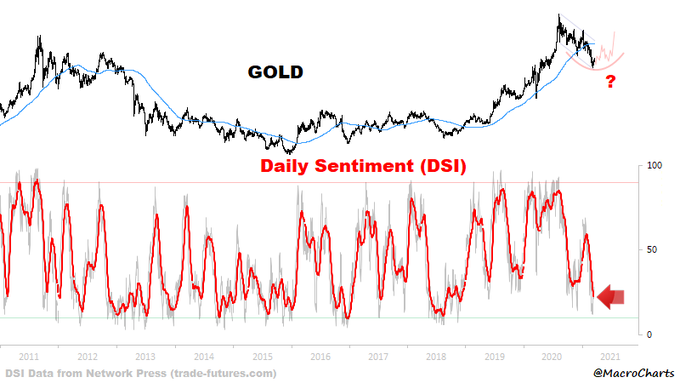
What about Gold?
- Macro Charts@MacroCharts – Mar 18 – Gold Sentiment has collapsed to the lowest since the 2018 Bottom. Price has formed a huge 7-Month *potential* ABC Bull Flag into critical support. Positioning has been wiped out (charts later this week). Look for DSI to turn up soon – maybe the initial stages of a big rally.
But can that happen without some weakness in the Dollar? And how might that be linked to US Treasury – German Bund rates?
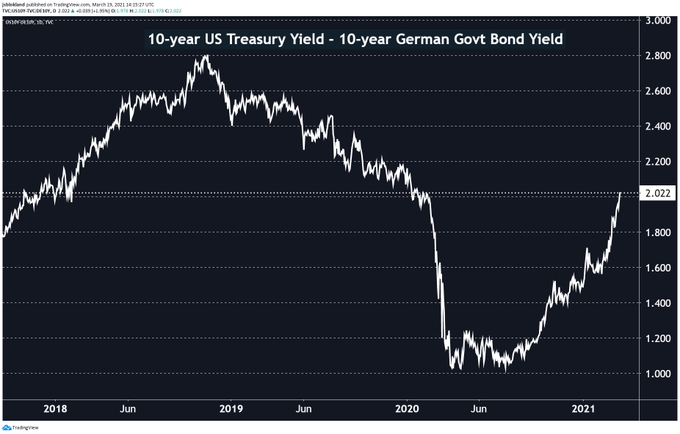
- jeroen blokland@jsblokland – The 10-year #yield spread between the US and Germany has widened by a full percentage point to over 200 basis points. Hard to see #EURUSD going higher from here.
Now reverse the argument and ask how the Dollar might go down vs. the Euro? By narrowing the spread 10-year US Treasury rate vs. the 10-Year Bund rate? Meaning the 10-year Treasury rate has to come down?
Given all of this, shouldn’t we all pray that Chairman Powell maintains total public silence about Fed’s monetary policy next week? Professor Liesman, could you lead this prayer?
Send your feedback to editor@macroviewpoints.com Or @MacroViewpoints on Twitter
