Summary – A top-down review of interesting calls and comments made last week in Treasuries, monetary policy, economics, stocks, bonds & commodities. TAC is our acronym for Tweets, Articles, & Clips – our basic inputs for this article.
Editor’s Note: In this series of articles, we include important or interesting Tweets, Articles, Video Clips with our comments. This is an article that expresses our personal opinions about comments made on Television, Tweeter, and in Print. It is NOT intended to provide any investment advice of any type whatsoever. No one should base any investing decisions or conclusions based on anything written in or inferred from this article. Macro Viewpoints & its affiliates expressly disclaim all liability in respect to actions taken based on any or all of the information in this article. Investing is a serious matter and all investment decisions should only be taken after a detailed discussion with your investment advisor and should be subject to your objectives, suitability requirements and risk tolerance.
1. “Goldilocks” number?
Bloomberg’s Brian Chappatta tweeted on Friday “what a wonderful day for the $QQQ + $TLT portfolio“. Treasury rates fell hard on Friday – 30-yr yield down 6 bps; 20-yr down 6.5 bps; 10-yr down 7 bps to 1.557%, decisively below the magic 1.6% number. TLT, Treasury ETF, was up 1.37% on Friday and EDV, the Treasury Zero-Coupon ETF, Dow was up 1.67%. The only US stock index that matched this was QQQ, the Nasdaq 100 ETF. It was up 1.78% on Friday, eclipsing Dow (up 55 bps) and S&P 500 (up 88 bps).
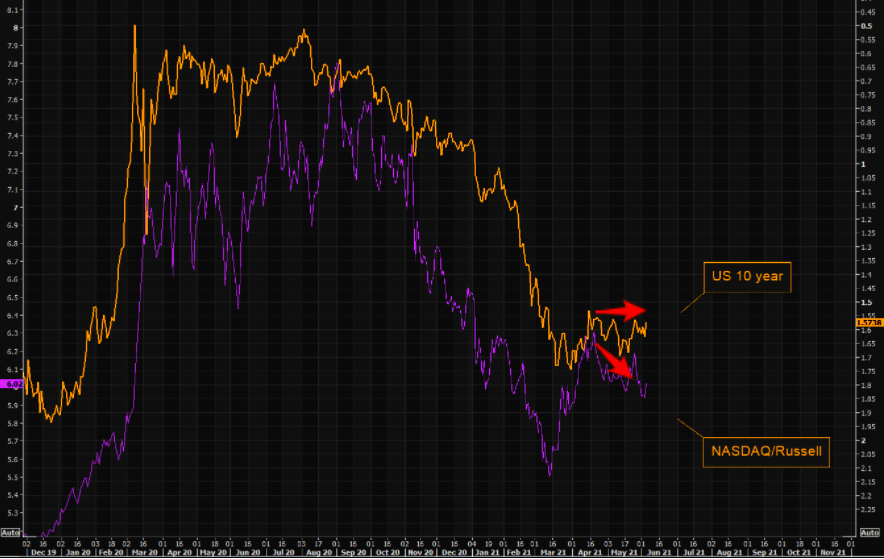
A good succinct description & the accompanying chart came from The Market Ear:
- “We are seeing NASDAQ put in the biggest up candle in a while. It is still inside the range, but we have not closed up here in forever. 13800 is the big level in NASDAQ futs to watch. Our upside as the main pain trade logic stays intact. Note the NASDAQ/Russell ratio vs US 10 year yields. There is room for that gap to come in should yields continue to fade. …. Tech is all about rates…”
But what about Thursday’s sell-off in QQQ? Look what Sentimentrader.com said in their Stat Box on Friday morning:
- “More than $1 billion flowed out of the Nasdaq 100 trust, QQQ, on Thursday. According to our Backtest Engine, over the past 3 years, buying QQQ and holding for 1 month following a $1 billion outflow would have returned 188% versus 98% for buy-and-hold.”
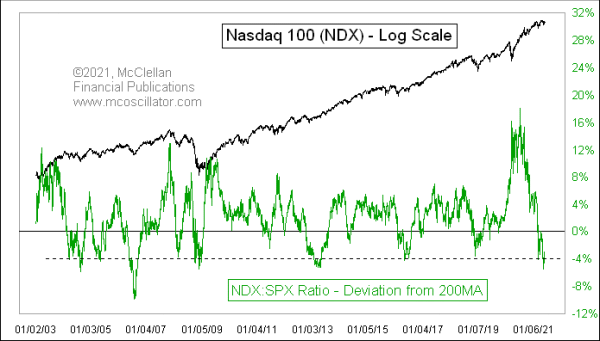
Tom McClellan was also positive towards NDX or QQQ on Thursday, the day before the NFP number, in his article – NDX:SPX Relative Strength Ratio.
- “The recent underperformance by the NDX has taken that relative strength ratio well below its 200MA, and thereby taken this indicator to a pretty deeply negative reading. Excursions down to -4% or lower are pretty good markers of really important lows for the NDX. They show that investors have shunned those stocks too much, and that sets the stage for the tide to come rushing back in.”
- “The recent low for this percent deviation indicator is the lowest since all the way back in 2006. Similar readings over the past few years have represented really great buying opportunities for getting into the Nasdaq 100, not as a day to day trade, but as a long term one. So as we get through the corrective work that is still needed in the month of June, as discussed in our most recent McClellan Market Report newsletter and Daily Edition issues, the message of these indicators is that we should look for the Nasdaq 100 stocks to lead the way higher.”
The above is for one-side of the QQQ+TLT portfolio of Brian Chappatta. What about TLT or Treasury Rates?
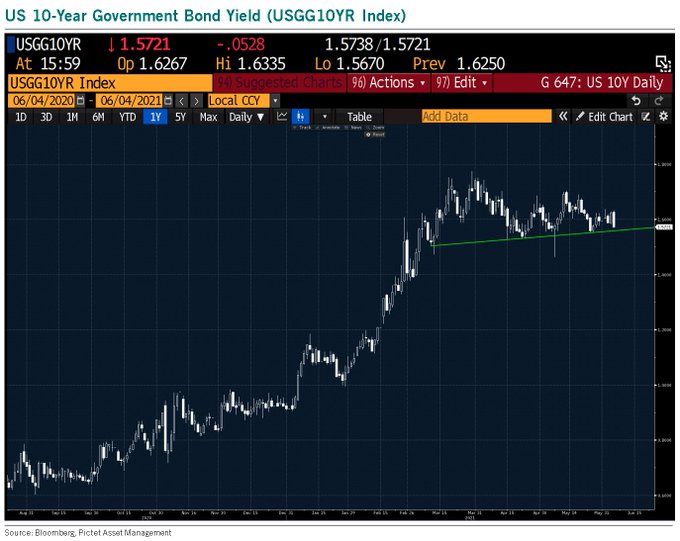
- Julien Bittel, CFA@BittelJulien – I think there are quite a few ways to draw lines on the US 10-year here… This one looks important imo.
Goldman’s Ashish Shah termed the Non-Farm payroll number as a “goldilocks number” on Bloomberg Real Yield on Friday. But what about “inflation”? And that is fueled by excess demand over supply, right?
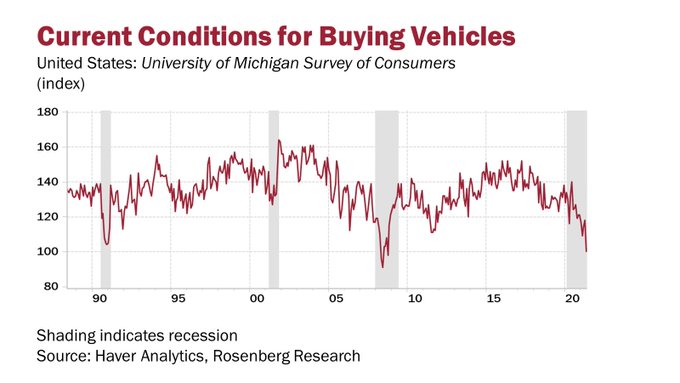
- David Rosenberg@EconguyRosie – Guess what? The demand boom is over. Charts don’t lie – once supply comes back on stream, the demand downturn will cause inflation to morph into deflation. Definitely out of consensus and not priced into anything. Treasuries will rally and cyclical-value equity trade will fade.
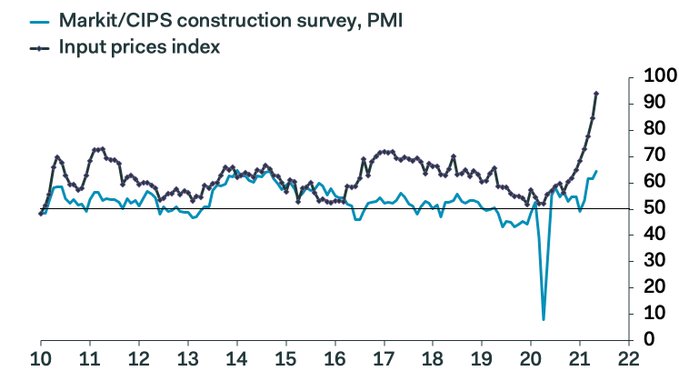
What about construction?
- Samuel Tombs@samueltombs – Input prices in the construction sector now are rising at an unprecedented rate, according to the latest PMI survey. Hard to believe that demand will remain robust when these costs are passed on to end customers.
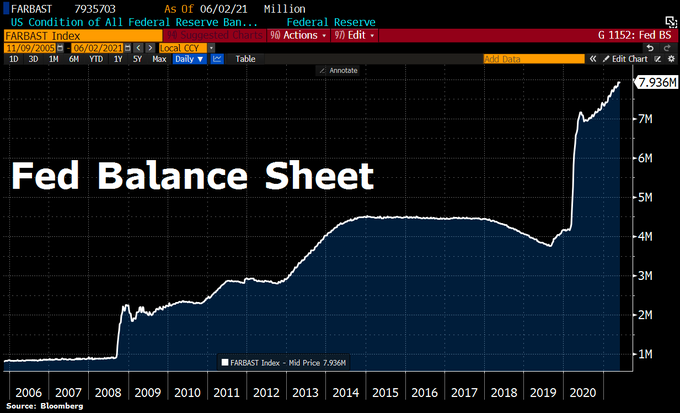
All this is fine but we get CPI & PPI next week followed by the Fed the following week. And isn’t the tone all about the Fed getting pressured into a taper? But how do the Fed’s actions match up with this expectation?
- Holger Zschaepitz@Schuldensuehner – #Fed balance sheet hit fresh ATH as Powell keeps printing pres rumbling despite rising inflation. Total assets expanded by 0.4% to a record $7.94tn in the past week. Fed’s balance sheet now equal to 36% of US’s GDP vs ECB’s 77% and BoJ’s 134%.
And what did BlackRock’s Rick Rieder say about the looming taper after the NFP number on BTV? – “Fed is going to be so deliberate in tapering; we are long; we are in equities…“
Finally, VIX fell almost 9% on Friday in a celebration of “goldilocks”. Speaking empirically, VIX tends to bounce up on days which feature rise in Treasury rates. So if Treasury rates are going to behave and if Fed keeps killing volatility on FOMC days, then shouldn’t VIX act as it did this week – closing the week down to 16.42. Remember that Tom Lee had spoken about VIX getting down to a 15-handle leading to 4400, his target for the first half of 2021.
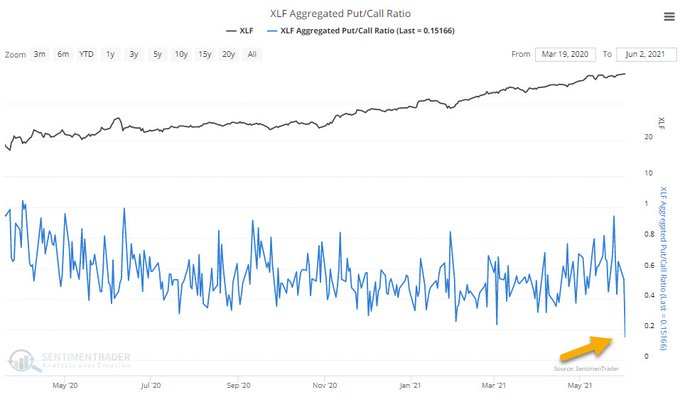
How much of the rising rate specter is priced into markets? Look at the optimism about a sector that is most associated with increases in Treasury yields?
- SentimenTrader@sentimentrader – Jun 3 – The aggregate put/call ratio among financial stocks yesterday was a lowly 0.15. That’s the 2nd-lowest reading in at least 7 years. Why hedge when STONKS?
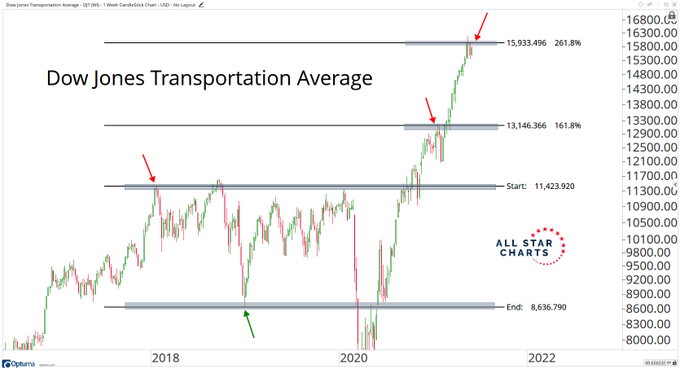
And what about the sector that is often described as a leading indicator?
- J.C. Parets@allstarcharts – 6 Shorts For The Summer allstarcharts.com/summer-shorts-
But anything within the S&P that suggests all is not great?
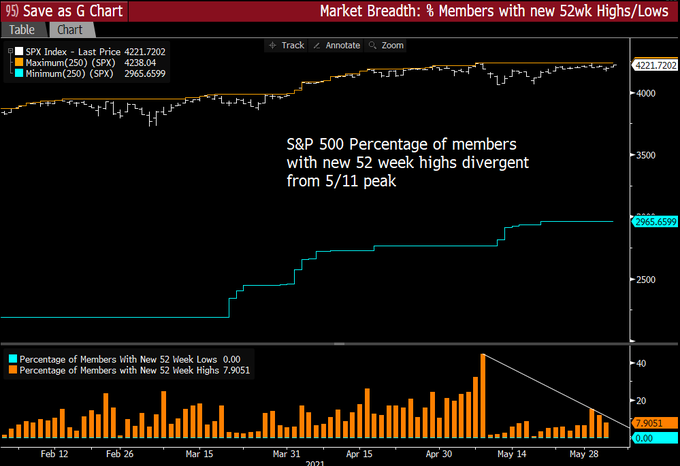
- Thomas Thornton@TommyThornton – $SPX within 35bps of new all time high while new 52 week highs lags with a divergence
2. The Real Action
Another sign of “goldilocks” might be the fall of 40 bps in the U.S. Dollar on Friday. No wonder EEM matched the S&P rally on Friday. Chinese ETFs also matched the S&P performance. South Korea was up 1.10%. Indian ETFs outperformed the S&P again for both the week and on Friday, up 2.5% & 1.4% resp.
But what is next for Indian stocks after the big run since April 25? Sentimentrader.com wrote in their Stat Box this week:
- Nearly 93% of stocks in the S&P BSE Sensex Index of Indian stocks have climbed above their 50-day moving averages. When the index has seen similar internal thrusts, it rallied over the next 3 months after 19 out of 22 signals.
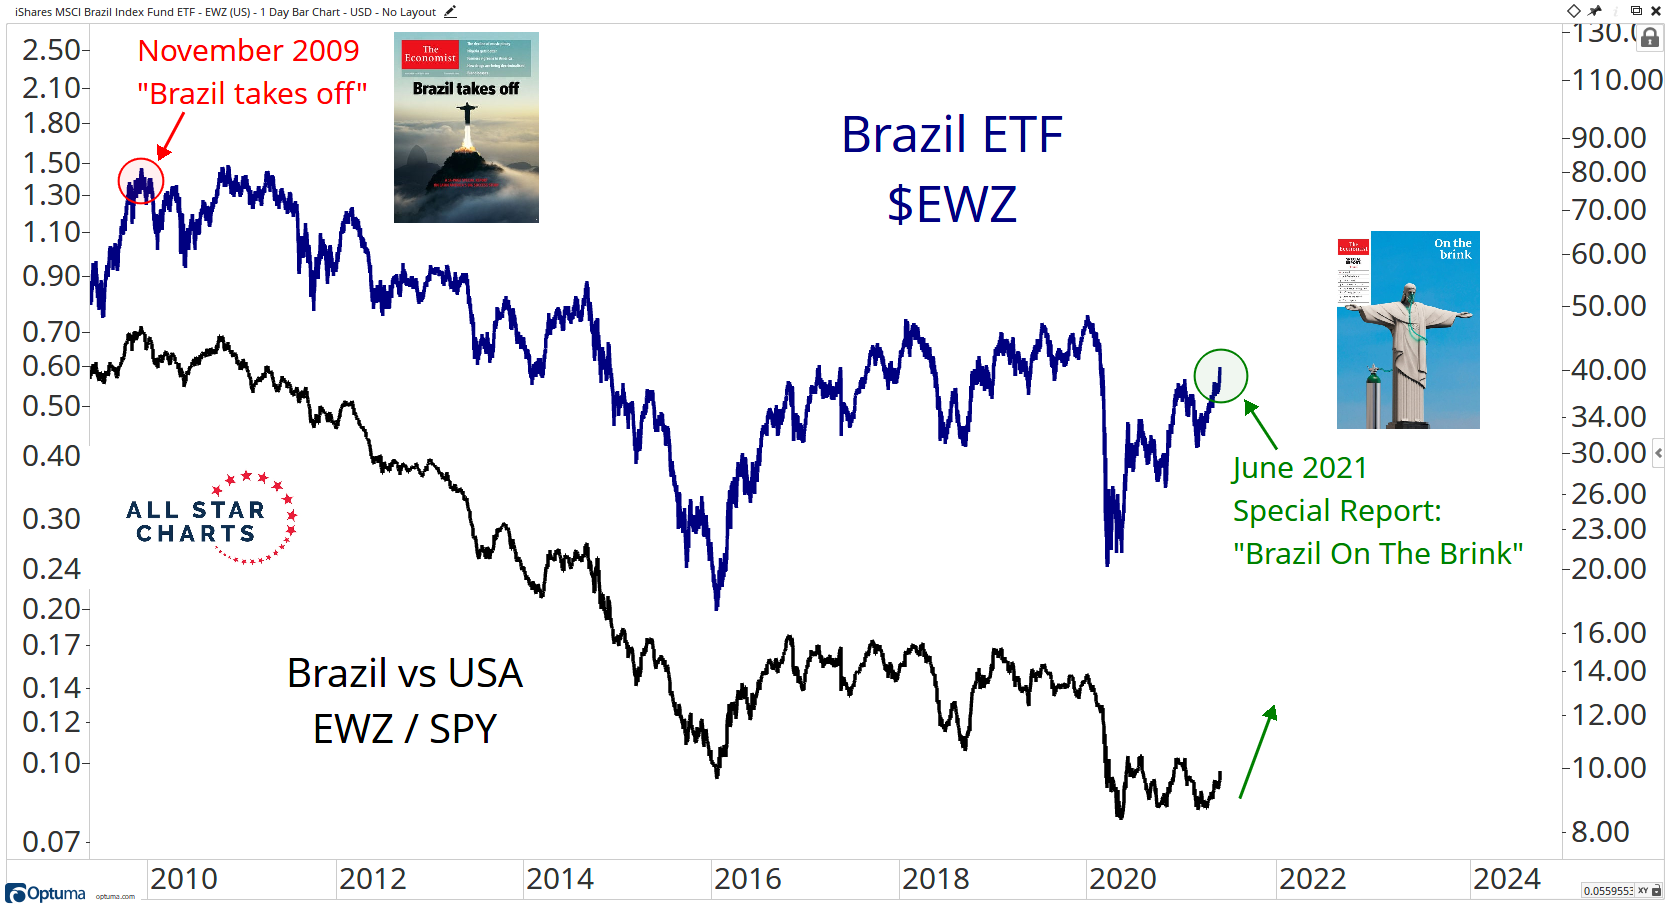
We know how the U.S. market broke out in late March 2020 after the Coronavirus peaked. We have described how the Indian market broke out in late April after the peak in the Coronavirus. Well, is it Brazil’s turn now? EWZ, was the star again rallying 7% on the week. Of course, EWZ had another powerful stimulus this week – the new cover of this week’s Economist. J.C. Parets compared this cover with the 2009 cover:
What else does Parets like?
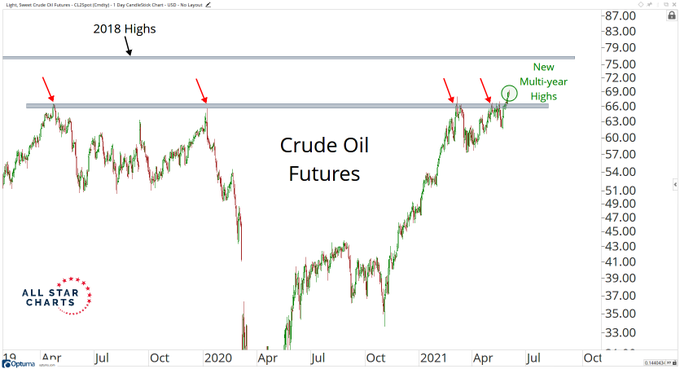
- J.C. Parets@allstarcharts – New Multi-year highs for Crude Oil. $76 next?
If Brazil is rallying and Oil is rallying, how did Petrobras behave? It only rallied 14% this week.
But what about OIH, the favorite play of Tom Lee?
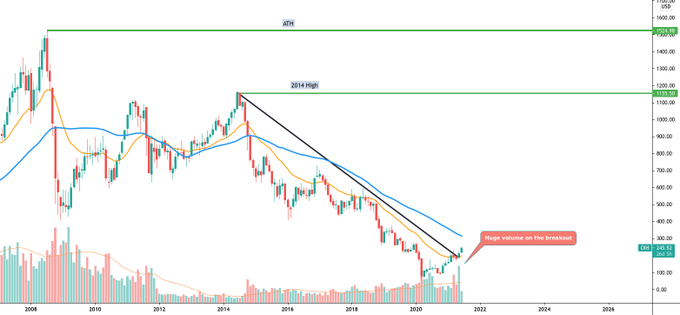
- TradingView Ideas@TradingViewBot – $OIH – go long OIH – TradingView – … After almost 7 years of bearish price action, oil services will be essential in the transition to electric vehicles and clean energy. Most automakers are shooting for 2025 to have an entire EV fleet… other charts at “https://www.tradingview.com/chart/OIH/Q0YcCcOw-go-long-OIH/”
Oil broke the $66 level of Parets & the $68 level of Tom Lee who reiterated his call on OIH on CNBC Closing Bell this week. He termed OIH as HODL for next 3-5 years and compared energy to Bitcoin in 2017. Calling energy sector as having the best supply-demand dynamics in 15 years, he said OIH is undervalued compared to Oil & said OIH will go to $740 if Oil gets to $80.
That is fine but how does the energy sector appear to the ultimate un-rosy of them all?
- David Rosenberg in Friday’s Weekly Snack with Dave – HOW MUCH UPSIDE (IF ANY) IS IN ENERGY STOCKS? With oil prices touching their highest level in three years, we decided to look into what it would mean for energy stocks if prices consolidated at this new and higher range. We found that, in the context of an equity market that is offering increasingly few attractive opportunities, this is one area that continues to make sense due to the potential for further price appreciation.
Send your feedback to editor@macroviewpoints.com Or @MacroViewpoints on Twitter
