Summary – A top-down review of interesting calls and comments made last week in Treasuries, monetary policy, economics, stocks, bonds & commodities. TAC is our acronym for Tweets, Articles, & Clips – our basic inputs for this article.
Editor’s Note: In this series of articles, we include important or interesting Tweets, Articles, Video Clips with our comments. This is an article that expresses our personal opinions about comments made on Television, Tweeter, and in Print. It is NOT intended to provide any investment advice of any type whatsoever. No one should base any investing decisions or conclusions based on anything written in or inferred from this article. Macro Viewpoints & its affiliates expressly disclaim all liability in respect to actions taken based on any or all of the information in this article. Investing is a serious matter and all investment decisions should only be taken after a detailed discussion with your investment advisor and should be subject to your objectives, suitability requirements and risk tolerance.
1.Markets Last Week
Fixed Income:
- 30-year Treasury yield up 5.8 bps on the week; 20-yr yield up 5.8 bps; 10-yr up 5.9 bps; 7-yr up 6.5 bps; 5-yr up 7.1 bps; 3-yr up 9.4 bps; 2-yr up 10.6 bps; 1-yr up 6.3 bps;
- TLT down 93 bps; EDV down 2.4%; ZROZ down 1.2%; HYG up 1.1 bps; JNK up 1.3%; EMB up 86 bps; leveraged DPG up 81 bps; leveraged UTG up 2.8%;
US Indices:
- VIX down 21%; Dow up 3.4%; SPX up 5.3%; RSP up 4.3%; NDX up 6.8%; SMH up 10.2%; RUT up 4.5%; MDY up 4.9%; XLU up 2.3%;
Mega Caps:
- AAPL up 6.3%; AMZN up 6.3%; GOOGL up 8.8%; META up 7.9%; MSFT up 4%; NFLX up 4.4%; NVDA up 16.1%; MU up 13.8%;
Financials:
- BAC up 6.9%; C up 6%; GS up 9.2%; JPM up 5.7%; KRE up 4.9%; EUFN up 1.6%; SCHW up 4.1%; APO up 8.6%; BX up 4.9%; KKR up 4.8%; HDB up 2.5%; IBN up 5.2%;
Dollar was up 80 bps on UUP & up 72 bps on DXY:
- Gold down 4.1%; GDX down 7.9%; Silver down 1.6%; Copper down 1.3%; CLF up 8.6%; FCX up 26 bps; MOS up 7.7%; Oil up 2.3%; Brent up 2.2%; OIH up 2.9%; XLE up 3.6%;
International Stocks:
- EEM up 3%; FXI up 2.4%; KWEB up 4.3%; EWZ up 1.5%; EWY up 1.9%; EWG up 22 bps; INDA up 4.4%; INDY up 3.6%; EPI up 5.7%; SMIN up 6.3%;
Kudos to Liz Ann Sonders of Schwab who gave a green signal on Monday:
- Liz Ann Sonders@LizAnnSonders – Large speculators / hedge funds remain net short S&P 500 futures, with pessimistic positions growing over past few weeks
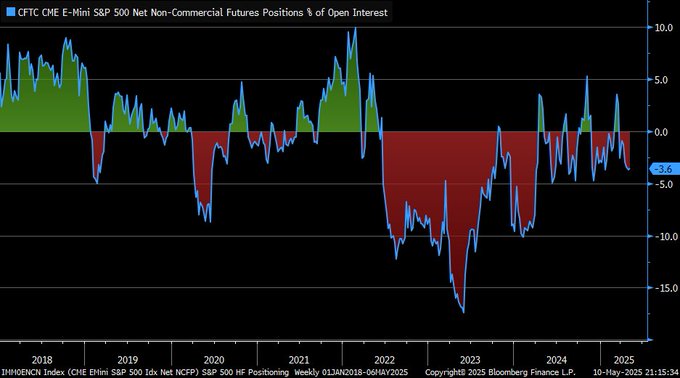
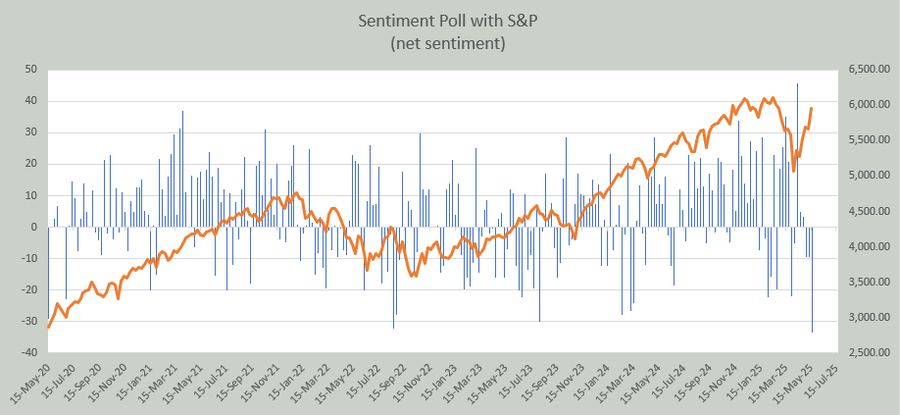
But that was back on Monday, May 12. Has bearish sentiment improved after a big up week?
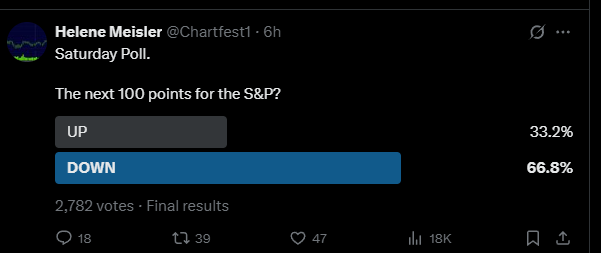
- Helene Meisler@Chartfest1 – 5-17 – The results are in and folks lean bearish. It is the most ‘bearish’ they have ever leaned. The next closes is August 2022. What I find more interesting is that this is the 3rd straight week for a down vote. For the contrarians out there, remember you guys are often right.
Kudos to Mike Wilson for a thoughtful & sensible elaboration of why his 2nd half 2025 range is 6000-6500 with 6,500 as his year-end target. He adds that 6,500 could come on Dec 31, Q1 2026 or it could even come sooner if things play out faster than people are anticipating. His three cases for a positive outlook are getting the bill done for tax relief extension, having a path for for funding of the deficits, & the Fed coming back into the picture. He points out that the Dollar is significantly weaker now than it was at the end of last year & that is a massive tail-wind for earnings growth.
Regarding the Fed, Wilson points out that a lot of the private economy is still in a recession; most of the interest-sensitive sectors of the economy have been very very soft and the Fed knows it. He would like to go into the pure cyclical parts of the market areas that have been beaten up the most but he is holding back because it is going to take time for the Fed to actually cut rates.
2. Equities
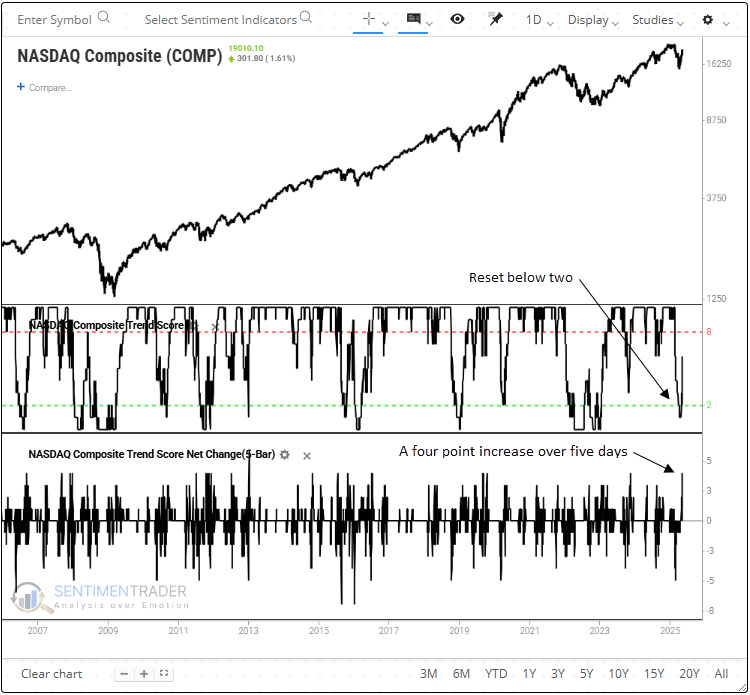
Four new positive signals were triggered this week, the first being “a Nasdaq signal with near-perfect record“.
- SentimenTrader@sentimentrader – On Monday, the Nasdaq Composite’s trend score jumped by four points over a five-day window, triggering a buy signal for the technology-heavy benchmark. Similar trend shifts saw the index rise 94% of the time over the subsequent year. Read @DeanChristians’s May 14 article “Nasdaq signal with near-perfect record just triggered”: https://users.sentimentrader.com/users/modeledge/nasdaq-signal-with-near-perfect-record-just-triggered
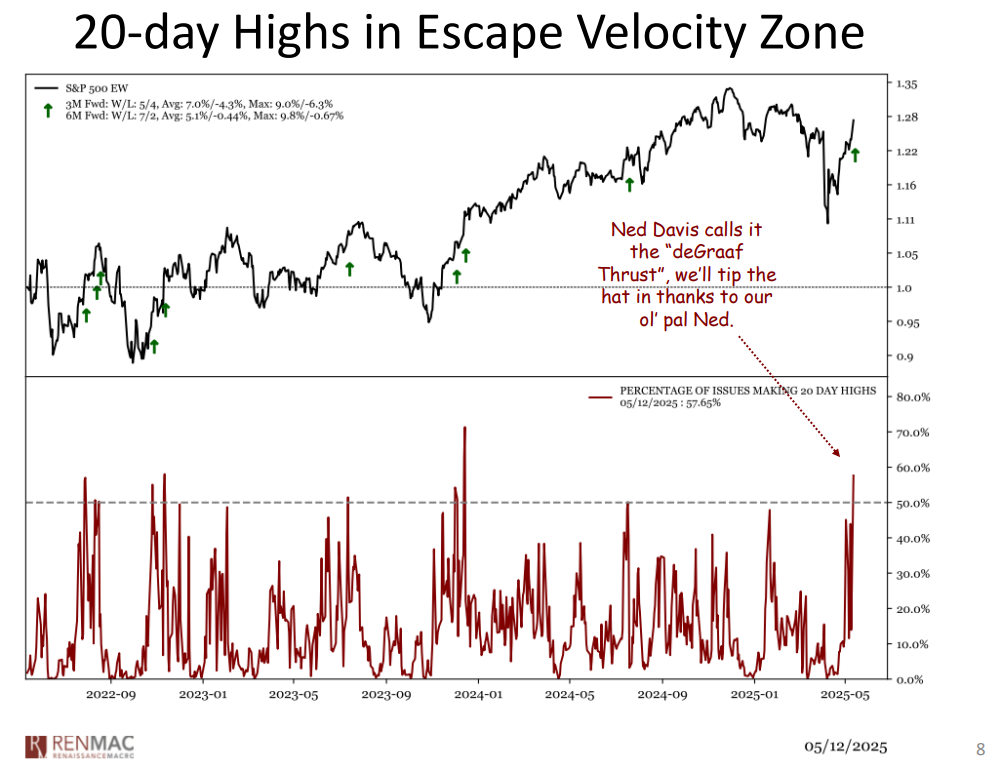
Second is the DeGraff Thrust Indicator
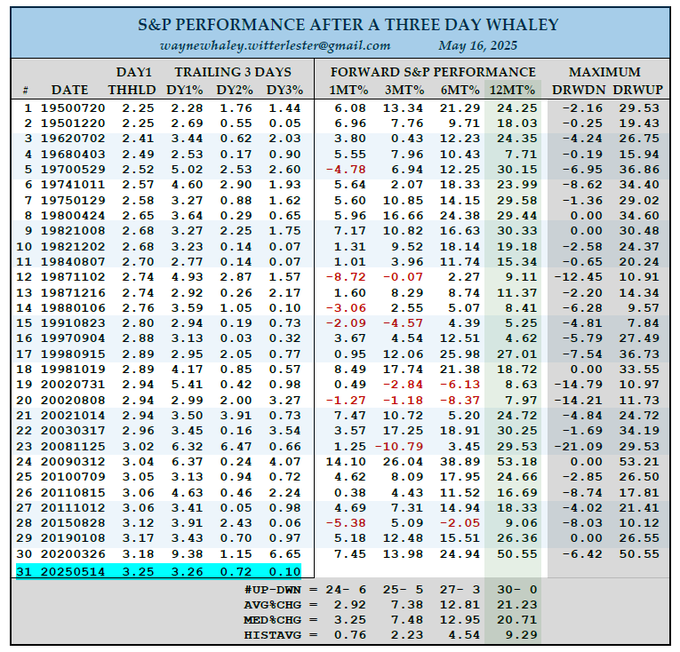
The 3rd is the “Three Day Whaley” price move which is a sign of strength which merits respect:
- Wayne Whaley@WayneWhaley1136 – A 30-0 THREE DAY WHALEY
When the S&P experiences a one day, upside pop of the three standard deviation variety to the upside, there is a tendency for the S&P to follow such with some modest level of profit taking (consolidation) over the next couple of days. The ability of the index to defy profit taking tendencies and follow such a one day occurrence with two consecutive positive days is a sign of strength which merits respect and is the concept behind a “Three Day Whaley” price move.
Volatility has expanded over the last 75 years. The setup requires that the S&P post a move on Day 1 which is a function of the volatility in the time period in which it occurs and then follow it with two consecutive positive days. That first day threshold has evolved from around 2.25% in 1950 to 3.25% in 2025.
On May 12-14th, the S&P met the qualifications for this setup with a three day 3.25, 0.76, 0.10%, three day sequence, its first signal since March 26 of 2020 which was followed by a 50.55% year.
The S&P is 30-0 since 1950 in the year following this setup for an avg annual gain of 20.2% with all 30 cases experiencing at least a 7.5% gain. Only four of the 30 prior cases experienced a double digit drawdown. You can see the first day threshold requirement in column 3 (DAY1 THHLD) in the table below.
A Three Day Whaley is one of many signals on 14 markets that my models scan for each day and I share with my commentary subscribers each week ~ [email protected]
The 4th is a “new pattern” from Lawrence McMillan of OptionStrategist.com:
$SPX gapped higher on Monday, blasting right through former resistance at 5700 and 5800, and thus establishing a new bullish pattern on its chart.
The next resistance area is at the all-time highs of 6150. Yes, it is possible that the Index could falter before reaching 6150, and if it did that, there is still the possibility of a pattern of lower highs on the chart. But we will deal with that if it comes to pass.
For now, this breakout appears to be real and is being accompanied by some buy signals from our internal indicators although not all are on buy signals yet.
Equity-only put-call ratios continue to drop, and that is bullish for stocks. These ratios will only generate sell signals for stocks when they roll over and begin to trend higher.
Breadth continues to be a strength of this market. The breadth oscillators issued buy signals fairly early on (April 23rd) and have remained bullish since then. These oscillators have been in overbought territory for much of that time, but that is a positive thing when $SPX is beginning a new leg upward. It is going to take at least two consecutive days of negative breadth in order to cancel out these buy signals.
How about a simple bullish MACD cross after all the heavy stuff above?
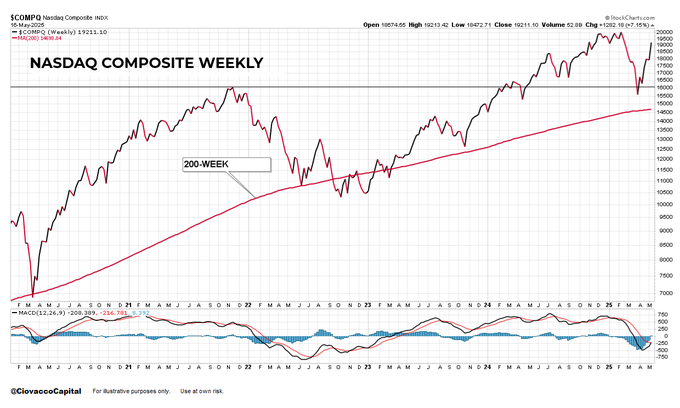
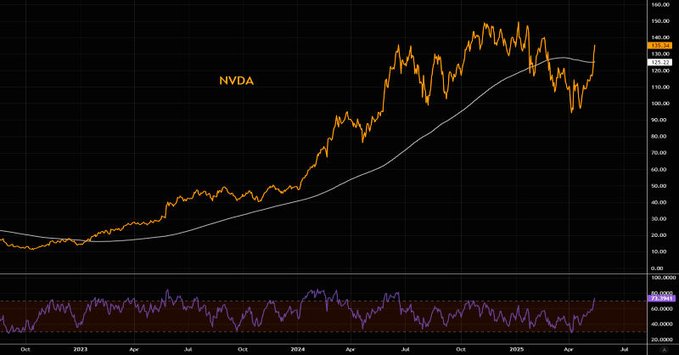
- Chris Ciovacco@CiovaccoCapital – The NASDAQ nailed down a weekly bullish MACD cross on Friday. It recently held at a logical level of prior resistance from 2022 and above an upward-sloping 200-week. Speaks to odds looking out weeks and months. Click image to enlarge. $QQQ $COMPQ $XLK $SMH $ONEQ
And,
- Mark Ungewitter@mark_ungewitter – Price momentum behaving constructively.
What about the most cyclical of Nasdaq sectors?
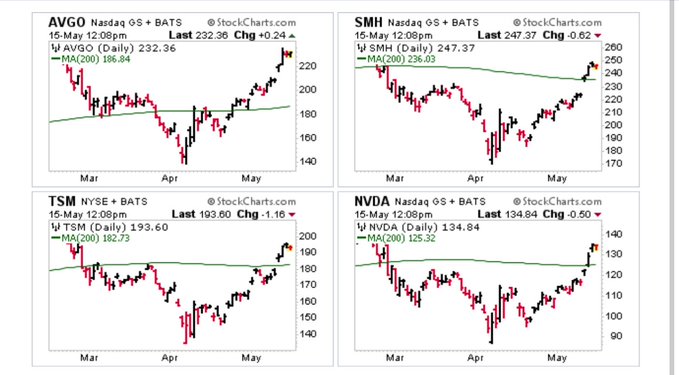
- Larry Tentarelli, Blue Chip Daily@bluechipdaily – Big 3 semis all back over the 200-sma for the first time since late Feb. $NVDA $TSM $AVGO $SMH
On the other hand,
Was the above tweet supposed to be negative? Not sure. But no doubt about the below:
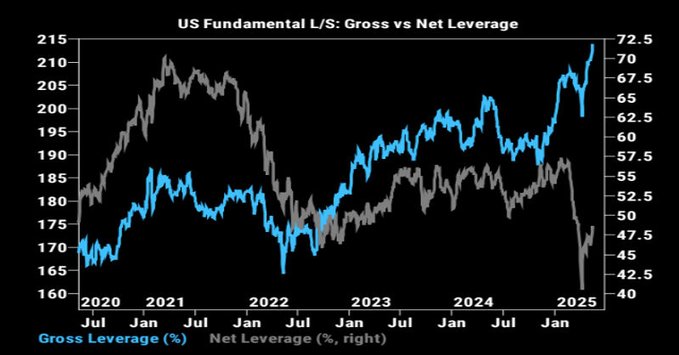
- The Market Ear@themarketear – Going into this week: * Hedge funds just hit 100th percentile gross leverage * Biggest 6-week positioning jump since 2020. * Net buying at +2.5 SD (largest since Dec ’21) * Put protection near multi-year lows * “Offers wanted” floods GS desk This isn’t cautious buying—it’s panic-driven chase mode. zerohedge.com/the-market-ear
3. Fixed Income
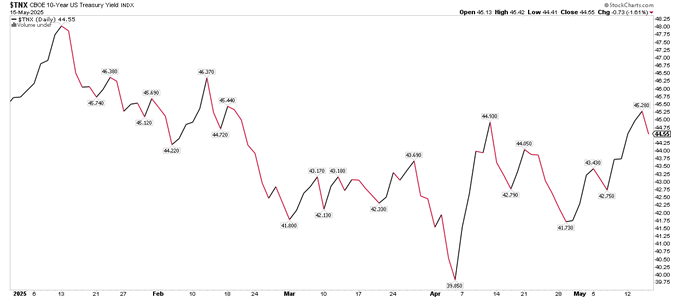
Long duration Treasury yields rose from Monday to Wednesday with CNBC Fast Money interest-rate “experts” highlighting the 10-yr yield closing over 4.5% and suggesting viewers focus on stocks instead.
Then something mad happened after the Fast Money show & that too on the same CNBC network. Guess what Jim Cramer recommended to his viewers:
- “In a very uncertain tape, I would rather own a piece of paper like 10-year Treasury where, if worst comes to worst, at least I get my money back“
He said that after showing how terrific stable growth companies have been hit very hard. Kudos to Cramer for suggesting a sensible path for his viewers especially at 10-yr at 4.5%. Watch the clip below.
The same day and before the Fast Money show, mild-spoken Bob Doll of Crossmark pointed out that “soft data has collapsed“. Fast forward to Friday morning and see what not-usually-mild-spoken Rick Santelli said about Consumer Sentiment:
Roll forward to the 1:00 pm hour & read what Fixed-Income specialist Gilbert Garcia said on CNBC about the 4.5% yield of the 10-yr Treasury:
- ” look at the 2-year Treasury at 3.90% & 5-yr Treasury at 4%; great time to be in Treasuries; Not a good time to be in corporate bonds whether it is investment grade or high-yield“
David Rosenberg focused on the long end:
- David Rosenberg@EconguyRosie – The fact that single-family housing starts dropped 2% in April and are down a whopping 12% year-on-year to a nine-month low is the clearest sign of how the economy is in desperate need of interest rate relief. Not to mention yesterday’s disaster of an NAHB survey. As the soft data get even softer, we remain steadfastly and stubbornly long the bond!
Sadly, Signor Rosenberg doesn’t listen to the Fed saying they are focused on hard data. Presumably they only wish to keep their own vigilante political backers content & happy.
- Mike Zaccardi, CFA, CMT 🍖@MikeZaccardi – Are the bond vigilantes really going to lean on a chart like this? $TNX yield down on the year. Quite the narrative being pushed right now.
Yes we know that the Fed is contemptuous of traders, but in our experience traders are right far more often than the Fed.
- Trader Z@angrybear168 – $TLT seems like everyone is feverish long rates at this point just as bonds enter a favorable period to have a quick relief rally
That is why so many viewers would rather listen to Cramer than regular CNBC anchors.
Last week, we addressed the worries expressed by Jeff Gundlach about the over-owned & increasingly illiquid state of the private credit space. This week we kept hearing about how private credit is now the most active area for restructuring credit portfolios. Hopefully, these efforts are successful in preventing a mess in that sector. And, of course, not a single Fed guy said even a letter, forget about a word, about “private credit” while discussing their views of rates on CNBC. And, double of course, no anchor on CNBC asked them about private credit.
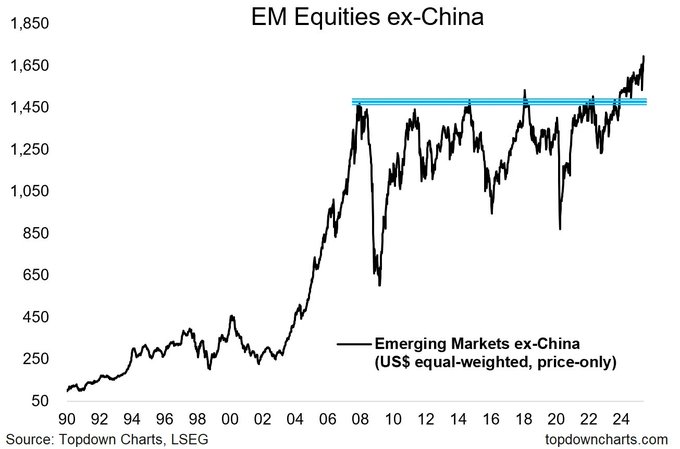
4. Emerging Markets
Most would be sympathetic to the message below:
- Topdown Charts@topdowncharts – – Chart of the Week – Emerging Markets This is probably one of the most important charts you’ve never heard of… Explained: entrylevel.topdowncharts.com/p/chart-of-the
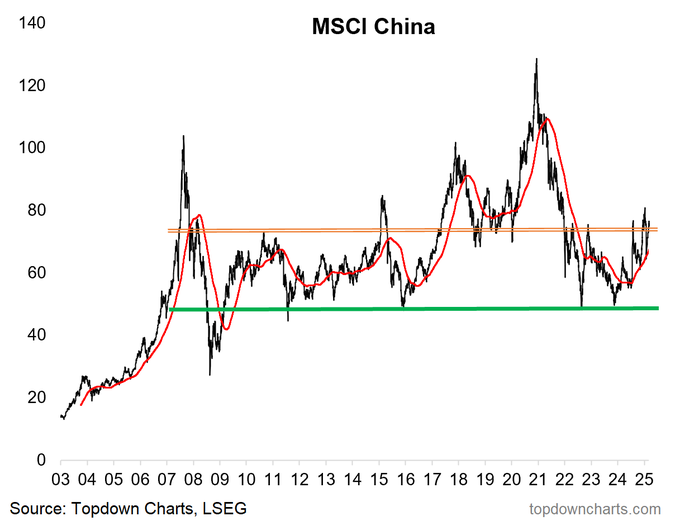
Why not look at China alone?
- Topdown Charts@topdowncharts – 5-18 – Big Beautiful Base building in Chinese Stocks… The bull case for Emerging Markets: entrylevel.topdowncharts.com/p/chart-of-the
A different view below:
Then we saw the following on May 14. We are neither smart enough nor knowledgeable enough to comment on the below clip. Shared here for better informed readers.
Finally, a view from the most well-known EM investor about a range of emerging markets:
5. Indian Stock Market & Indian Defense Sector
Last week, we saw the most intense warfare between India & NaPakistan ever. The four previous conflicts were mainly infantry dominated battles that took weeks to end. The one last week ended in 5 days with what analysts termed a decisive victory. Then on this past Monday morning, the Indian Stock Market & the India-ETFs exploded in price.
As most know, the Indian stock market went thru a nasty downturn from October 2024 into March 2025. We highlighted what we believed was the end of that downturn on March 19, 2025. That makes the 2025 comparison between INDA & SPX an interesting one.
Back on September 29, 2024, we had highlighted the Indian Defense sector as one to follow. That proved true fundamentally but not in price because that article actually marked the start of the intense downturn in Indian Rupee & Indian stocks. Interestingly that was also the day when the big feature was David Tepper’s Buy China call.
How has the Indian Defense sector performed in 2025? Look at the two stocks we highlighted back in September 2024 – Hindustan Aeronautics (HAL) & Bharat Electronics (BEL), both old Public Sector Enterprises:
(BEL) (HAL)
Look at the up move in BEL this past week. To understand why, listen to quick summary of comments by Tom Porter, a veteran air-combat expert who lives in Vienna, Austria:
As he explains, Napak attacked India with Attack UAVs, Missiles & finally with Ballistic Missiles. But that failed because nothing got thru Indian Air Defense. That enabled the Indian Air Force to launch their massive, supersonic missiles at Napaki air bases on 10th May. As many clips can show you, 11 airbases of NaPak were devastated by Brahmos missiles in 23 minutes. As many know, the last two were at Rawalpindi & at Sargodha (main seat of Napak nuclear weapons). That prompted the Army Chief to reportedly call Secretary of State Rubio who answered the 2nd call & he asked the Napak chief to contact India. They did & India agreed to “cessation of hostilities“*. So allow us to point out that President Trump was indeed correct in saying that he arranged the ceasefire. For more details (Search “Tom Porter Vienna re Indian attack” & get many longer clips up to 55 minutes plus)
- “as an aside, we saw few more single drone-missiles attack on Indian Defense over the next couple of hours even after India had agreed to “cease hostilities”. Apparently, Napak Chief had NOT consulted the Chinese before calling Secretary Rubio & then calling the Indian officials. So China reportedly read the Napakis the riot act & ordered them to not stop. That is why they launched a few faint attacks & then again pronounced their ceasefire after 2-3 hours. Guess the Indian Officials knew this & so they did not respond react to Napaki violations.” we recall someone saying on TV that this was like one wife trying to get permission from both of her husbands.
The point, as Tom Porter explains, is the absolute dominance of Indian Air Defense over whatever was fired at it, some 600 attacks across 3,000 km of territory. As we touched on last week, Indian Air Defense is an integrated wall from long-distance S-400 Russian defense to medium range Israeli Barak to very fast artillery at the near level. Binding all this together, was the Akash (Aakash correct pronunciation) system, manufactured by BEL. As experts have explained, the integration was the main factor of the dominance.
The total success of the Akash-Teer has not only stunned experts but reportedly, the India has been besieged by countries asking to purchase this system. It might be interesting to watch the 5-minute video clip that factually explains the system and the AI-based decision-making that Aakaash uses.
Getting to the China angle, the nuclear weapons sites were guarded by Chinese Air Defense Systems. The long-range HQ-9 system was destroyed by Indian Air Force on the first day, as we recall. The Chinese beyond visual range missiles were also hit by the IAF before the Indian Brahmos-led supersonic missile attack. The easiest way to understand how is to listen to a 5-minute summary by Col (Retd) John Spencer — Chair of Urban Warfare Studies at Modern War Institute at WestPoint, and a decorated U.S. Army veteran.
For more details, watch 2 other clips of Col. Spencer:
- John Spencer: India Was Able To Hit Every Target, Which Is No Easy Task – 9 minutes
- Colonel John Spencer: India Establishes New Strategic Doctrine Against Terrorism – 24:29 minutes
As someone said on TV the next day that Israelis & Russians were thrilled with the action while the Chinese were mortified. A lot of talk on air & print was focused on the clash between Indian weapons & Chinese weapons. One such soft-spoken short clip is below:
Going back to stocks, most do not get that Indian weapons design & development is also an integrated system in which a large number of private companies & startups design the innovative systems with the large entities like HAL, BEL & Bharat Dynamics. For example, look at the new Bhaargav–Astra, the counter-drone micro rockets based system launched by Solar Defense & Aerospace Limited (SDAL). It is designed to destroy drone-swarms like the ones that have been used successfully in Ukraine recently. Each Astra missile is able to simultaneously destroy 64 drones. Read the description & watch a short clip:
Getting back to the stock market, watch the clip Defence Stocks a LONG TERM Play – Top 3 Defence Stocks below (all 3 stocks were named above). The clip goes thru analysis of income statements & balance sheets of the 3 stocks. It is the view of one analyst/advisor. Read & follow at your own risk, obviously!
If you want to get a jump on what might happen in the near future & what might have already begun, look at our September 2024 articles & go thru our coverage of Balochistan, Sindh & Khyber-Pakhtunkhawa, the 3 provinces of Napakistan that are now actively working to become independent of Napaki Army Rule.
By the way, the absolute hero for us was YouTube. The 3 major TV networks in India had live sessions running on YouTube. That blew away any War film we have watched. On Monday morning, both the S&P and the India-market ETFs exploded. While we had fun, we did feel some regrets for our friends at CNBC who seem to run away in fear & caution from Indian markets just when they should be going in. They told their viewers last year to Sell Indian stock market when PM Modi got elected & made their viewers miss what turned out to be a 20% post-election rally. And we all saw what happened last week.
Finally, we saw the clip below just as we were about to conclude this article. It features a detailed, comprehensive view (ignore the flashy title) of last week’s military action from Tom Porter who knows more, has more & terrific contacts in the militaries of India & NaPakistan. It is for those who like to hear real, detailed analysis from an expert like Tom Porter and don’t mind devoting 55 minutes to it.
Send your feedback to [email protected] Or @MacroViewpoints on X.