Summary – A top-down review of interesting calls and comments made last week in Treasuries, monetary policy, economics, stocks, bonds & commodities. TAC is our acronym for Tweets, Articles, & Clips –our basic inputs for this article.
Editor’s Note: In this series of articles, we include important or interesting Tweets, Articles, Video Clips with our comments. This is an article that expresses our personal opinions about comments made on Television, Tweeter, and in Print. It is NOT intended to provide any investment advice of any type whatsoever. No one should base any investing decisions or conclusions based on anything written in or inferred from this article. Macro Viewpoints & its affiliates expressly disclaim all liability in respect to actions taken based on any or all of the information in this article. Investing is a serious matter and all investment decisions should only be taken after a detailed discussion with your investment advisor and should be subject to your objectives, suitability requirements and risk tolerance
1. “Capitalism is kicking China’s Butt”
What a week! It was as if every crisis that could erupt did – It began with Saudi Arabia & its cohorts breaking off diplomatic relations with Iran. The same night the Chinese market fell by 7%. Then North Korea claimed they tested a Hydrogen bomb. The following night, the Chinese stock market fell by 7% in 29 minutes and had to shut down for the rest of the day. No wonder the US stock markets had their worst week in history, or at least in our life time.
Forget Saudi Arabia-Iran & North Korea. They are what the Fed would call ‘transitory” issues, at least for now. China is the big deal – the home of a “colossal credit bubble” as Marc Faber put it. They began 2016 determined to devalue the Yuan vs. the Dollar. What happened was best described by UC-Irvine Professor Peter Navarro as “Command & Control vs. Capitalism” and “Capitalism is kicking China’s butt” was his verdict. Jim Rickards was even more contemptuous in an interview with CBC:
- “The Chinese are communists and they don’t know anything about capital markets. Putting communists in charge of capital markets is like giving a loaded gun to a three-year old,”

The Chinese have been trying to depreciate the Yuan since August. They were surreptitious after the August 2015 fiasco. What they have done since then didn’t really work except to reduce their FX reserves by $512 billion in 2015, the last $100 billion plus getting plunked in December. Guess they decided to accelerate the depreciation this week while simultaneously cushioning the stock market impact via circuit breakers. They got their butts kicked. So on Thursday they cancelled the circuit breakers and defended their stock market traditionally.
Since gentleness has not worked, there is now pressure on the Chinese Central Bank to quickly depreciate the Yuan by 10-15% according to Reuters. That shock therapy will at least eliminate the policy uncertainty & minimize capital flight. Why would capital fly out after the currency has been devalued? This may be why Raoul Pal, editor of Global Macro Investor, said on CNBC FM that Asia could see a relief rally that might last awhile.
But “awhile” will only be a band aid. As Kyle Bass said on CNBC on Friday, the real issue in China is the size of their $31 trillion banking system dwarfing their economy of $10 trillion. So a 10% loss due to non-performing assets would result in a $3 trillion hole that would eat up their entire FX reserves. Fortunately, managing this credit cycle can be done slowly as Japan did but with the Japanese result of slow growth over decades.
2. Global Deflation & the R-word
According to Raoul Pal, the year/year fall in global exports is now at the 2nd worst level since 1958. His conclusion – “something massive is going on in the global economy & people are missing it by looking at financial markets; data is terrible out there“. Jeff Gundlach voiced similar sentiments according to the Wall Street Journal – “You have to wonder what’s going on when every single indicator is weaker, and some frighteningly weaker,” Gundlach’s forecast for 2016 global growth is 2%, lower than the reduced World Bank forecast of 2.9%
Gundlach was quoted before the release of the stunning 292,000 NFP number on Friday. You would think the Treasury market would have fallen hard. After all, Chinese reserve liquidation has had steady pressure on Treasuries for the past few weeks. Treasury yields did rise in the immediate aftermath of the jobs number but ended the day much lower in a bull-flattening.
Our own preference is the 15 year old dictum we heard from Abby Joseph Cohen in 2000 – year end rally always happens unless there is deflation. This can be written as A implies B, with A = no deflation & B = year end rally. Mathematical logic teaches that (A implies B) is logically equivalent to (- B implies – A) or we have deflation because there was no year-end rally.
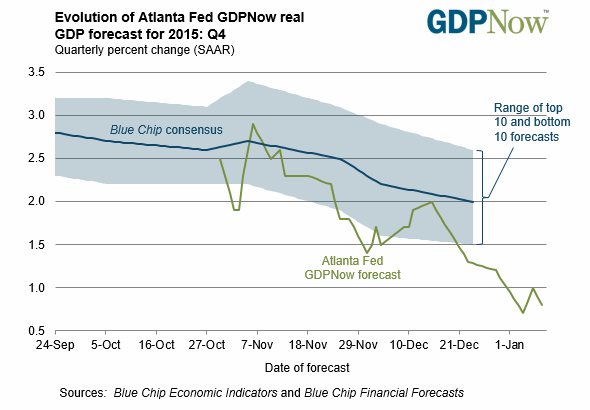
But can we have deflation without a recession or a recession type slowdown in the US? Not in our opinion.
- Atlanta Fed @AtlantaFed – On Jan 8, the #GDPNow model forecast for real GDP growth in Q4 2015 is 0.8%, down from Jan 6 https://goo.gl/RSxIXN
- Keith McCullough @KeithMcCullough – My call on US Jobs? This chart is going to rip as corporate profits slow into a recession
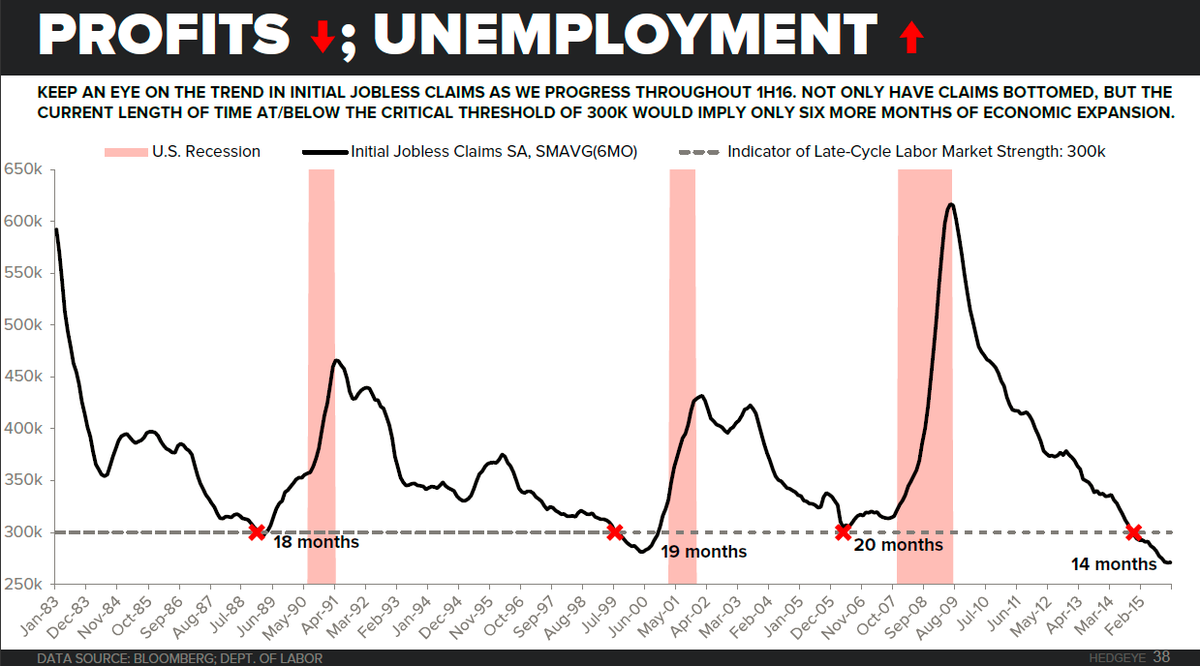
- Keith McCullough @KeithMcCullough – CHART OF THE DAY | Recession? This Indicator Sees Worst Contraction Since 2009

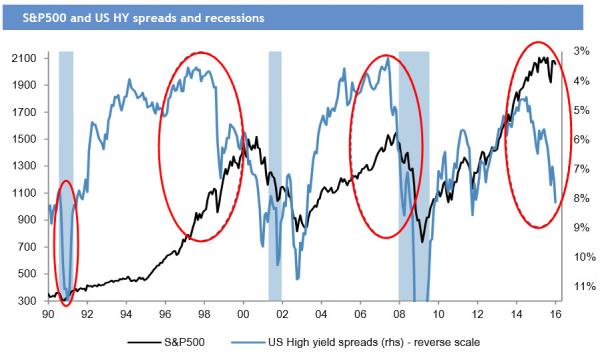
- Prof. Steve Hanke @steve_hanke – Among @jpmorgan’s three best recession indicators are credit spreads, which are not giving a positive signal
To us, the best indicator of a real slowdown remains the Treasury yield curve. This week, the 5-yr yield closed down 20 bps to 1.56%. And the 10-2 year spread ended the week at 117 bps.
- Raoul Pal @RaoulGMI – Well, with the Atlanta Fed at 0.7% and ISM at 48 and the Yield curve <1.20 I think a recession is getting highly, highly likely. odds > 75%
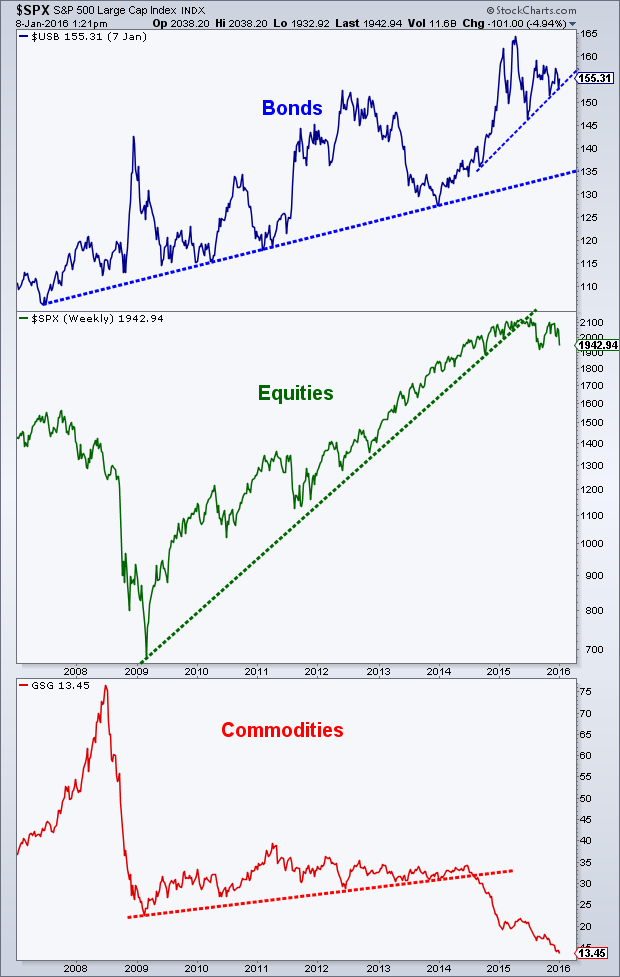
How do asset classes behave around the onset of a recession?
- Andrew Thrasher, CMT @AndrewThrasher – Current trends for the three major asset classes: Bonds, Stocks, & Commodities
Whether the US economy sees a recession type slowdown may well depend on one institution.
3. F-word
We began using the term “F-word” to express our fatigue with the Fed, fatigue that is slowly moving towards disrespect bordering on contempt. That is their doing not ours. They seem determined to invite scorn as this week suggests:
- Bloomberg Business @business – Fed’s Stanley Fischer says predictions of 4 rate hikes in 2016 are “in the ballpark” http://bloom.bg/
That drew a retweet with the response below:
- Northy @NorthmanTrader – on which planet is this ballpark located?
Both Jim Grant and Jim Rickards predicted this week that the Fed will actually cut rates in 2016. The Rickards prediction is based on the Fed raising rates in March & June and then cutting from those raised levels. Grant & Rickards have forgotten more about the Fed than we will ever know but we do know one thing – if the Yellen Fed reverses to ease rates in the 2nd half of 2016 after raising rates twice in the first half, the credibility of the Fed will be shot & buried. Not only for their stupidity but also because they will be blamed for intervening in the Presidential election.
- Ned Davis Research @NDR_Research – 10yr term premium ended 2015 at 0…only time it was this low at start of a tightening cycle was in 1963
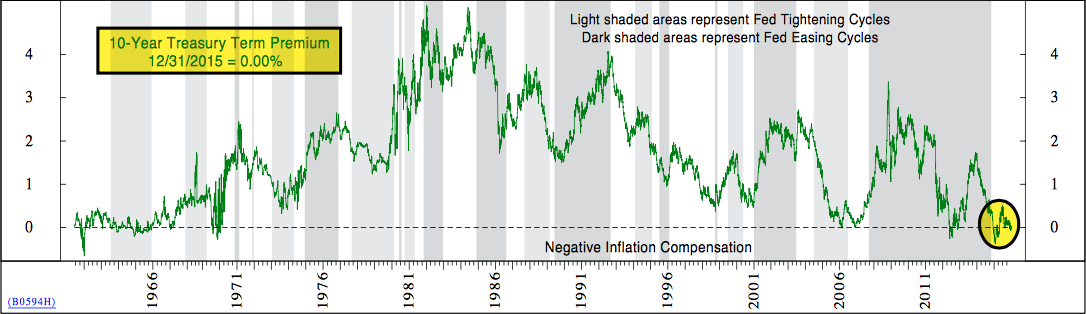
Or is this chart really suggesting that this is the end of a tightening cycle? Meaning the Fed is actually one & done.
4. Treasuries
The clearest call came from:
- Raoul Pal @RaoulGMI – I think the big surprise this year will be the strength of the bond market… 10 years are likely to go to 1.2%
- Raoul Pal @RaoulGMI – $TLT 10 Yr bond yields are a gift. I think this is going to be one of the single best, low risk trades. Buy #bonds
A technical call was from @Couzin_Vinny in his blog TheClosingPrint.com. The charts are best viewed in that article:
- “AGG is the Barclays Aggregate Bond Fund. The fund is used as a benchmark for Bond Fund Managers, therefore we watch this closely for determining our “fixed income” fund exposure (VBTIX). We see a breakout of the recent triangle pattern. MACD is signaling a “resumption” of the bullish trend. Reference the green zone.”
- “TLT is also showing very bullish behavior, after having traded in this range since mid-summer (green area). MACD is moving above zero“
5. Equities
This was the worst start to a New Year ever, we are told. And it felt like it. It was succinctly expressed in Technical Charts in NorthmanTrader.com:
- “Closing Print: $ES closed at the lows of the week which was began with a runaway gap and never looked back. Multiple unfilled gaps below and an RSI of 27.83. This doesn’t happen often and usually not in January, but here it is. OPEX next week.”
We were surprised at the near unanimity of bearish calls & predictions that were issued this week. UBS, Merrill Lynch, JPMorgan issued “sell rallies instead of buying dips” calls. Several technicians issued calls that said watch for 1900 and if that doesn’t hold then 1870 & 1820 is next. Given the preponderance of bearishness, we feel we must begin with the positive or at least non-negative calls. Next week is Options Expiration and OPEX weeks are known to generate bonfire of the shorts especially when negative positions & sentiment gets extreme.
- Mark Arbeter, CMT @MarkArbeter – Usually when some technicians (me) start rolling out the bearish weekly/monthly charts, you get a counter trend rally. #yearsofcharting
- Joe Kunkle @OptionsHawk – Close near the lows best thing for the market, open lower Monday, test 3 year trend support near 1,920 and see if anything constructive
- DK1 @canuck2usa – $COMP $SPY $SPX all got the .786 smackdown near the close this doesn’t hold the Sept/Oct lows next
A chart from some one with a terrific recent track record of calls:
- Mella @Mella_TA – $SPX roadmap update

- Peter Ghostine @PeterGhostine –Russell 2000 chart is one of a dozen charts sent out to subs this morning, suggesting the end is near. http://www.61point8.com/Portals/0/article%20images/20160108/20160108RUT2.png …
Two charts with the same message:
- Charlie Bilello, CMT @MktOutperform – S&P 500: down to 17% of stocks above their 50-day moving average, firmly in oversold zone where bounce odds increase

chart
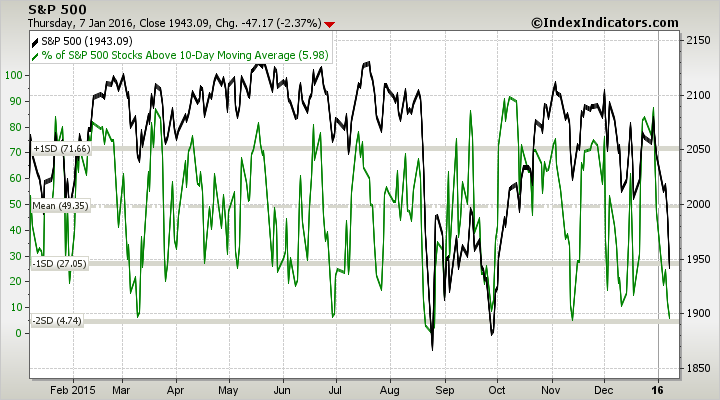
- Charlie Bilello, CMT @MktOutperform – .@MktOutperform On a similar note, % of stocks above their 10-day MA down to 5%, oversold, increasing bounce odds
A price dependent analysis:
- Dana Lyons @JLyonsFundMgmt – (Post) Broad Stock Market Index At “Must Hold” Level – via @YahooFinance $NYA http://tmblr.co/Zyun3q1-WL3L4
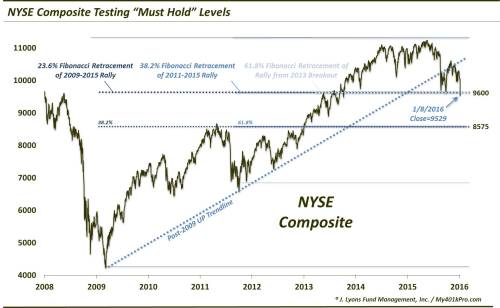
- “What are the ramifications of losing this level? First off, it opens up the next major downside level around 8575, which is another 10% of risk from here. Additionally, it would set a lower low on the chart. The NYSE has already established a lower high, so this would suggest a downtrend is in the works (and, potentially a bear market).”
- “… we would not be surprised to see the level hold again, temporarily, producing a smaller bounce than the post-September version before eventually failing as other indices are doing. But that is just speculation, so don’t “hold” us to it”
Now we turn to the Bears. The boldest is the call from Keith McCullough of Hedgeye which reads The US Stock Market Is Going To Crash.
- “The US stock market has never NOT crashed (i.e. a 20% or more decline from peak – that would get you 1704 SPX from the 2130 #bubble high) when corporate profits go negative for 2 consecutive quarters,”

Would half the decline of 2000 & 2008 declines be still called a crash? If so, then Tom McClellan is definitely calling for one in his Stock Market Committed to 2008 Scenario article.
- “In a Dec. 11, 2015 Chart In Focus article, I posed the rhetorical question about whether the market was reliving its past from 2012, or from 2008. The financial panic in China seems to have settled the question for us, and the market has decided on the 2008 scenario“
- “Whatever may be the real driver of price movement physics, we are seeing the market turn down like it did in January 2008, and not turning up like January 2012. So the presumption is that we are in for a bear market year. It does not have to be of the magnitude of 2008, or 2001-02, but a downward trend is still what is upon us“
- “From this week’s chart, the 2008 pattern shows a short term bottom due right now, a sideways pause, and then a further decline later into January“
Louise Yamada called this week’s decline as “start of something significant” on CNBC Futures Now:
- “November rally failed; China a catalyst for an already weak market; Dow could fall below 16,000 shortly; could see rally but not above 17,000; death cross on monthly happening for the first time since 2008; could pull back to 14,000 & 1600 for S&P = where the breakout occured in 2013; we see leaders giving up; something more significant; next month with 16000 & 1900 ; then 1800 & then 1600″
Marc Faber said on BTV that he expects stocks in the US to decline 20-40% from their peak of 2134.
The Sell Rallies calls of this week:
- Mislav Matejka of JP Morgan on CNBC FM – go from buying dips to selling rallies; equity market will struggle for next 12-24 months; weight of US stocks in portfolio = 5%; Sell all rallies; no place to hide, not even Japan
- Steve Suttmeier of Merrill Lynch on CNBC FM – Sell rallies; S&P stuck in a trading range; technical headwinds; market under distribution; but 1965 needs to be broken to say top is in place; if 1965 broken, then 1870-1820 gets tested
- Rich Ross on CNBC FM – problem is China; strong correlation of yuan to S&P; Crude oil; & to Transports; Sell rallies; retest of 1900 likely; if it breaks then get to 1670 (235 points below 1900 = up 235 to 2135 high); also 150-week moving average to 1900= neck of a two-year pattern
- Chris Verrone – CNBC Power Lunch – this is sell the rally market; can’t get a bottom so close to (5% away from) top; watch 1990 – if that breaks, we could test Aug-Sept lows of 1860-1870
The most detailed Sell Rallies call came from:
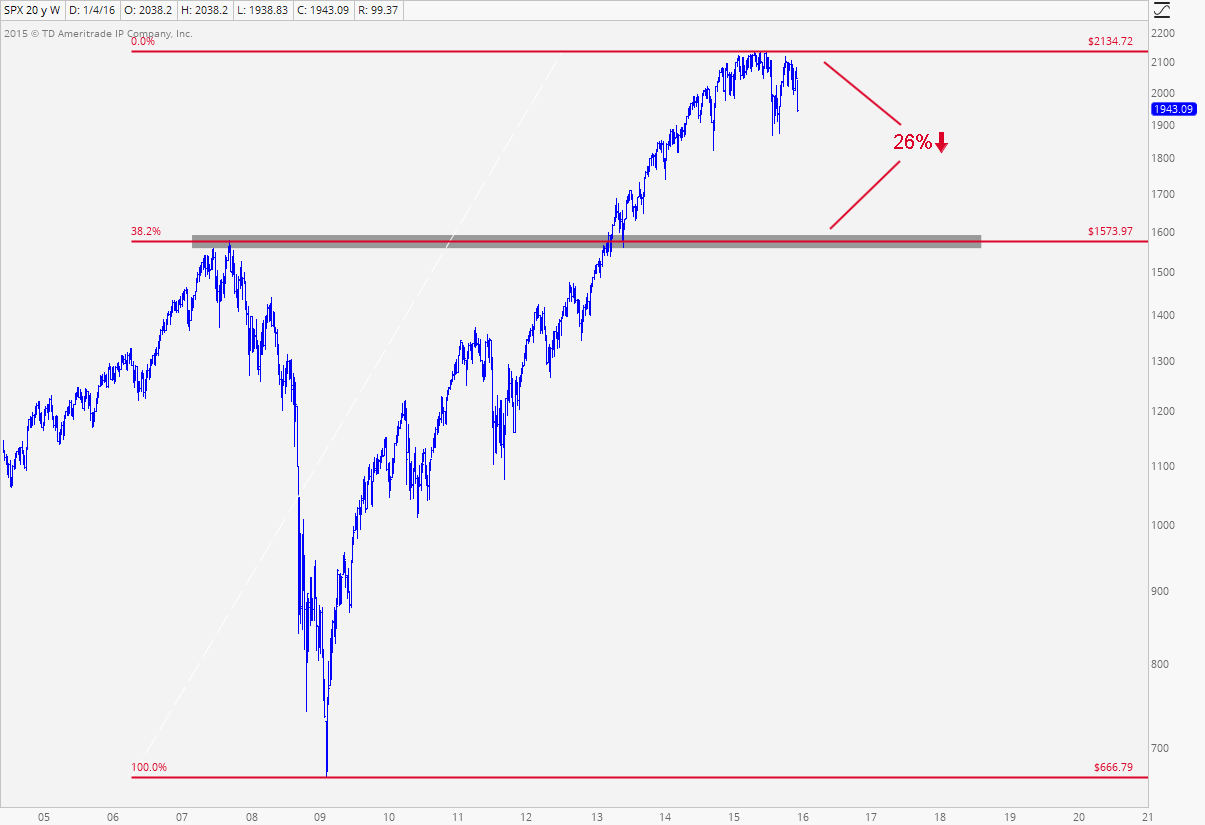
- J.C. Parets @allstarcharts – ICYMI – 20% more downside coming in S&Ps. Still a ‘fade strength’ environment from any intermediate term perspective http://allstarcharts.com/20-downside-coming-sp500/ …
- This is a “sell rallies” market, not a “buy the dip” environment. … Here is a very clean chart of the S&P500 going back to the highs in 2007. That level also represents the 38.2% Fibonacci retracement of the entire 2009-2015 rally. I still think that’s where we’re headed – 1570. That would represent a 26% correction from the top and would be extremely normal and realistic for 2016.
- Now, do we want to be aggressively putting on more short positions right here today? No, I think that would be irresponsible …
- Moving forward we want to continue to sell into any and all strength, particularly towards 2040, which is the big number we’ve been harping on to be short below since last Summer.
- This is what I am expecting going forward. 1820 is the next level of support and I think we get there pretty quickly. I would be really surprised if we didn’t get some sort of reaction bounce from that level and we want to be covering tactical short positions at those lows. After some backing and filling, I think we ultimately break to fresh multi-year lows and we correct 26% in total from top to bottom. Simple as that
5. Dollar, Gold, Oil & Emerging Markets
According to the WSJ article:
- Mr. Gundlach said managers at the firm this week bought nondollar bonds for the first time since 2011. “It was a large number, a basket. Not a rifle shot, a wide net,” he said. The bet reflected a view that the dollar wouldn’t continue to rally.
Kevin O’Leary of CNBC Shark Tank also said that the Dollar had peaked. May be that is also reflected in the sharp rally in Gold & Gold Miners this week. Gold & GDX were up 4% & 4.6% resp. Tom McClellan said on CNBC that Gold should rally into the end of January. But he didn’t think this was a major new up leg in Gold. On the other hand,
- Mark DeCambre @mdecambre – Oil hasn’t been this cheap relative to gold in almost 30 years via @wlwatts http://on.mktw.net/1OS1qJ8

And seasonality is becoming favorable to Oil:
- Charlie Bilello, CMT @MktOutperform – I know you’re not supposed to say anything positive about Crude, but best months on avg (last 25 yrs) are Feb-Apr
Bear Trades Report recommended a purchase of USO, OIH & XLE on Friday. Larry McDonald reiterated this buy arguing that extreme of capitulation is evident in USO. All he is calling for is a bear market rally.
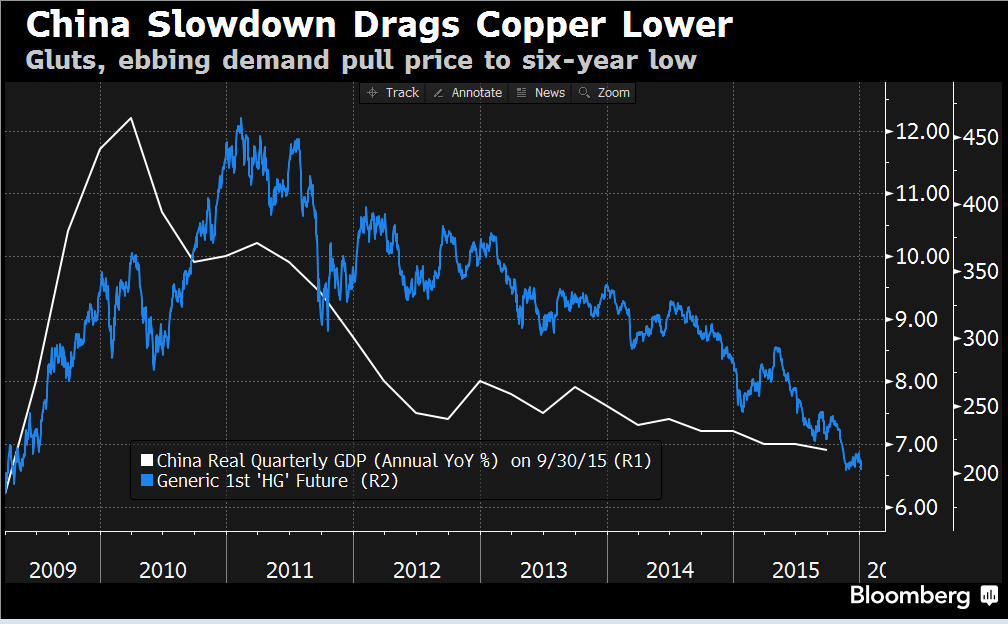
If Gold & Oil are buys, what about Copper?
- Thomas Biesheuvel @tbiesheuvel – $2 copper still too expensive? http://bloom.bg/1ODl0qF @JoeDeaux
After what most have endured this week, the following classic seems appropriate for next week: .

Send your feedback to editor@macroviewpoints.com Or @MacroViewpoints on Twitter