Summary – A top-down review of interesting calls and comments made last week in Treasuries, monetary policy, economics, stocks, bonds & commodities. TAC is our acronym for Tweets, Articles, & Clips –our basic inputs for this article.
Editor’s Note: In this series of articles, we include important or interesting Tweets, Articles, Video Clips with our comments. This is an article that expresses our personal opinions about comments made on Television, Tweeter, and in Print. It is NOT intended to provide any investment advice of any type whatsoever. No one should base any investing decisions or conclusions based on anything written in or inferred from this article. Macro Viewpoints & its affiliates expressly disclaim all liability in respect to actions taken based on any or all of the information in this article. Investing is a serious matter and all investment decisions should only be taken after a detailed discussion with your investment advisor and should be subject to your objectives, suitability requirements and risk tolerance.
1.Fed at it again!
Last week, Chair Yellen & the FOMC sounded all dovish, so dovish that you had to wonder whether a deal had been struck between Fed, ECB and China so that China would stabilize the Yuan and Fed would not raise rates. The Dollar fell by over 1.4% and risk assets rallied hard.
Guess that was so last week. Because, almost simultaneously on Wednesday & Thursday, Fed heads began speaking aloud about a rate hike in April and China devalued the Yuan by most since early January. The Dollar jumped up by 1.3% this week. In confirmation of the Dollar win, Gold had the worst week of 2016. Gold Miner ETFs, GDX & GDXJ, fell by 6% and Gold fell by 3%. Oil & Oil stocks fell by 3-4%. And the 30-5 year spread flattened by 6 bps this week.
Are the Fed heads being real or are they simply speaking to restore at least some of the credibility they lost last week? Is it the latter because the Atlanta Fed downgraded its forecast for Q1 real GDP growth to 1.4% from 1.9%.

But when has the Fed really based their decision on GDP? The only data they seem to look at are jobs numbers and the big one comes next Friday. Actually, the only crucial factor for the Fed is the health of the stock market. And if that looks weak into the Fed meeting in April and if the U.S. Dollar remains strong, then the Yellen Fed is likely to punt again.
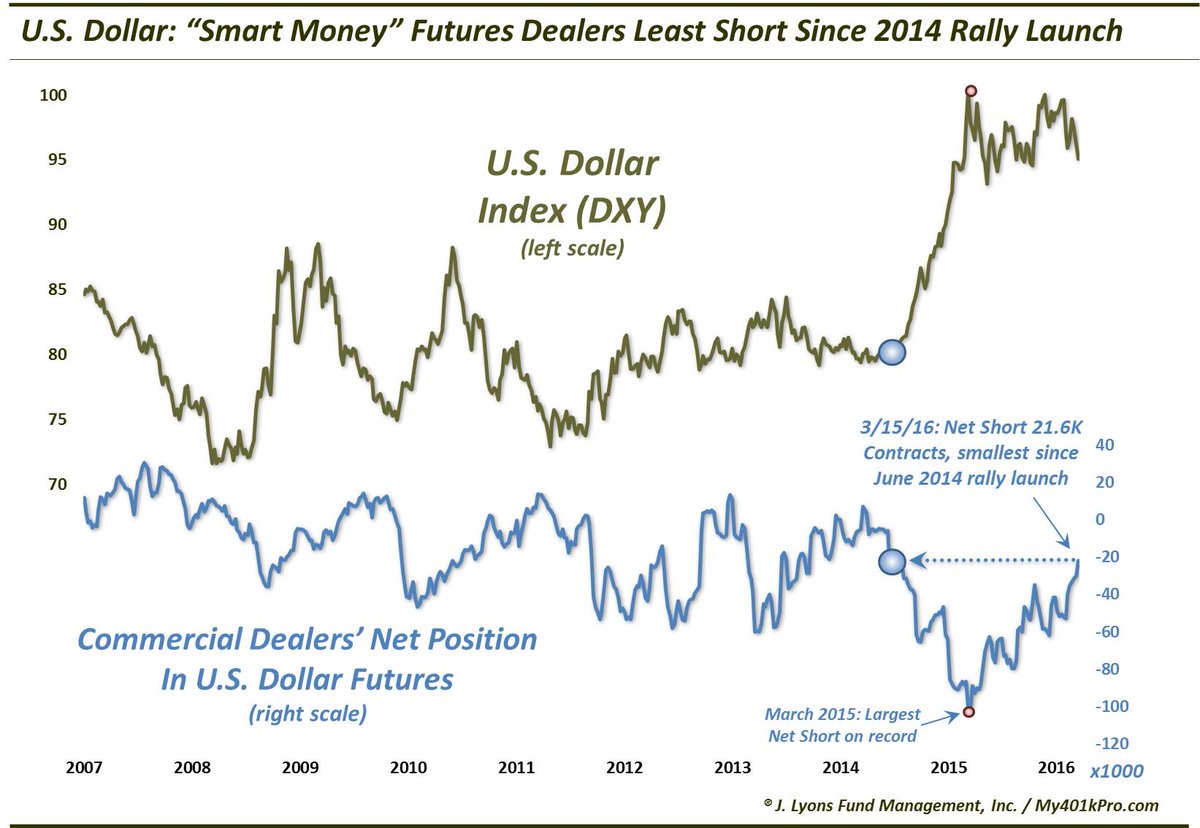
But will the Dollar remain strong?
- Dana Lyons @JLyonsFundMgmt – ChOTD-3/21/16 U.S. Dollar: “Smart Money” Futures Dealers Least Short Since 2014 Rally Launch $DXY $UUP
2. Stocks.
A number of people we follow suggested tightening up last week when the S&P closed at 2050. They proved right this week. But was this week a consolidation of the up move or a recoil from a local top? Thursday was positive in that the S&P bounced from 2022 and closed above 2035. And next week is month-end & quarter-end, normally a period for markups.
- Scott Redler @RedDogT3 – A $spx 30 handle pull in from highs to hold the 21 day is far from a crash &I still deemed constructive.
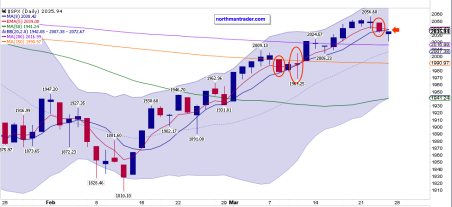
Others like the gang at CNBC Futures Now are less sanguine looking for 2,000 to end the month. Some like Northmantrader.com point to weekly charts to express caution:
- “Closing Print: 3 red candles in all of March so far. US markets remain one directional as, independent of all global stock markets selling off 0.5%-1.5% on Thursday, US stocks closed green yet again. … However $SPX closed below its daily 5EMA and 8MA:”
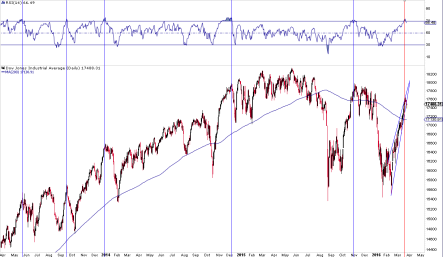
$DJIA RSI study:
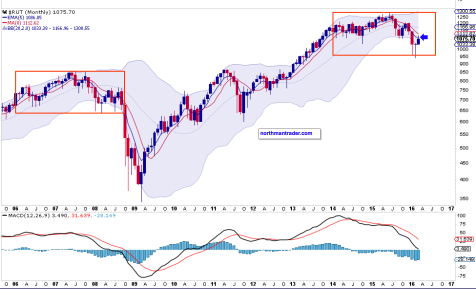
$RUT uh oh:
We know the level of sentiment is important. But is the speed of the turn in sentiment important as well? Yes, argues Tom McClellan in his Too Fast of a Sentiment Swing article:
- “The latest numbers out of Investors Intelligence show that bulls are now up to 47.4% in their survey of newsletter writers and investment advisors, and bears are now down to 27.8%. That takes the bull-bear spread up to its largest value since August 2015, and higher than the peak seen at the November 2015 price highs.”
- “On its own, the bull-bear spread is not yet at a super-high level which would mandate a price top. But there is additional information in the rapid nature of the change in that spread. When the bull-bear spread changes rapidly in a short amount of time, that can sometimes be more important than the actual level to which the spread moves.”
- “Here is a chart showing the 4-week change in the bull-bear spread:”
- “When it goes outside of +/-20 percentage points, it says that sentiment has changed too quickly, and thus an exhaustion event is happening. Following the exhaustion event should be a rest period lasting a few weeks, to restore balance to The Force. It is hard to keep a move going after this indicator posts this sort of rare and extreme reading. It is much more sustainable when excessive bullishness or bearishness develops more slowly.”
- “The much more common interpretation has been that a reading above +20 is a sign of too much eagerness, and that a corrective period is needed to set up for whatever is next.”
An interesting discussion came this week from James Paulsen of Wells Capital Management. He used the term “bunny market” to distinguish current state from a bull or bear market.
- “Most bunny markets occur in the latter part of an economic recovery. Stocks initially recover aggressively after a recession. However, as the recovery matures, cost-push pressures, inflation, and higher interest rates begin to pressure the bull market. This often resolves into a bunny market for the balance of many economic recoveries.”

Bunny markets are the consolidation periods between dotted horizontal lines in the graph above and the gray bars are recessionary periods.
- “Buy-and-hold (bull market) or sell-and-avoid (bear market) strategies are not successful during bunny markets. Rather, the market becomes a trading opportunity where timing becomes paramount.”
- “As illustrated in the Exhibit, the bunny market can persist for years “between” the bull and the bear.”
So why is current market a “bunny” market:
- “For several reasons, we believe U.S. stocks recently entered a bunny market. First and most importantly, we think U.S. recession risk remains low and if the economic recovery is not ending anytime soon, a sustaining bear market is unlikely. … None of the traditional economic policies currently signal elevated recession risk.”
- “Second, in our view, an enduring solid bull market is also unlikely. The stock market faces several vulnerabilities during the rest of this recovery. … “
3. Gold
Gold & Gold Miners had an asymptotic rally a couple of weeks ago and traded in a range after that rally. This week, the action changed and Gold suffered its worst decline for the year. So what’s next?
- J.C. Parets @allstarcharts – seasonally this is the worst time of the year for Gold $GC_F $GLD
And,
- Ned Davis Research @NDR_Research – Mar 23 – Two bearish short-term indicators on $gold. Excessive optimism & smart money positioning. #NedsInsights
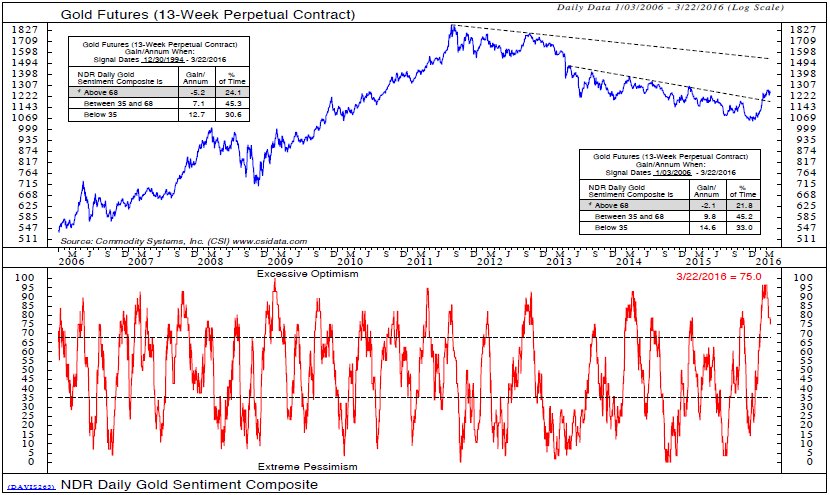
Zev Spiro,CEO & Chief Market Technician of Orips Research, agreed on CNBC that while “indicators are generally positive on the daily, weekly and monthly charts“, current readings are slightly overbought on the weekly chart. … Therefore, a continued consolidation may occur before [we see] higher prices“.
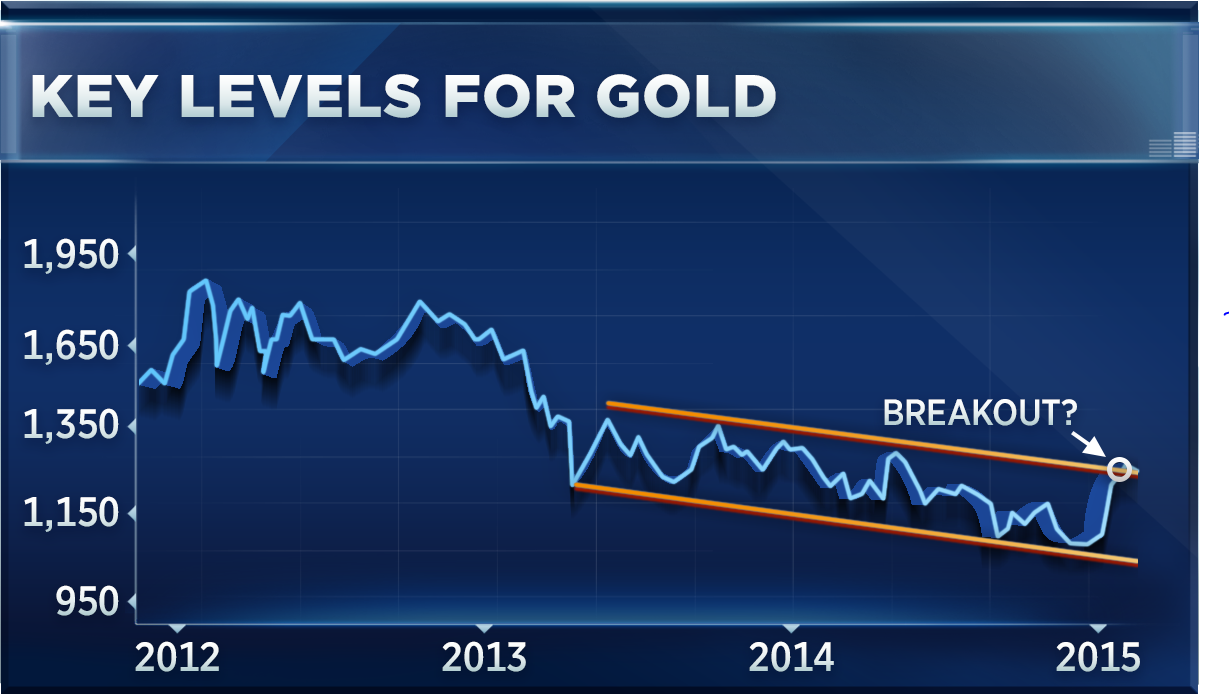
And how high could prices go? Spiro said “a break above key resistance earlier this month could send bullion catapulting as high as $1,450“.
4. Oil
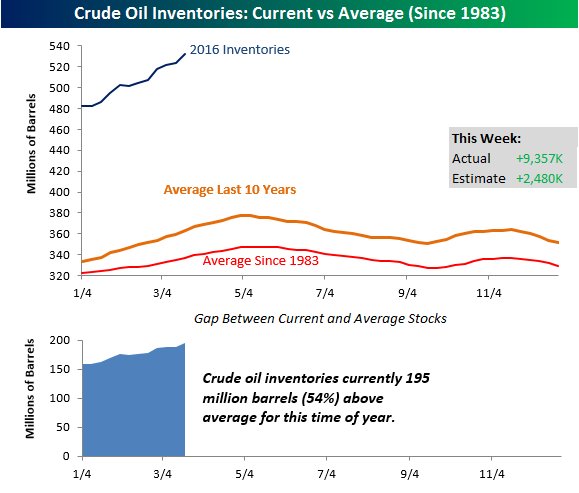
The Rig count fell by 15 to 372 this week but inventories jumped:
- Bespoke
@bespokeinvest – The build in crude oil inventories never ceases to amaze.$USO$XLE https://www.bespokepremium.com/think-big-blog/crude-oil-inventories-surge/ …
Last year, Ari Wald of Oppenheimer described the Oil & Energy boom as being similar to the Financial bubble of 2008. This week we saw this:
- Nautilus Research
@NautilusCap – Key juncture for Energy….$XLE$uso

Send your feedback to editor@macroviewpoints.com Or @MacroViewpoints on Twitter