Summary – A top-down review of interesting calls and comments made last week in Treasuries, monetary policy, economics, stocks, bonds & commodities. TAC is our acronym for Tweets, Articles, & Clips – our basic inputs for this article.
Editor’s Note: In this series of articles, we include important or interesting Tweets, Articles, Video Clips with our comments. This is an article that expresses our personal opinions about comments made on Television, Tweeter, and in Print. It is NOT intended to provide any investment advice of any type whatsoever. No one should base any investing decisions or conclusions based on anything written in or inferred from this article. Macro Viewpoints & its affiliates expressly disclaim all liability in respect to actions taken based on any or all of the information in this article. Investing is a serious matter and all investment decisions should only be taken after a detailed discussion with your investment advisor and should be subject to your objectives, suitability requirements and risk tolerance
1. “Interest rates are impervious to fundamentals” – But what’s a fundamental?
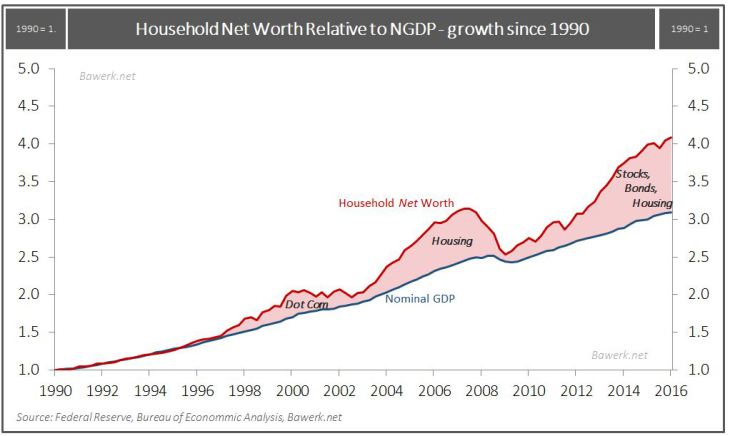
The adjective “fundamental” is defined “as forming a necessary base or core; of central importance” and the noun “fundamental” is defined as “a central or primary rule or principle on which something is based”. And they both serve to describe the only fundamental in today’s markets – more & more liquidity from DM central banks. Continuation of liquidity injections is the central & primary factor on which all markets rest at this time. And rest precariously, we might add based on the chart below from Jeff Sandene of @Marathonwealth:
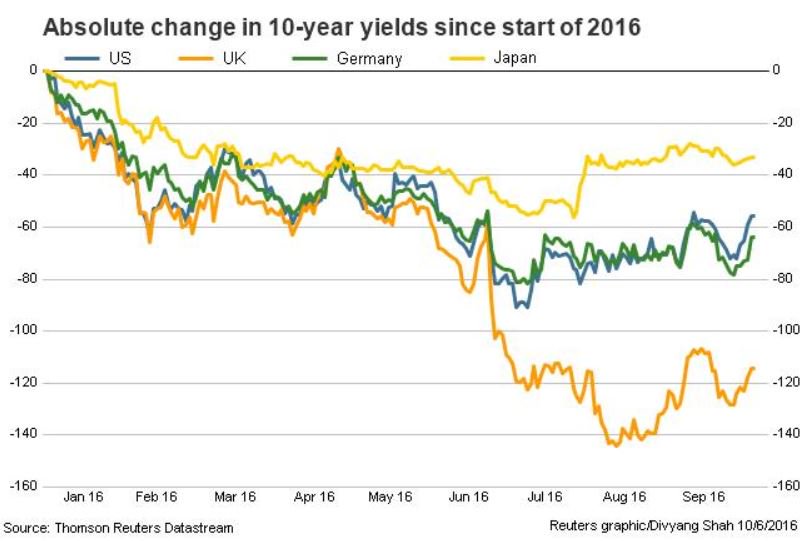
But Rick Santelli was not speaking of the above true “fundamental” when he made the “impervious” quote above. At that time he was perhaps under the influence of his friend, CNBC’s Steve Liesman, and used the term to mean jobs, economy and stuff like that. Because with a payroll report of 156,000 vs. expectations of 175,000 and the oversold nature of the treasury market, we should have seen a stronger rally on Friday. But Santelli was back to his own self on Friday afternoon when he said “fixed income markets are the conscience of everything“. That brings us to Thursday’s chart by Divyang Shah @DShahTR:
The “fundamental” change we are seeing since August 2016 is a slow & steady erosion of investor faith in central banks, especially the craziest central bank governor who has failed despite going nuts on negative rates. We had asked in our “When Pavlov Goes Nuts” article on February 13, 2016, “Mirror Mirror on the wall, who is the nuttiest Pavlov of them all?” We all know the answer – Haruhiko Kuroda of the Bank of Japan. The chart above shows how he is being dissed by his own bond market.
If that wasn’t enough, we heard a rare public denunciation of Kuroda by Nobuyuki Nakahara, the intellectual father of Japan’s QE in 2001. Nakahara ridiculed the recent “Twist” attempt of Kuroda to pin the 10-year yield at 0% and said:
- “They are trying to clean up the mess of negative rates. It’s impossible to do a stupid thing like keeping the yield curve under government control“
Criticism is one thing but it is quite different to say that Governor Haruhiko Kuroda “has ruined his chances of getting a second full term“, as Nakahara did. So all eyes & ears will now be focused on the next BoJ meeting on November 1.
2. Second shoe
The big shoe dropped on Wednesday with absolutely clear comments by UK Prime Minister Theresa May:
- “While monetary policy with super low rates and quantitative easing have provided emergency medicine, we have to acknowledge some of the bad side effects. People with assets have got richer, while people without have not… A change has got to come, and we are going to deliver it because that’s what a Conservative government can do”
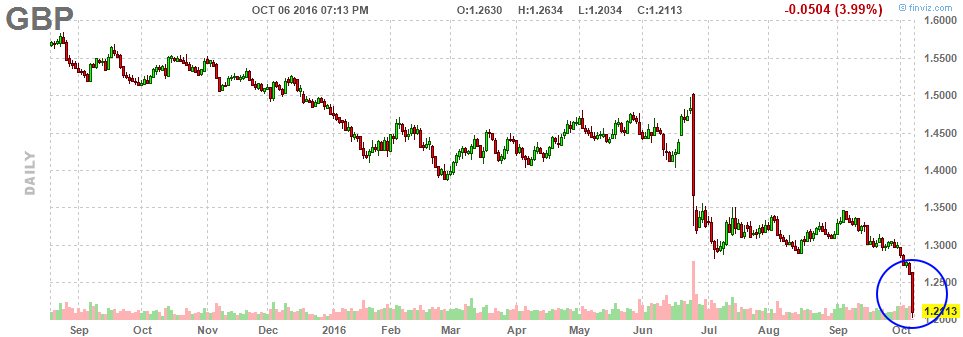
And look what happened on Thursday night – a flash crash in the Pound; a drop of 6% in less than 2 minutes. And the 10-year UK gilt exploded up by 10 bps on Friday & 30-year yield jumped by 8 bps.
Lest we forget, there was talk, quickly denied, at the ECB of a taper of Draghi’s QE come March 2017. No wonder the German 30-year yield rose by 21 bps this week followed by a 15 bps rise in German 10-year yields.
How on earth can Treasury yields react to economic data & other non-fundamentals when the real fundamental is being pulled down?
3. Good & Bad of the Pound flash crash
A really bad way to look at the Pound flash crash is:
- Urban Carmel
@ukarlewitz – The pound just pulled a baht
We won’t focus on that mainly because we don’t want to depress ourselves on a nice Friday evening. So:
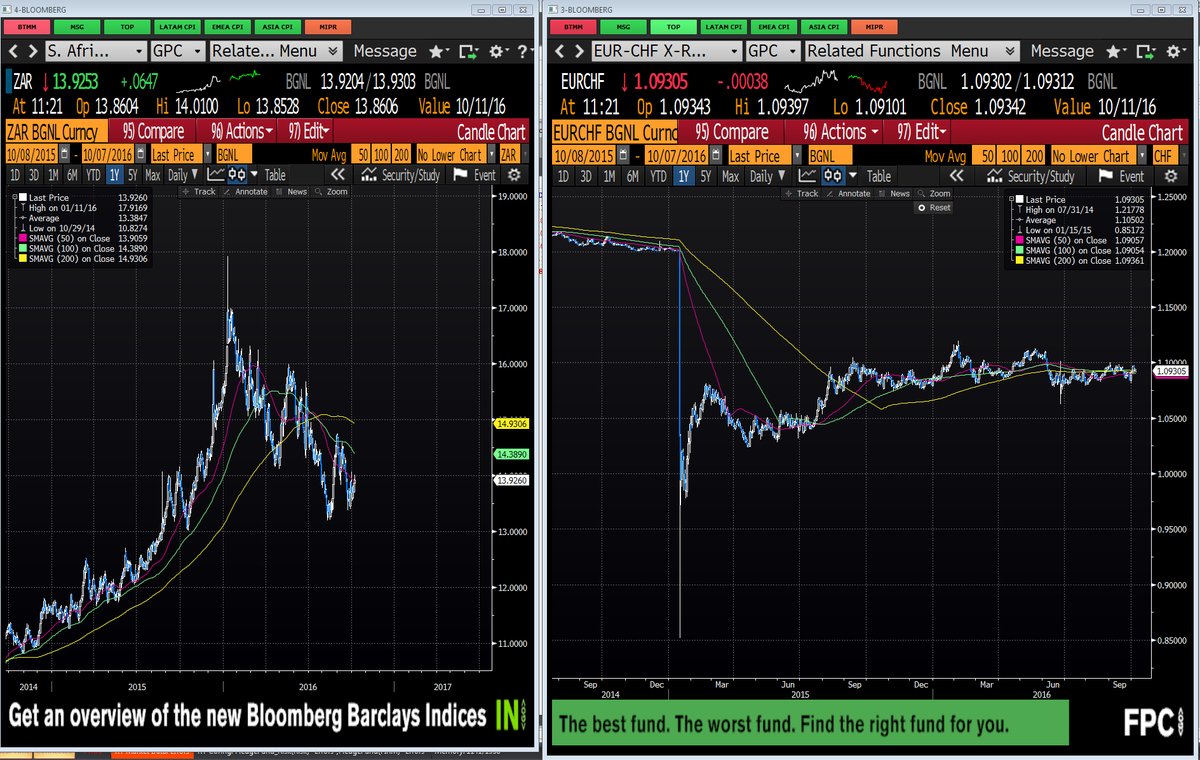
- Macro Kurd @macrokurd – Extreme Flash crashes usually mark the bottom. Two recent examples: USDZAR and EURCHF. #GBPUSD
Same was true of the 10-year Treasury yield flash crash of 2014 & the stock flash crash a few years ago – both proved to be near term bottoms.
4. Gold, Silver & Miners
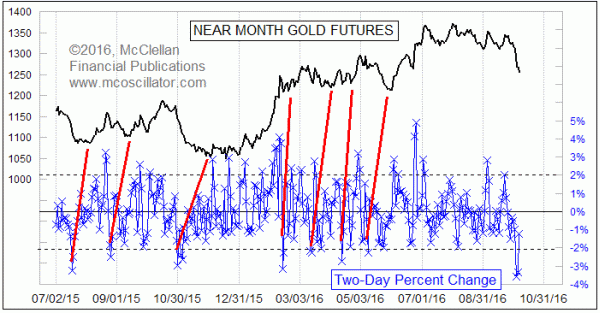
What asset class reacts quickly & vehemently to moves in currencies & interest rates? Well, what should gold do when German 10-yr yield jumps 15 bps & US 10-year yield jumps 12.5 bps on the week because of a threat of liquidity pullout? What Gold did this week – down 4.6% with Silver down 8.6% & GDX, GDXJ down 12.8% & 14% resp. The big drop was on Tuesday followed by a minor bounce on Wednesday and another fall on Thursday. Gold & miners did rally hard for a few minutes post the 156K NFP number on Friday but gave up most of the gains fairly shortly.
So is this drop a buy? Opinions vary of course. Tom McClellan wrote on Thursday that “Big drops over 1 or 2 days typically do not mark the final low for a price decline in gold” and added “this big down move says that we are at the very least several days away from seeing an important final low to this decline.”
On the other hand,
- RR Trades @rr_trades – Both gold and silver are recording perfected daily Demark buy setups today and are near support at 200 dma. #gold #silver $GLD #SLV
An argument based on oversold condition from:
- Charlie Bilello, CMT
@MktOutperform – What Happens When Gold is Oversold? New Post.$GLD https://pensionpartners.com/what-happens-when-gold-is-oversold/ …
Bilello writes:
- “Gold is currently “oversold.” Its 14-period RSI (a technical indicator that can range from 0 to 100, where 0 is maximum oversold and 100 is maximum overbought) is at 27.83. Going back to 1972 (first year off the Gold Standard), this reading is lower than 97% of daily readings. So that’s pretty extreme in a historical context.”
So?
- “Going back to 1972, forward returns for Gold are above average in the following 1 week through 3 months but below average in the following 6 months through 12 months. In all periods, though, the average forward returns are positive.”
5. US Bonds
A pretty bad week across the board in the Treasury curve with the 30-year yield up 14 bps, 10-year yield up 12.5 bps & the 5-year yield up 10.5 bps. But the 10-year yield closed just below Santelli’s critical level of 1.73%.
Yes, the 156K NFP number takes November FOMC meeting off the table and even reduces the chances of a Fed hike in December. Fed Vice Chair Fisher said “jobs report pretty close to Goldilocks“. But a dovish Fed doesn’t really do anything for Treasury yields when BOJ & ECB are expected to reduce QE.
A more serious question for individual investors is:
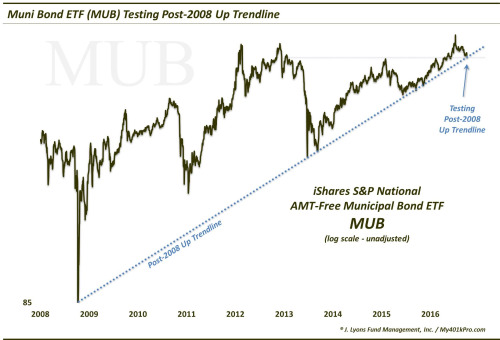
- Dana Lyons @JLyonsFundMgmt – (Post) Post-Crisis Run In Muni Bonds Nearing End Of The Road? – via@YahooFinance$MUBhttp://jlfmi.tumblr.com/post/151410856285/post-crisis-run-in-muni-bonds-nearing-end-of-the …
On the other hand, David Rosenberg wrote on Friday:
- “Worst case scenario for bonds – Well, unless we get a real nasty technical rupture, most of the yield backup is likely behind us“
This sounds reasonable but we all remember the 2013 “taper” talk, don’t we? That “will they, won’t they” babble over 7 months ended up doing more harm than we would have seen had Bernanke simply begun the taper in May 2013 or June 2013. And this time, it isn’t just the Fed but Japan, UK & ECB all in there talking & talking.
6. Stocks
After all the talk about cyclicals & industrials coming in favor, Honeywell & PPG fell in a thud, both down 8%+, on Friday on negative forecasts. What a perfect backdrop to raise interest rates, right?
But the S&P remains stuck leading Lawrence McMillan to remain steadfast:
- “In summary, all of the indicators seem to be rather mixed, awaiting some direction from $SPX. For now, we remain neutral on the market, awaiting an $SPX breakout from this tight trading range”
But what to do if the S&P does indeed suffer a fall? One view is:
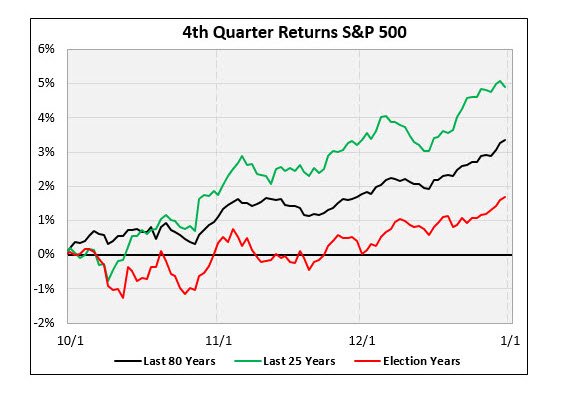
- Schaeffer’s Research
@schaeffers – Why You Should Buy Pre-Election Stock Market Dips http://www.schaeffersresearch.com/content/analysis/2016/10/03/why-you-should-buy-pre-election-stock-market-dips?utm_source=SM&utm_medium=Link&utm_campaign=Twitter …$SPY
On the other hand, Savita Subramaniam of BAML finds the market “scary” mainly because of valuation & because they see a recession in America in 2nd half of 2017. No wonder the FOMC is so eager to raise rates to enable them to lower them again next year!!!
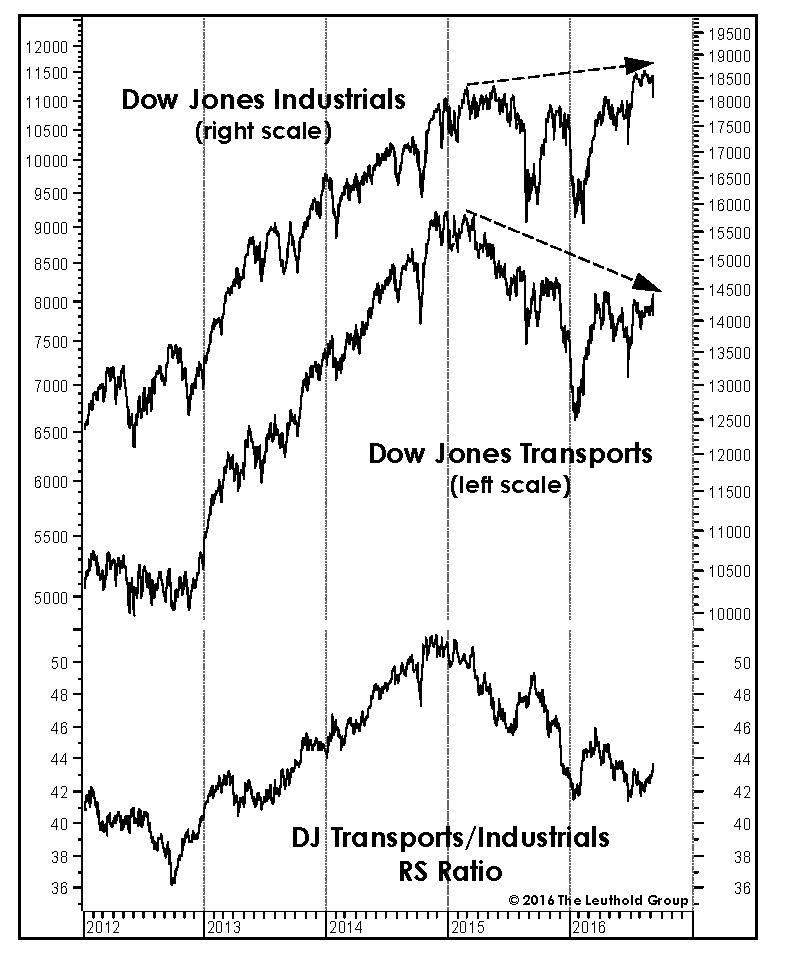
Honeywell & PPG took care of the industrials on Friday. What about the other cyclical sector that is doing so well?
- The Leuthold Group @LeutholdGroup – Oct 4 – $DJT relative strength is a big concern. Only 2x since 1929 did #Transports make new #RS high concurrent with $SPX peak. $DJIA #Stocks
7. A perfect indicator for last 75 years
- Ryan Detrick, CMT
@RyanDetrick – Since ’40, when a 2nd term President if SPX is up (incumbent party) or down (challenger) from Aug-Oct has never been wrong. Currently -1.2%.
Talk about a close election!
Send your feedback to editor@macroviewpoints.com Or @MacroViewpoints on Twitter
