Summary – A top-down review of interesting calls and comments made last week in Treasuries, monetary policy, economics, stocks, bonds & commodities. TAC is our acronym for Tweets, Articles, & Clips – our basic inputs for this article.
Editor’s Note: In this series of articles, we include important or interesting Tweets, Articles, Video Clips with our comments. This is an article that expresses our personal opinions about comments made on Television, Tweeter, and in Print. It is NOT intended to provide any investment advice of any type whatsoever. No one should base any investing decisions or conclusions based on anything written in or inferred from this article. Macro Viewpoints & its affiliates expressly disclaim all liability in respect to actions taken based on any or all of the information in this article. Investing is a serious matter and all investment decisions should only be taken after a detailed discussion with your investment advisor and should be subject to your objectives, suitability requirements and risk tolerance.
1.Relief in three doses or front running of Monday?
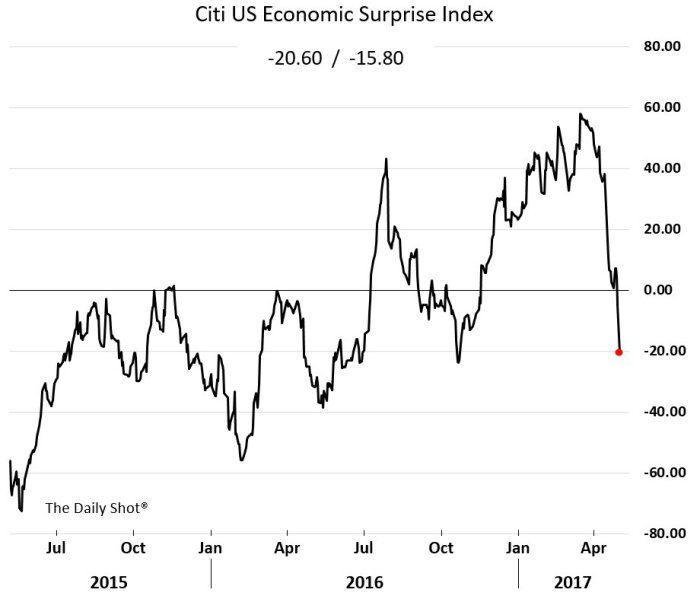
Worries about the US economy were raised last Monday from the drop in the Citi Economic Surprise Index:
- (((The Daily Shot))) @SoberLook – Chart: US economic surprise index –
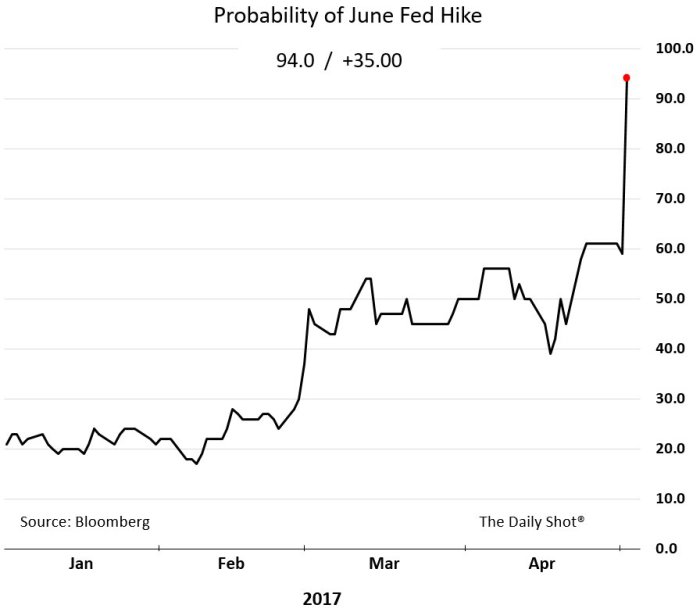
 Wednesday’s FOMC statement proved to be the first dose of relief for such worries. The Fed did what was expected of them – dismissed signs of weakness in Q1 as “transitory” and signaled that June rate hike was on track.
- (((The Daily Shot))) @SoberLook Chart: Market-implied probability of a June Fed rate hike
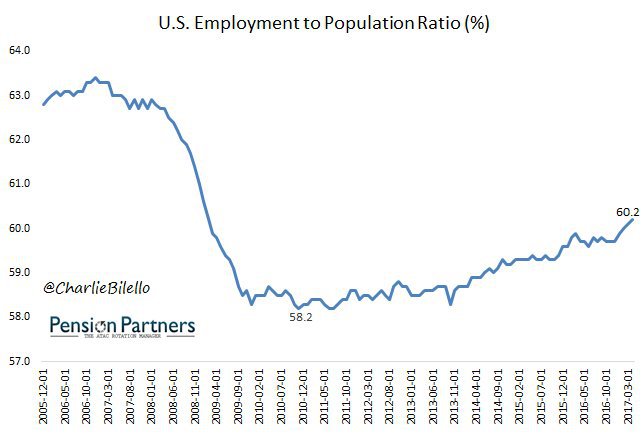
 The House passing their version of the Obamacare Repeal & Replace bill was the 2nd shot of relief. It showed that the Trump Administration was on track of delivering on legislative action. The 3rd shot was the higher than expectations NFP number of 211,000. Some like David Rosenberg termed the strength as “classic late cycle development“. But, late or otherwise, it did reflect strength.
- Charlie BilelloVerified account @charliebilello – US Employment to Population Ratio hits a new expansion high, 60.2%. Highest since February 2009. #Payrolls
 These three shots enabled the stock market to close up 88 bps on the week at new all-time highs in S&P and Nasdaq. But the bulk of the week’s advance in the Dow and S&P came in the rally into the close on Friday afternoon. So were the above three shots of relief were merely steps & was the Friday afternoon rally mainly front running the expected rally on Monday post the Matron victory?
Strategists like Jeff Saut of Raymond James described the market’s “internal energy” as “nearly spent” on Friday morning. Another but similar way to describe the current condition came from Lawrence McMillan of Option Strategist on Friday:
- “In summary, the bulls continue to await the upside breakout. However, the bears are still in this game. If $SPX closes below support, a test of the March lows would be in order. So, once again we await confirmation from $SPX before a move can be “certified,” and that confirmation has been very difficult to come by since mid-March”.
2. Liquidation >> an end to Commodity carnage?
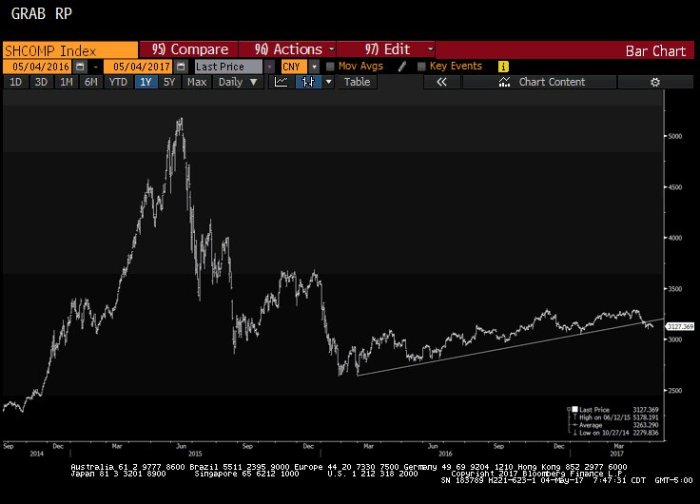
The much bigger & far more interesting story of the week was the carnage in commodities from Industrial metals like Copper to Gold & a continuous decline in Silver and the vertical looking crash in oil. One obvious cause was the Chinese mess:
- Raoul Pal @RaoulGMI Whilst you were watching
#oil break down, just note that Chinese A shares have broken a huge trend line…
 But the velocity and scale of the fall (esp overnight pre Friday morning) suggested a large liquidation. And presto, it was revealed on Friday that “Pierre Andurand, who runs one of the biggest hedge funds specialising in oil, liquidated the fund’s last long positions in oil last week”. Almost predictably, oil bounced 2%+ on Friday and so did metals, base & precious.
An oil fund’s liquidation doesn’t explain the record of 14 straight days of decline in Silver that also ended on Friday. One technician (who proved correct in dismissing oil bounce as a trap a few weeks ago) found something to like in the vertical fall in Silver. May be his sharp eyes can see silver as a fallen knife vs. a still falling knife. Any way, Carter Worth of CNBC Options Action said Go Long Silver on Friday afternoon.
(from minute 2:50 to 5: 58)
Those who are interested in a detailed discussion of what might go wrong in China in the near future should listen to Kyle Bass in the clip below.
Kyle Bass sounds convincing as always in the above clip. But if the crisis were so near, wouldn’t we see some signs in credit markets?
3. Credit & Treasuries
One sign could be:
- StockBoardAsset @StockBoardAsset The most important chart for 2017 just got scary
But that doesn’t suggest imminent danger, only a steadily worsening condition. The two biggest safe havens from a credit crisis actually went down this week. The Dollar fell by about 45 bps and the Treasury curve rose in yield by about 5 bps on average with a 3 bps flattening in the 30-5 spread.
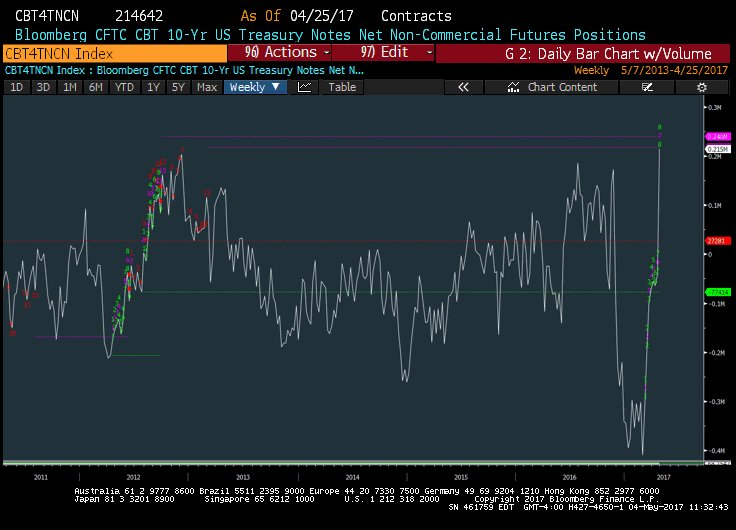
The bigger problem for Treasuries might be the bad positioning of large speculators. The large short positions have all been liquidated & the positioning is now long.
- Mark Newton @MarkNewtonCMT VERY RAPID sentiment shift in TY market as Specs went from record net shorts in mid-March. just as bonds were bottoming.. to long now. hmm.
4. Stocks
Something interesting happened on Friday:
- Urban Carmel @ukarlewitz –
$Vix up 4% +$Spy up 0.3% + it’s Friday = Something you don’t see very often
What is something else you don’t see often?
- J.C. Parets @allstarcharts Both NYSE and Nasdaq Confirmed Hindenburg Omens yesterday. Rare when both of them do it. I haven’t seen good things happen after this occurs
What worries one makes another feel good.
- Ryan Detrick, CMT @RyanDetrick – Would be fitting for a new all-time high on the
#SPX as the “Hindenburg Omen” talk heats up. Been a great contrarian signal the past yr.
Is there a signal to suggest which way the S&P might go?
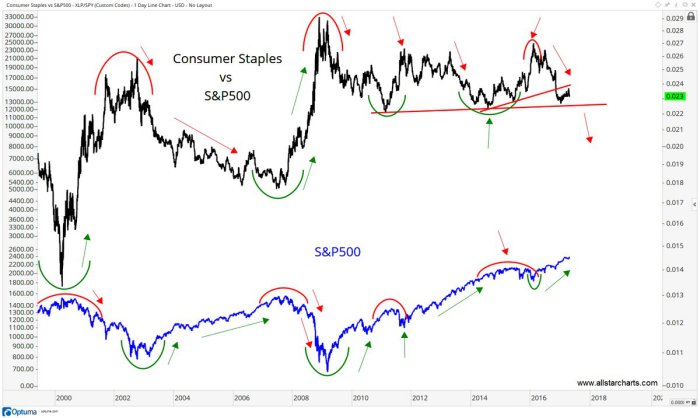
- J.C. Parets @allstarcharts Chart Of The Week] Is This The Most Bullish Chart On Earth? http://allstarcharts.com/?p=62
502
The concept as we understand it is simple – in a robust cyclical advance the S&P would outperform XLP, the consumer staples ETF. So watch the ratio XLP/SPY to get a signal of market strength.
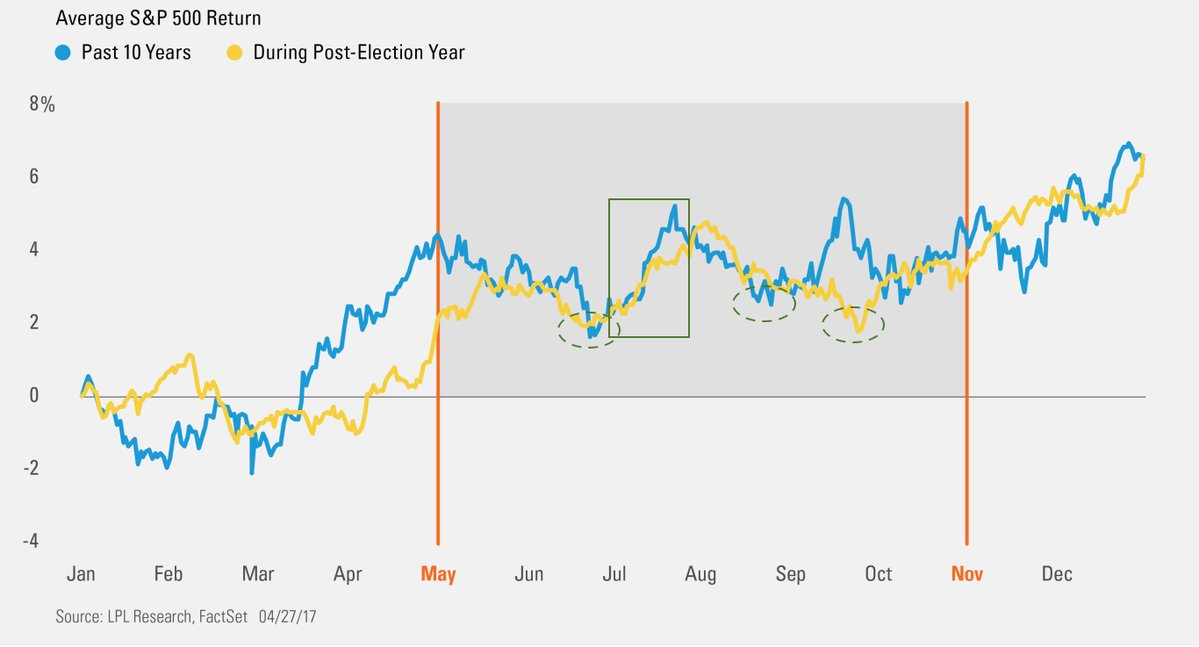
What about seasonals?
- Urban Carmel @ukarlewitz Typical summer pattern: weakness into a June low sets up a good July gain; then a 2nd low in Aug-Sept sets up a YE rally $SPX (from LPL)
What about a near-term target for the S&P?
- Peter Ghostine @PeterGhostine –
$SPX revised target to 2422 by Tuesday of May options expiration.
Send your feedback to editor@macroviewpoints.com Or @MacroViewpoints on Twitter
