Summary – A top-down review of interesting calls and comments made last week in Treasuries, monetary policy, economics, stocks, bonds & commodities. TAC is our acronym for Tweets, Articles, & Clips – our basic inputs for this article.
Editor’s Note: In this series of articles, we include important or interesting Tweets, Articles, Video Clips with our comments. This is an article that expresses our personal opinions about comments made on Television, Tweeter, and in Print. It is NOT intended to provide any investment advice of any type whatsoever. No one should base any investing decisions or conclusions based on anything written in or inferred from this article. Macro Viewpoints & its affiliates expressly disclaim all liability in respect to actions taken based on any or all of the information in this article. Investing is a serious matter and all investment decisions should only be taken after a detailed discussion with your investment advisor and should be subject to your objectives, suitability requirements and risk tolerance.
1. Yield Curve
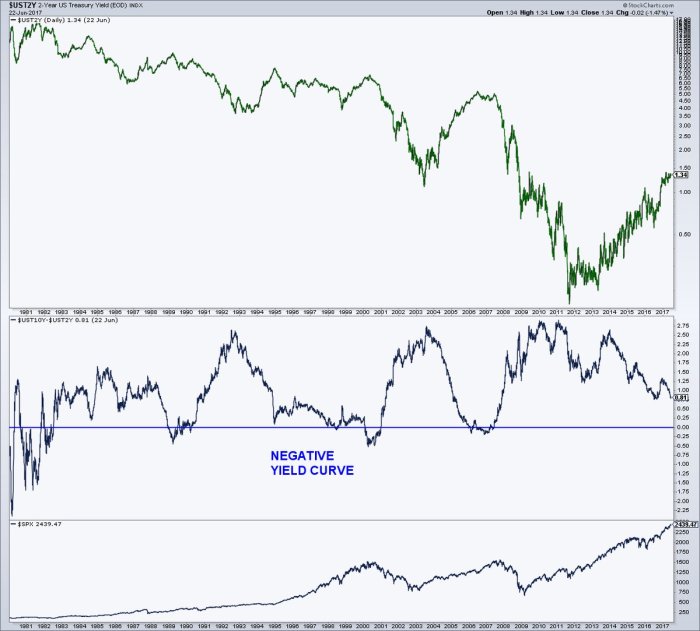
David Rosenberg has said that the Fed matters than just about everything else. And one of the biggest topics of this week has been courtesy of the Fed – the relentless flattening of the yield curve. NY Fed President Dudley was forced to step in to announce that the flattening of the curve was not a big deal and won’t stop the Fed from tightening according to their schedule. Treasury yields reacted for a day on Monday and then the yield curve resumed its flattening. By Friday’s close the 10-2 curve had flattened by 4 bps to 80 bps and the 30-5 year curve had flattened by 8 bps to 96 bps.
The big question is whether this flattening suggests a steady weakening of the US economy or it is the result of Central Bank actions. Jeff Gundlach told Reuters that the flattening would become a concern when 2-year & 3-year yields get almost equal. He also said he doesn’t see any indicator suggesting a recession.
One factor for the flattening is certainly the rate hike of the campaign of the Fed raising the yield of the 2-5 year sector of the curve. But what about the steady erosion in yields in the 10-30 year sector? Is that because the markets are saying the Fed is making a mistake or because inflation is simply disappearing? David Rosenberg wrote this week about the inflation picture – “Fully one-third of the segments of the CPI are now deflating and another half of the index is disinflating …“.
Could that be bullish now as it was on previous occasions?
- Mark Arbeter, CMT @MarkArbeter – Treasury yield curve (10s-2s) 80 basis points and falling. Last times were ’83/’84, mid ’88, late ’94, early ’05. All good times for
$SPX.
Ed Hyman of Evercore ISI is in the same camp. He told BTV Surveillance that the yield curve gives a clear signal when it is negative. While a flattening does signal a slowdown, that was also true from 1996-1998, one of the best times for the American economy.
What does this mean for long duration Treasuries? Vanguard’s Gary Davis told CNBC FM that this makes him positive on duration and Pimco’s Geraldine Sundstrom told BTV that she finds duration attractive as a part of a diversified portfolio but not a screaming buy. Our empirical view is that long rates bottom when the 30-10 year curve reaches 50 bps. That would probably happen if the 30-year yield drops to 2.5% as the 10-year yield drops to 2%.
2. Stocks & Complacency
Two weeks ago we asked whether the 2.5% plunge in QQQ on 105 million shares was a Sudden Reversal or just a Flash Crash? This week’s outperformance by QQQ over SPY (2.1% vs 20 bps) and the action in FANGs points to a flash crash. That also fits in with the empirical tenet that the PE of QQQ tends to correlate with prices of long duration Treasuries. The rally in QQQ & fall in long rates drove down volatility this week and allowed TV folks to argue again that FANGs were sort of a defensive haven in stocks.
This complacency made one smart investor announce publicly that he had raised his VXX position to a 5% weighting. He said “I am feeling now that the complacency is at an absolute high“. Some of his CNBC FM colleagues, notably Josh Brown, pooh-poohed Kevin O’Leary. As we recall, Kevin O’Leary got the same treatment when he was a bit early in selling his positions in banks. Mr. O’Leary did get the last laugh in that case.
As an aside, Jon Najarian does point out in this clip that buying a put spread on SPY would be cheaper & better. But Najarian didn’t spell out what that trade might be.
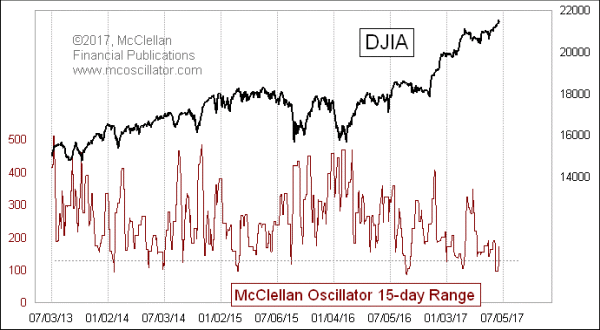
Never short a dull market is an old market dictum. But is there a difference between a dull market and a quiet market? We ask because of what Tom McClellan wrote in his article Narrow Range for McClellan Oscillator:
- A quiet market is one of the hallmarks of a price top, when no one seems to care enough about risk to move the market very much in either direction. The NYSE’s McClellan A-D Oscillator has recently been displaying some of that quietness, trading only a few points above and below zero until just the past couple of days. That quietness in Oscillator readings is telling us something about that very complacency I was talking about.
- … it is the low readings for the 15-day range that I find even more interesting, because they tell us more about what is going to happen, as opposed to what just did happen. These low readings, below around 120 points, seem to give pretty good signals that a price top is at hand. This is similar to several other types of indicators that portray market calmness, such as Bollinger Bandwidth (AKA standard deviation), VIX, and Average True Range. Calmness of prices and investor complacency go together, and usually appear together at market tops.
But as McClellan adds – “A low reading like what we have just seen does not necessarily have to lead to a big price decline“.
If this were not enough Jim Cramer highlighted a bearish prediction of Larry Williams on his Mad Money show on Tuesday:
- Looking at a chart of where decennial forecasts put the Dow Industrials, stocks are heading for a pullback as soon as Friday or Monday. That pullback should be brief, but will forecast a larger move starting in late July, kicking off somewhere between the July 20 and July 25. If the pattern holds, stocks could keep falling through November.
With this bearish consensus from such a collection of luminaries, either a correction is imminent or we see a big rally first. Jeff Saut of Raymond James seems to be in the latter camp because he wrote on Friday -“we continue to think, which is NOT a consensus call, that the SPX is going to move higher because our internal energy models are “calling” for that.”
What event or events could shake the stock & bond markets from their complacency? One such could be a much stronger than expected NFP payroll number on July 7. That would propel Treasury yields higher, perhaps steepen the curve & scare the equity market into selling over-bought sectors.
Another could be a violent geopolitics-driven up move in what has historically determined inflation expectations – Oil.
3. Oil
What seems even more certain than retail stores being wiped out by Amazon? That oil will keep going lower in price towards being virtually irrelevant in the intermediate future. Even the new crown prince of Saudi Arabia is convinced of that, we are told. And so are some chartists:
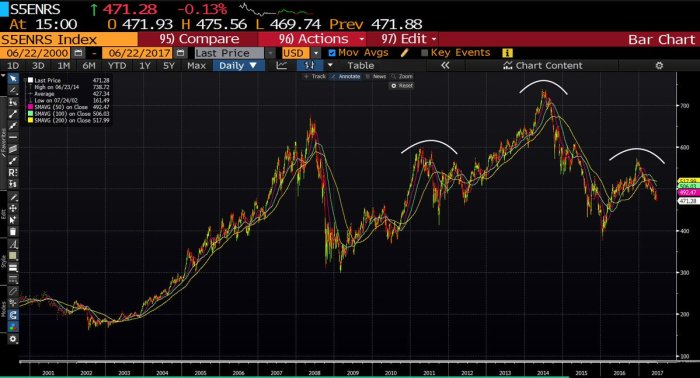
- Green Bird @greenbird89 Massive head & shoulders on a multi-year chart for the S&P 500 Energy Index. @RaoulGMI@jessefelder$OIL$XOP$CL#OOTT
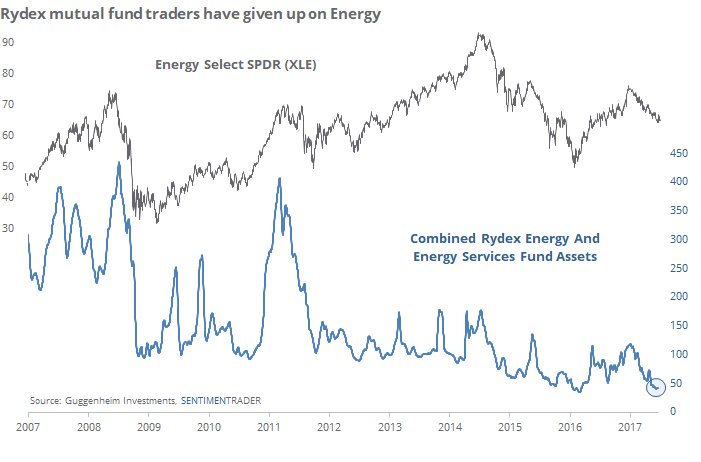
Oil was down another 4% this week, the fifth consecutive week of declines. What has that done to sentiment towards oil stocks?
- SentimenTraderVerified account @sentimentrader – June 22 – Rydex mutual fund traders have had less confidence in energy shares only once in the past decade – February 2016. $xle
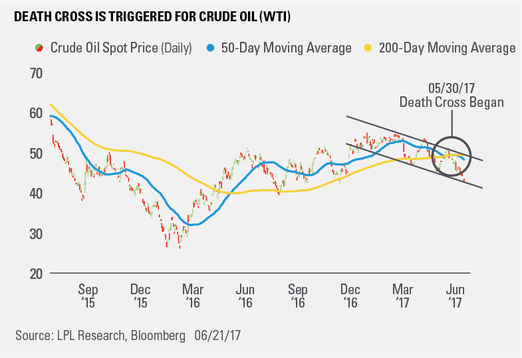
And Oil (WTI) has experienced the feared Death Cross. But what does the Death Cross mean for Oil? A piece from LPL Research sees something positive in the Death Cross:
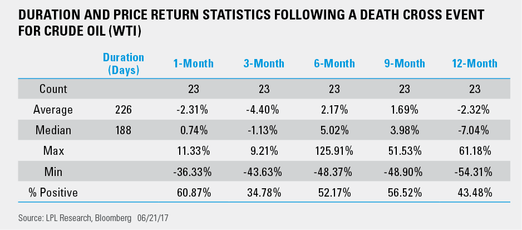
- Looking at 32 years of historical data on the crude oil (WTI) daily chart, there were 23 instances when the 50-day SMA crosses below the 200-day SMA. Subsequent price returns tended to be flat to modestly lower for approximately three months before stabilizing and moving higher over the next six-to-nine months (Figure 2).
- “Often, a death cross event is the after effect of a bearish intermediate-term price trend and tends to be a lagging indicator of future market direction. Oil price patterns may have just triggered a death cross, but current market conditions and historical data suggest a period of price stabilization may be likely which could signal the beginning stages of a bottoming process.”
4. Nasty Swan!
In this environment, we don’t intend to get into correctness-trouble by attributing colors to Swans. So we choose to term swans by the end results they create. And the result we are getting concerned about is nasty as all get out. Not just us but Wall Street as a whole is learning new meanings for old terms. For example, MBS no longer stands for Mortgage-Backed Securities. Instead, MBS is now synonymous with Mohammed Bin Salaam, the new crown prince of Saudi Arabia & the next king to be.
It was MBS who drove the intervention of Saudi Arabia in Yemen and it is MBS who is supposed to be the driver of the recent actions including the blockade of Qatar. Secretary of State Tillerson & his State Department have become hoarse in their verbal shots against Saudi Arabia & Emirates. But they don’t care, probably because MBS knows President Trump backs him.
And this stuff is really not against Qatar but against Iran. Iran is being baited weekly to start something against Saudi Arabia, something that can serve as an excuse to attack Iran with Israeli support and/or participation. It seems as if all the stars are aligned for an adventure against Iran. Recall that Iran fired ballistic missiles into Syria for the first time. Why? To show Saudi Arabia how Iran can retaliate against them?
Add to that the increasing negative interaction between US and Iran-Syria-Russia inside Syria. We heard a TV report this week that Secretary Tillerson doesn’t speak with Russia’s Foreign Minister Lavrov because he fears getting entangled in the Russia-collusion special counsel investigation. So who is running point in Syria? Are Secretaries Tillerson & Mattis are realizing that their bravado of running their departments as a pair & ignoring Trump “because he has no power” works only if there isn’t a real crisis?
Add to this articles discussing the decades long “cooperation” between Iran & North Korea in nuclear weapons & ballistic missiles. No wonder George Friedman, founder of Geopolitical Futures & ex-founder of Stratfor, is writing that this situation reminds him of the period before Desert Storm against Saddam Hussein in 1990-1991.
It doesn’t have to get to that. You get one military accident that involves Saudi Arabia or UAE or even one explosion in Saudi Arabia and Oil will become relevant again & Volatility will reawaken.
Send your feedback to editor@macroviewpoints.com Or @MacroViewpoints on Twitter
