Summary – A top-down review of interesting calls and comments made last week in Treasuries, monetary policy, economics, stocks, bonds & commodities. TAC is our acronym for Tweets, Articles, & Clips – our basic inputs for this article.
Editor’s Note: In this series of articles, we include important or interesting Tweets, Articles, Video Clips with our comments. This is an article that expresses our personal opinions about comments made on Television, Tweeter, and in Print. It is NOT intended to provide any investment advice of any type whatsoever. No one should base any investing decisions or conclusions based on anything written in or inferred from this article. Macro Viewpoints & its affiliates expressly disclaim all liability in respect to actions taken based on any or all of the information in this article. Investing is a serious matter and all investment decisions should only be taken after a detailed discussion with your investment advisor and should be subject to your objectives, suitability requirements and risk tolerance.
1.Escalator-Elevator!
Last week we wondered, rather foolishly in retrospect, whether this week will see Dow 27,000 capping the fastest 1,000 point rise. A funny thing happened instead. The Dow actually fell 1,000 points this week (1,096 pts to be more exact), once again demonstrating that asset classes might go up in an escalator but they come down in a fast elevator. Now we wonder whether the Dow breaks 25,000 on the downside?
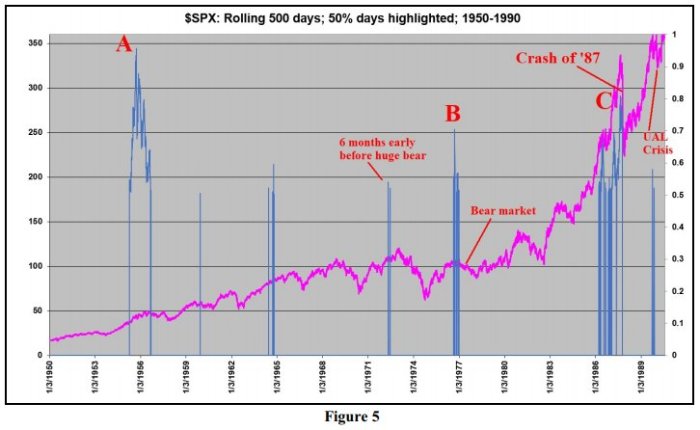
Last Friday, Lawrence McMillan on Option Strategist called on his readers to “wait for confirmed sell signals“. Thankfully, Twitter like the stock market opens daily. Because, look what Mr. McMillan tweeted on Monday, January 29:
- Lawrence G. McMillan @optstrategist – A Rare, But Often Effective, Early Warning Sell Signal http://www.optionstrategist.co
m/blog/2018/01/rare-often-effe ctive-early-warning-sell-signa l-preview … $SPX
 If that wasn’t enough, look what we found on Tuesday afternoon:
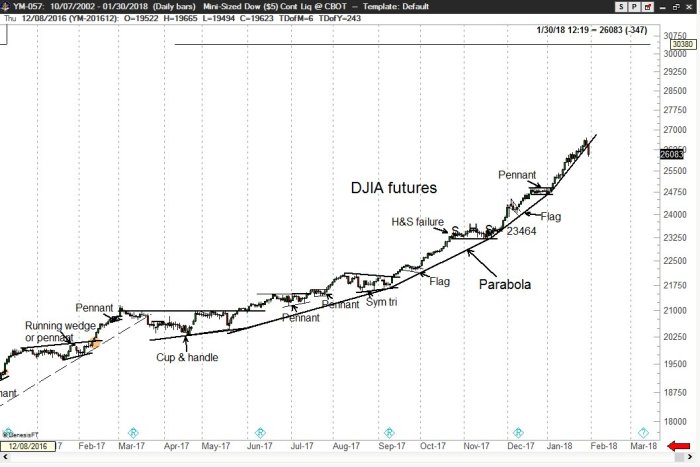
- Peter Brandt @PeterLBrandt –The parabolic advance in
$DJIA$YM_F has been violated. 10 to 15% correction on the way.
 So those who follow whom we follow had the opportunity to avoid almost 2/3rds of this week’s decline. But that’s history.
2. What’s Next for US stocks?
The McClellan Oscillator dropped to minus 271 at Friday’s close. But does that mean sentiment is washed out?
- Peter Brandt @PeterLBrandt –My gut opinion following the Twitter stream today is that way much blind arrogance continues to exist — and the punishment is not done. Time will tell.
A more numerical argument:
- Thomas Thornton @TommyThornton –
$SPX bullish sentiment is at 39% and$NDX bullish sentiment is at 42%. Just 10 days ago there were record highs of 96% and 97% bulls. More to go to the get fully oversold. I expect <10% near lows
An empirical point:
- Urban Carmel @ukarlewitz – A 1% down day at the close tends to have follow through in the following day(s)
$SPX
Empirically speaking, the ideal scenario would be a fall on Monday followed by a decline on Tuesday morning that gets reversed and closes in the green.
Volatility does seem to suggest a bounce:
- Urban Carmel @ukarlewitz –
$VIX:$VXV at 0.98. Last two closes over 1 were the 2016 election and April 12-13 2017.
But will the bounce be a sustained one or a transient one?
- Thomas Thornton @TommyThornton-
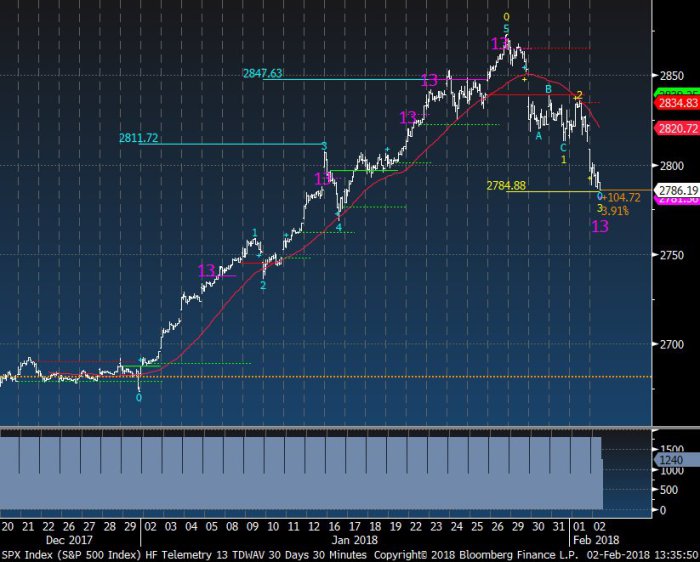
$SPX Good news it’s at my downside wave 3 target 2784 I’ve been expecting since the recent top, Bad news, wave 4 will be a lower high bounce and then wave 5 will break even lower.
 Carter Worth of CNBC Options Action said last Friday’s high marks an important intermediate top. But the only man who called for a substantial correction last week disagrees:
- Peter Ghostine @PeterGhostine –I’m looking for one more high in the S&P 500 before the start of the major correction hat I’ve been touting for weeks. http://www.61point8.com/Portals/0/article%20images/20180131/20180131SPX1.png …
#StockMarket#stocks#NYSE#SP500
These are all smart & wise observations. The best signals will come from the nature of the bounce when & if it comes.
3. Rates & Stocks
Remember the Gundlach-Santelli 2.63% line for the 10-year yield! On Friday, the 10-year yield closed at 2.84% – a rise of 20 bps from the hard stop of 2.64% of Gundlach. Guess what? 18 out of these 20 bps came on Thursday & Friday of this week. The first trigger was Atlanta Fed calling for 5.4% real GDP growth in Q1 2018. No wonder rates exploded up on Thursday afternoon.
Then came Friday’s NFP number that showed the fastest wage growth since the end of the last recession. No wonder rates exploded up again on Friday in a second day of bear-steepening. And the 30-year yield closed clearly above 3% at 3.08%. If this breakout is real, then we could see the “parabolic shift in rates” to 3.5% or even 4% for the 10-year yield as Larry McDonald said on Friday afternoon.
Another shift has occurred without much discussion. After months of relentless flattening of the yield curve, we have shifted to steepening:
- Thomas Thornton @TommyThornton – US 2/10 year yield spread shows a steepening curve after recent DeMark exhaustion signals
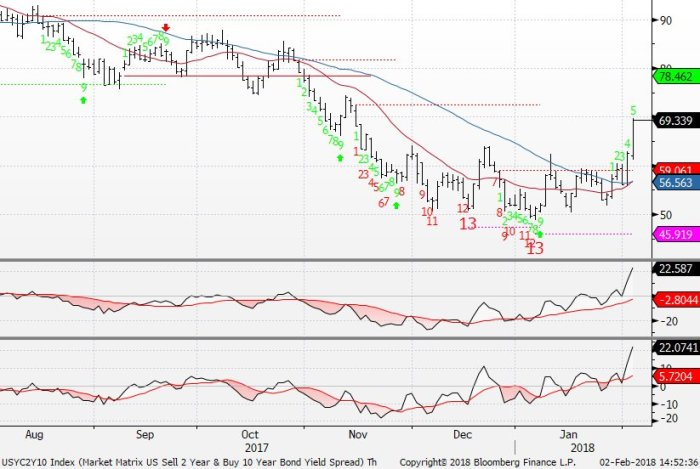 As another interesting sign, the 2-year yield closed DOWN on Friday as the rest of the curve shot up in yield. And the rise in 2-year yield this week was only 2.5 bps compared to 18 bps & 12 bps for the 10-year & 5-year yields resp.
- Babak @TN –Daily
#Sentiment Index for#bonds close to single digits, as of yesterday: Treasury bonds 10% Treasury notes 11% and$DXY US dollar 12%
So bonds are oversold but are they so oversold that a bounce is imminent? The shift of the force from the 2-year to the 30-year may prove significant for all asset classes as we saw on Friday.
4. Dollar, Gold & Commodities
The Dollar did bounce on Friday to close marginally up on the week. The steep rise in long rates & the Dollar bounce caused serious damage to commodities & resource stocks this week.
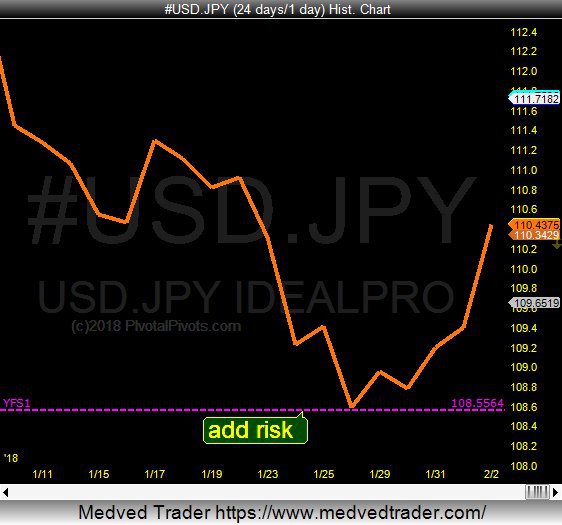
- Jeff York, PPT @Pivotal_Pivots –
$USDJPY today is popping today off the YFS1 Yearly Pivot Point. That’s why$GLD is falling. The Biggest reversals happen at Yearly Pivots!
 Gold fell 1% on the week but the miners were clobbered down 5-7%.
- Peter Brandt @PeterLBrandt –
$GLD$GC_F upside breakout is most likely a failure.
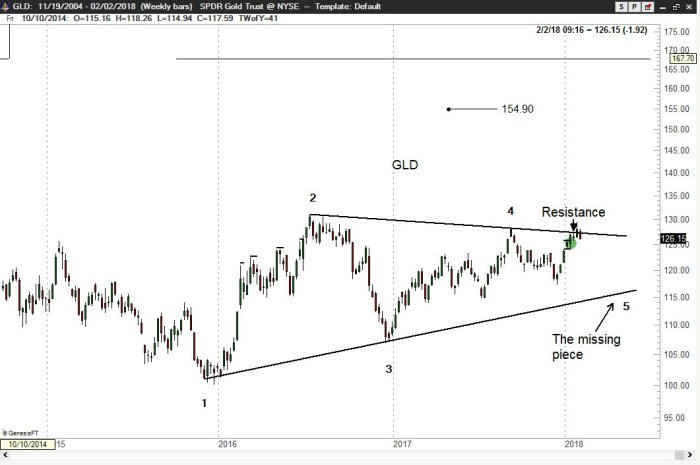 Don’t failed breakouts lead to ugly action? Silver got torched this week
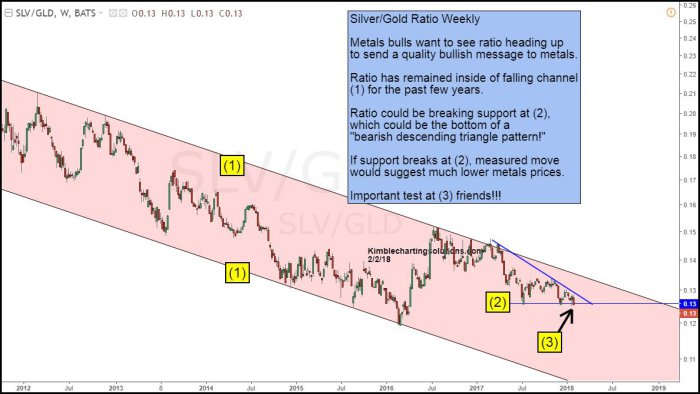
- Chris Kimble @KimbleCharting –Silver Gold ratio could be breaking support of bearish pattern at (3) below. Important support test friends!
$GLD$SLV$GDX$GDXJ
Base metal stocks & Ag stocks got hammered as well. And worst hit were energy stocks with both OIH & XLE down 6.5% on the week.
- Jeff York, PPT @Pivotal_Pivots –
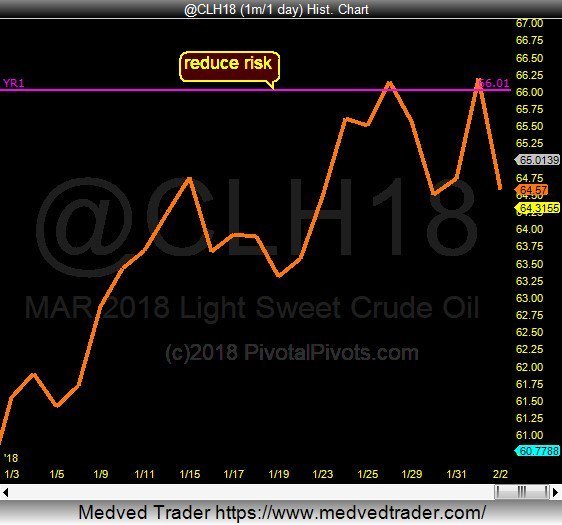
$CL_F$WTIC is making a double top at the Yr1 Pivot. Some of the largest#oil Hedge Fund PM’s are my clients@PivotalPivots.#TradethePivots
A double top & a H&S pattern?
- Peter Brandt @PeterLBrandt – Brent Crude topping with H&S pattern.
@BrynneKKelly@chigrl$IC_F$CO_F$OIL
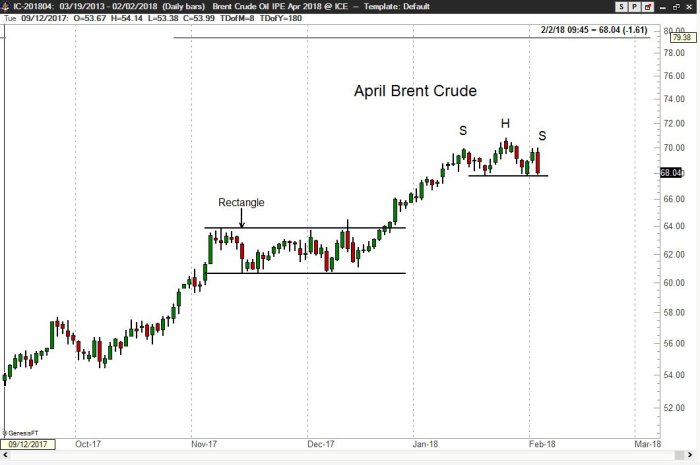 Such is the power of the 30-year yield breaking out in combo with the US Dollar.
Send your feedback to editor@macroviewpoints.com Or @MacroViewpoints on Twitter
