Summary – A top-down review of interesting calls and comments made last week in Treasuries, monetary policy, economics, stocks, bonds & commodities. TAC is our acronym for Tweets, Articles, & Clips – our basic inputs for this article.
Editor’s Note: In this series of articles, we include important or interesting Tweets, Articles, Video Clips with our comments. This is an article that expresses our personal opinions about comments made on Television, Tweeter, and in Print. It is NOT intended to provide any investment advice of any type whatsoever. No one should base any investing decisions or conclusions based on anything written in or inferred from this article. Macro Viewpoints & its affiliates expressly disclaim all liability in respect to actions taken based on any or all of the information in this article. Investing is a serious matter and all investment decisions should only be taken after a detailed discussion with your investment advisor and should be subject to your objectives, suitability requirements and risk tolerance.
1.Fed Rate Cut – Applause Now after Hubris-based Error?
We have rarely seen the type of angry anti-Fed rhetoric we saw this week after the sudden rate cut of 50 bps by the Fed. The stock guys were angry because the 300 point stock rally of the morning reversed quickly after the Fed rate cut & the Dow closed down 780 points on Tuesday. Their chief complaint was that the Fed panicked the stock market by their sudden action. Some of them expressed their anger against the “continued madness” of the Fed in lowering rates to drive up stocks. Some hard-money analysts were angry about the rate cut for the opposite reason. Some business cycle guys were angry because they believed the economy was strong & actually strengthening. Only Jim Bianco & Jeff Gundlach were smart & brave to say the Fed did the right thing and applauded the Fed.
The Treasury market is so central to our & global financial markets that aspects of it touch every discipline from macro to micro, from stocks to credit to currencies to commodities That is why analyzing the Treasury market via single discipline based people is often like the old fable of blind analysts analyzing an elephant (an animal they had never encountered before) by touching various parts of the elephant. Obviously their attempts fail.
Our approach is simple. We assume, based on history, that the Fed always screws up mainly out of hubris & partially because of their intense desire to look good especially to the Congress. Recall what the FOMC statement said on January 29, 2020 after that Fed meeting:
- “The Committee judges that the current stance of monetary policy is appropriate to support sustained expansion of economic activity, strong labor market conditions, and inflation returning to the Committee’s symmetric 2 percent objective.”
At that time, we viewed this hubris to be a throwback to “Mission Accomplished” banner that was posted behind President George W. Bush to celebrate the successful toppling of the Saddam Hussein regime.
Not quite. Because something was missing in the hubris of the FOMC statement on January 29, 2020. Hubris about how successful the Fed’s Repo Support operation had been. That came during the Congressional testimony on February 11, 2020:
What came 2 days later? The New York Fed announced on Thursday February 13, 2020 that
- “The maximum offerings on term repo operations, which last two weeks, will be reduced on Tuesday to $25 billion from $30 billion. In March, the cap will be reduced further to $20 billion.”
That was the first reduction in the cap on term repo operations since they were begun last fall. That fateful Tuesday was February 18, 2020. Guess what happened from February 19, 2020, the next day? The ytd chart of SPY answers that better more than 1,000 words could:
Now fast forward to this past Monday, March 2, 2020. What did the Fed face besides the G-7 call? A Treasury market with the overnight Federal Funds Rate as the 2nd highest rate in G-7, lower only than the 30-year rate. The 1.50% Federal Funds rate was 34 bps higher then the 10-year rate and 56 bps higher than the 5-year rate. And, the demand for the Repo support on that Monday morning broke all previous records, even the record reached on December 31, 2019, the most illiquid day of a calendar year.
Now go back to the above clip of Chairman Powell & focus on what he said at minute 1:23:
- “Our main focus, of course, is the Federal Funds market and our ability to transmit our policy decisions smoothly into the money markets through the Federal Funds Rate.”
The record demand for Repo support was a sign of unacceptable liquidity crunch possibly exacerbated by the ridiculous inversion between the Federal Funds Rate & the entire Treasury curve up to 10-years. Either the Fed had to intervene bigly or announce that the Federal Funds rate had no longer any meaning. And what would have happened to markets had the Fed said the latter?
So the Fed had NO Choice except to cut by 50 bps on Tuesday morning. And they were simply unable to explain the real reasons of the cut. What could they say? That they had kept the Federal Funds too high for months? Or that their original sin was to raise the Federal Funds rate to ridiculously high levels in Q4 2018? Or admit both & also that their self-congratulating “current stance of monetary policy is appropriate” comment in their FOMC statement of January 29 was horribly wrong? Yeah, right! The Fed is above all a political animal & keeping up appearances is the key to their survival.
Kudos to Jim Bianco for trying to explain this on CNBC Fast Money on Tuesday, March 3.
What did we see on this past Friday afternoon? Deja vu all over again, to use an over-used but superb phrase. This Friday’s inversion between the Federal Funds Rate and the sub-30 Treasury curve is almost as bad as a week ago. The new Federal Funds is 1% but the 10-year yield is now at 76 bps & the 5-year yield is now at 60 bps, inversions of 24 bps (vs. 34 bps a week ago) and (40 bps vs. 56 bps a week ago).
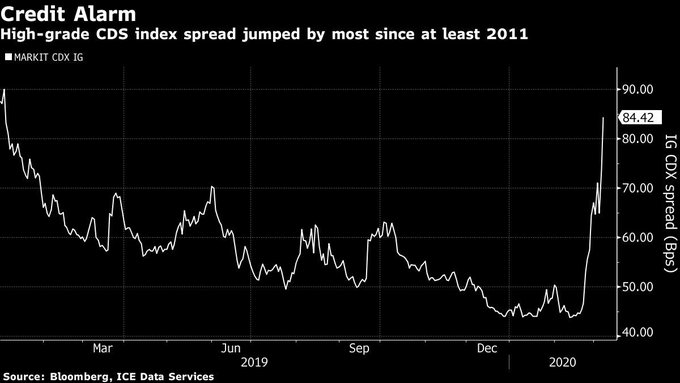
And there is now a bigger problem. The Corporate Bond market, the biggest problem in financial markets, has virtually shut down. High yields spreads blew out on Thursday & Friday while Treasury yields melted. In simple terms, high yield ETFs, HYG & JNK, fell 1.3% on the week while TLT, the Treasury ETF, rallied by 7%.
- Lisa Abramowicz@lisaabramowicz1 – “This is what the start of a recession after a long bull market feels like. This is the first day of seeing some panic in the market.”
No wonder John Williams of the NY Fed talked on Friday afternoon about cutting rates further & Rosengren of the Boston Fed even spoke wildly about buying other asset classes.
The big question is when do they cut again by 50 bps? Wait until FOMC meeting on March 18 or next week? The answer may depend on the demand on Monday & Tuesday for the Repo support & the condition of the corporate bond market not to mention the stock market.
What is one silver lining? A cut of 75 bps or two cuts amounting to 75 bps will disinvert the Treasury-FF curve. But will that help the corporate bond market? And will the stock market end the sell off without stability in the corporate bond market?
We will find out soon. One good sign. The entire FOMC is petrified now just as they were on December 26-31, 2018. Frankly, we can’t wait for the Fed to start buying Muni bonds.
2. 2007-2009 or ten years prior?
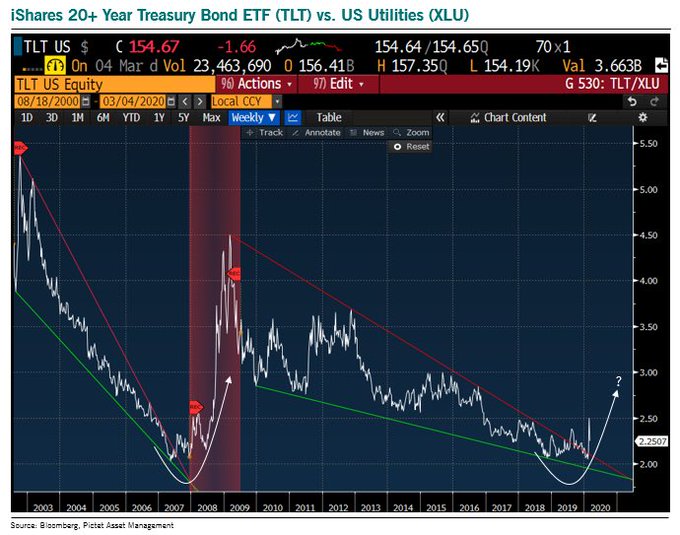
- Julien Bittel, CFA@BittelJulien – The last time US long duration bonds posted a multi-year breakout of this magnitude vs. US Utilities, was July ‘07. We’re still climbing.
Jumping from 2007 to 2009,
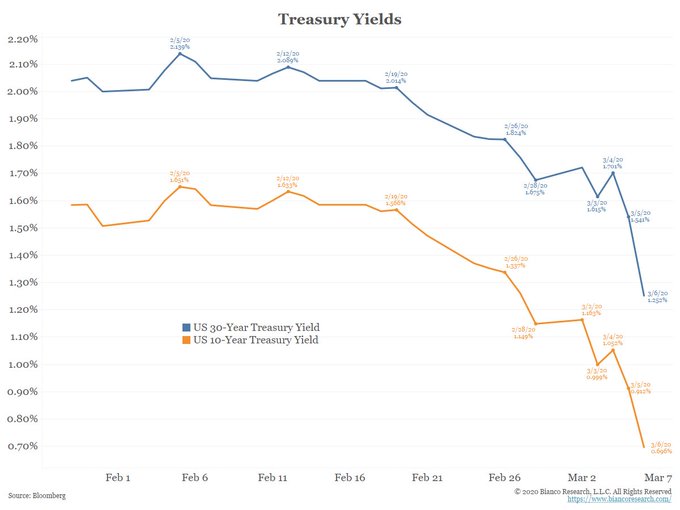
- Jim Bianco@biancoresearch – *U.S. 30-YEAR YIELD SET FOR BIGGEST ONE-DAY DROP SINCE 2009
But what about the mid-point of 2007 & 2009? One says Not Yet:
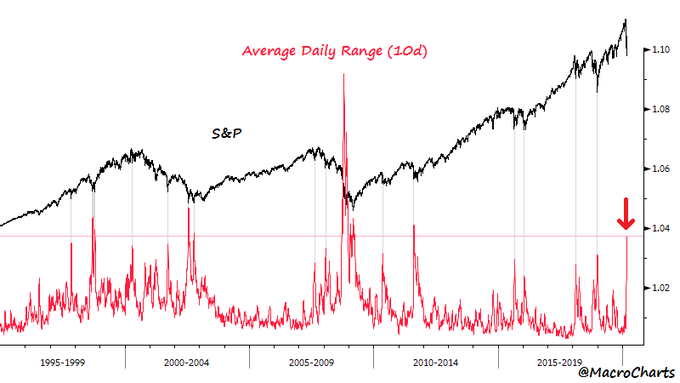
- Macro Charts@MacroCharts – – Realized Vol is getting extreme – for instance the 10d Ave Range is *almost 4%*! Bull or Bear markets, this craziness mostly led to V-shaped rallies or retests/basing. But whoever compared this to ’08.. *not even close* – you had to be 2x taller for that ride!$ES_F $SPX $SPY
Frankly, we don’t think this is 2007-2008 either. Our model is different, at least right now. We think we have seen this type of a financial storm before. That economy was also doing fine until it was hit with a sudden blow. This economy was doing fine three weeks ago based on Friday’s 273K Non-Farm Payroll report plus 85K of upward revisions to January 2020 & December 2019. Read what ECRI’s Lakshman Achuthan (how we love that highbrow erudite name) said this week:
- “Going into the coronavirus crisis, the dozen-plus key leading indexes we monitor told us that the US economy wasn’t in a window of vulnerability:
- Importantly, housing — a critical driver of the economy — had already been strengthening, …
- Separately, manufacturing is actually in a better cyclical position than most realize …
- Paradoxically, the US industrial sector has lucked out in another way. … This is why manufacturing is mostly okay for now.
- Separately, the US-China trade war may also have helped by persuading manufacturers to move supply chains out of China.”
We tend to agree with the above points of Achuthan. But we think he is nuts in his conclusion:
- “The point remains that none of these potential problems can be solved by a Fed rate cut. … This rate cut could do more harm than good.”
See, even these smart business cycle guys don’t get the sins of illiquidity or the mechanics of Repo or funding operations.
This week’s rate cut & the realized volatility in the stock market’s decline remind us of October 1998 when Treasury yields collapsed with the emerging market debt debacle & Long Term Capital’s highly leveraged positions. We remember how senior people in Wall Street firms were not even sure their firms will survive in October 1998 & how they expected to be paid a big Zero that year.
Remember how the October 1998 rate cuts by the Greenspan Fed failed to get a sustainable stock market rally. As we recall, it took a 3rd rate cut in mid-November to get that glorious stock rally going. Yes, that rally turned into a bubble but not for another 12-15 months.
We are getting increasingly drawn to this model because we think the underlying US economy is ok & is likely to strengthen with both rate cuts by the Fed & a post-Corona-panic payroll tax cut or direct payments to the lower middle class.
Remember Treasury bonds went into a bear market for 2 years post November 1998 after being the center of action in October 1998. And what is the center of attention in today’s markets?
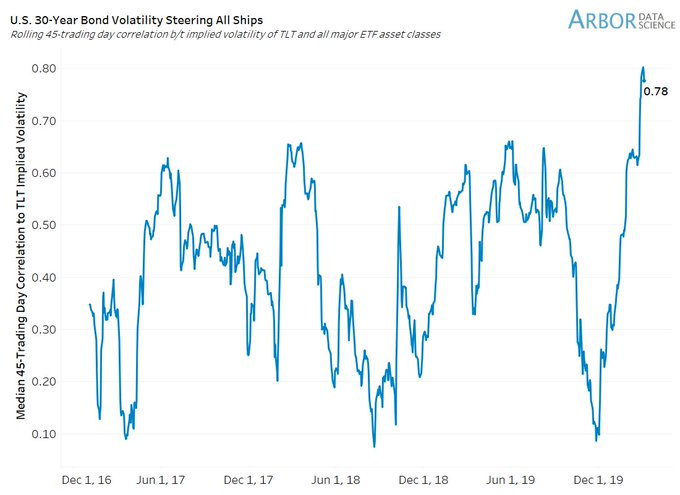
- Ben Breitholtz@benbreitholtz – Nearly ALL asset classes’ implied volatility (using ETFs) have attached to the U.S. 30-year bond (TLT). We’ve updated this chart a lot in recent weeks and it’s getting more intense.
3. A Friday to remember
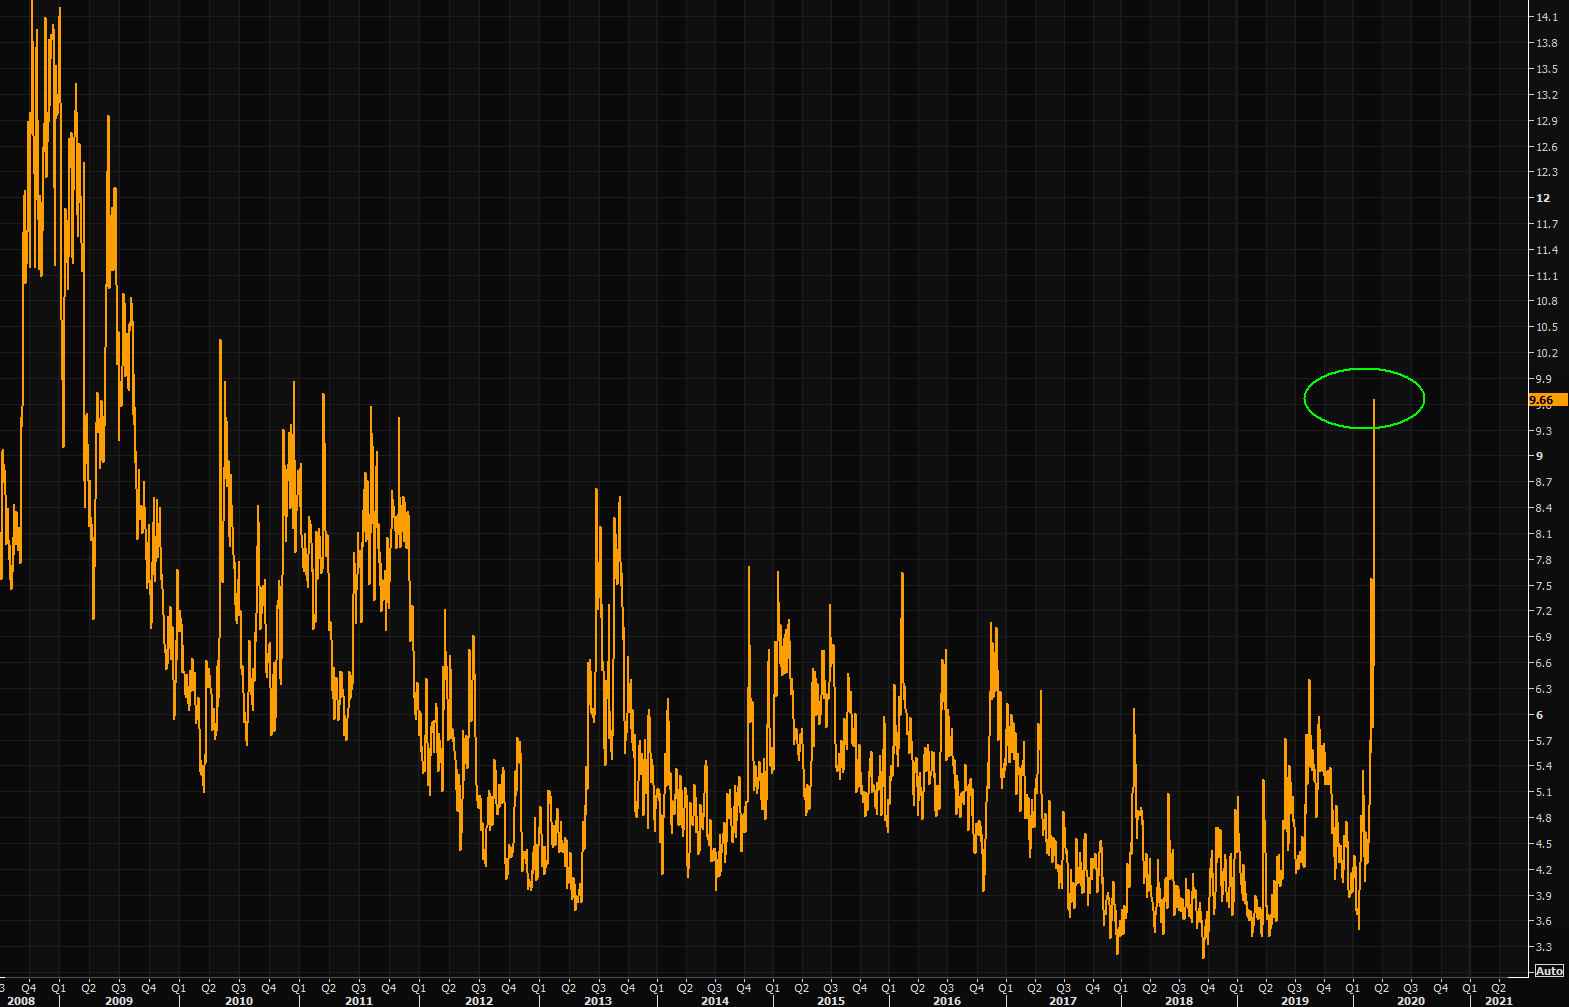
Since all vol is attached to the 30-year vol per above tweet,
- Market Ear – Treasury vol, TYVIX – the volatility blow out of the day. …. TYVIX surging big time, reaching levels last seen in 2011.
The 30-year Treasury yield fell 30 bps on Friday. Yes, a one-day fall of 30 bps. And without any identifiable event. And that after a 9 bps fall on Thursday. How does it look on the chart of TLT (up 5%+ on Friday), the long duration Treasury ETF?
- Market Ear –The amazing TLT….on huge volumes.
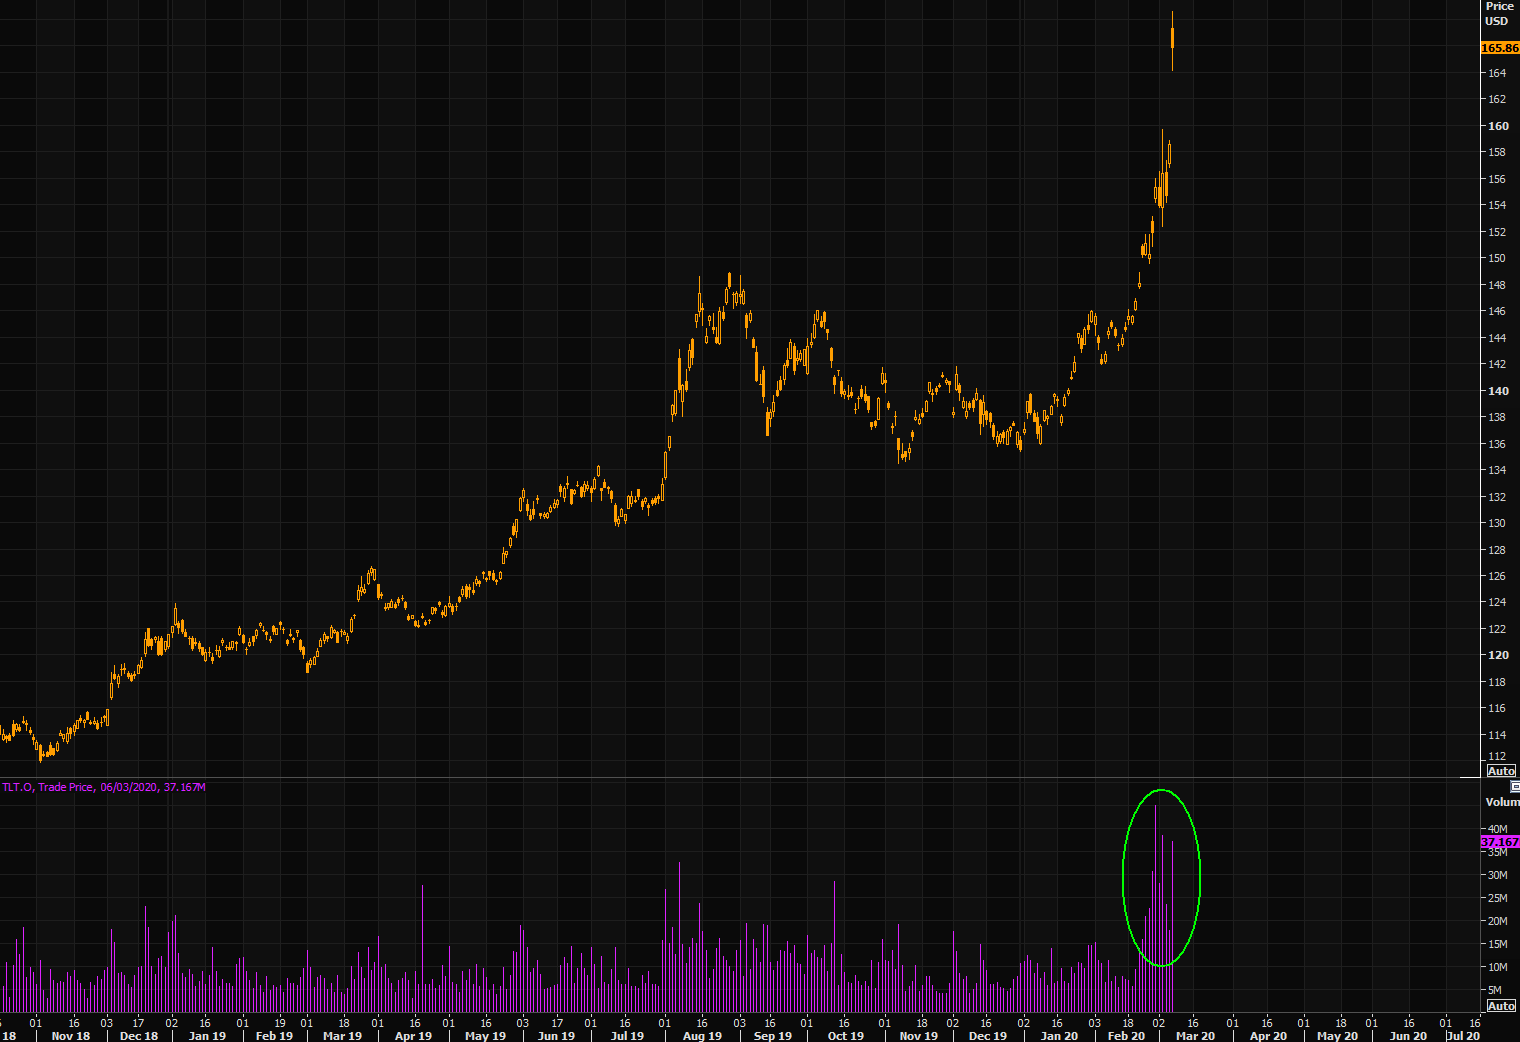
The Treasury market is both big & deep. So this type of a move on big volume is rare. Was some fund or firm was caught in a squeeze of short Treasury positions? If so, was the position closed or was it just partially liquidated? Friday’s peak in TLT was around 3:10-3:15 pm. And that was also the peak in VIX on Friday at about 54. Just look at Friday’s chart below. It is steeper & more violent than the TLT move.
When VIX was at 54, the Dow was down close to a thousand points. As the VIX turned down, Dow rallied by 700+ points to close down only 256 points. As we recall, CNBC’s Steve Liesman came on near the peak of this VIX up move to relay what NY Fed President Williams had said “moments ago“. Was this clip a reason for the violent fall in VIX and the steep rally in stocks?
If you listen to the clip, you realize that Williams didn’t say anything novel. So was the clip just coincidental & the violent reversal was because the squeeze was done for the day or did the clip scare many into fearing a Fed action before markets open on Monday?
We have no clue but we do think that the inversion in the Federal Funds rate & the Treasury curve has to end before liquidity & stability are restored.
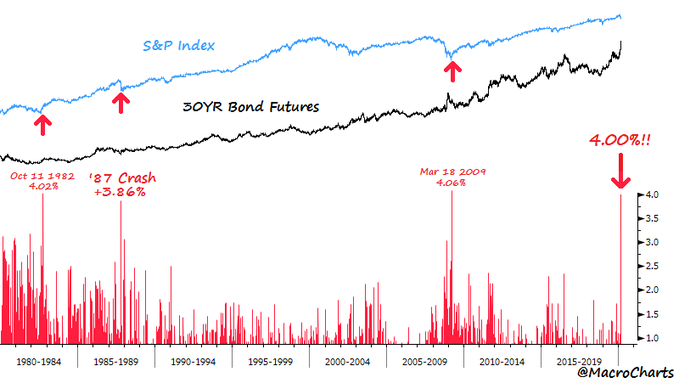
Will this Friday be a day to remember? Not just remember but remember like the only 3 days that are remembered:
- Macro Charts@MacroCharts – At the highs of today’s session, 30YR Bond Futures are up +4.00% and rising. One of those HISTORIC days we’ll tell our kids about: There have only been THREE others like it in the ENTIRE HISTORY of Bond futures – Stocks rallied the next year +27%, +19%, +47%. Think about it.
What is a Macro way of saying the same thing?
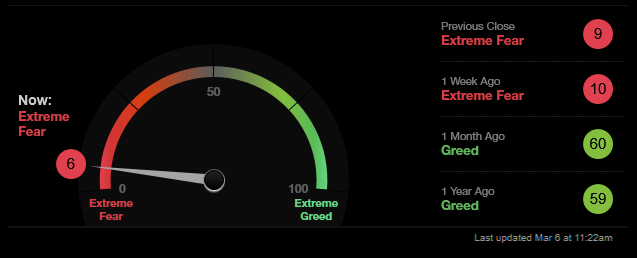
- Thomas Thornton@TommyThornton – Bond bullish sentiment is 98% and $SPX bullish sentiment is at 8%. Sentiment charts will be updated on hedgefundtelemetry.com site soon. THESE ARE EXTREME SENTIMENT READINGS.
How would you say it in a picture?
4. Dollar, Gold & Oil
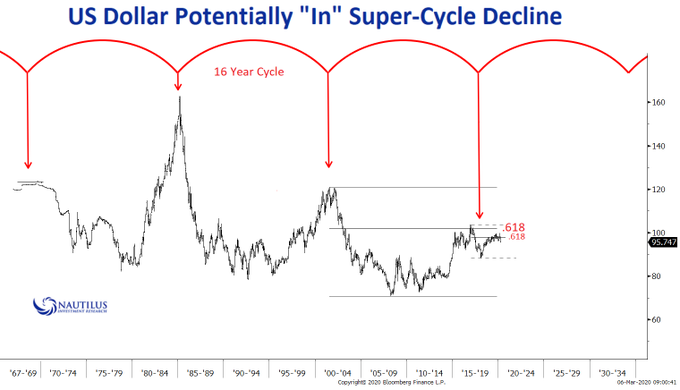
If the Fed is literally taking rates to zero, then how should the Dollar behave?
- Nautilus Research@NautilusCap – $DXY #DollarIndex – 16-year super cycle peak?
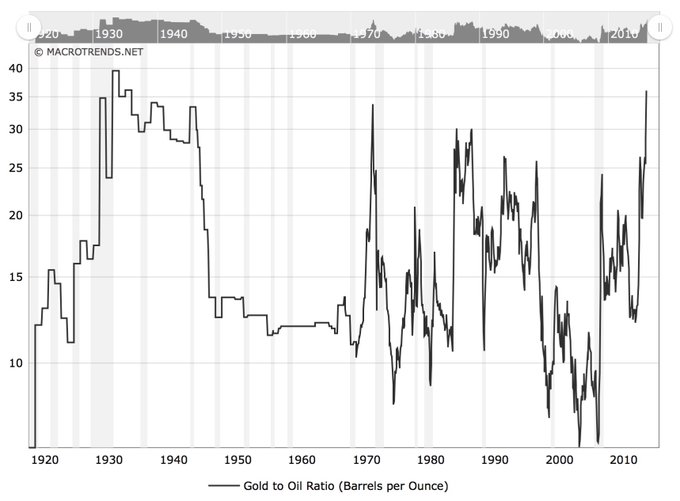
If rates go to zero, financial conditions loosen up & Dollar goes down, will Gold go up as it rallied 6% this week. And will miners go up bigger? Will that also put some oomph in Silver? In stark contrast, Oil fell 8% this week with Oil Holders ETF down 19% on the week.
Any historical perspective on how rare this disparity is?
- LongWave Investing@WFLONGWAVE – Gold/Oil Ratio is closing in on 40. Highest level since the Great Depression.
Send your feedback to editor@macroviewpoints.com Or @MacroViewpoints on Twitter