Summary – A top-down review of interesting calls and comments made last week in Treasuries, monetary policy, economics, stocks, bonds & commodities. TAC is our acronym for Tweets, Articles, & Clips – our basic inputs for this article.
Editor’s Note: In this series of articles, we include important or interesting Tweets, Articles, Video Clips with our comments. This is an article that expresses our personal opinions about comments made on Television, Tweeter, and in Print. It is NOT intended to provide any investment advice of any type whatsoever. No one should base any investing decisions or conclusions based on anything written in or inferred from this article. Macro Viewpoints & its affiliates expressly disclaim all liability in respect to actions taken based on any or all of the information in this article. Investing is a serious matter and all investment decisions should only be taken after a detailed discussion with your investment advisor and should be subject to your objectives, suitability requirements and risk tolerance.
1.Synchronicity?
What can you be sure of? That CNBC Anchors & producers would cheer rise in long duration rates as they did this week. They were so happy that the anchors on the 1 pm Exchange show totally ignored the 30-year auction that took place at 1:00 pm. Yes, they did bring in Rick Santelli later to spend a few seconds on the 30-year auction but the Anchor of the Exchange paid no attention to what Rick said. They had paid serious attention to the 3-year auction on Tuesday and paid some attention to the 10-year auction on Wednesday. So why should they bother about Thursday’s 30-year auction, right? Wrong!
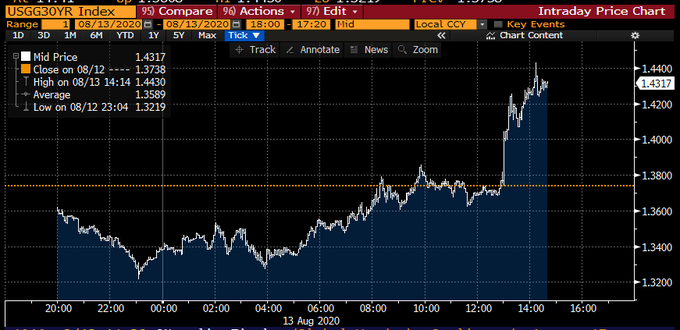
- Lisa Abramowicz@lisaabramowicz1 – – There’s a bit of unease developing around this week’s record sales of longer-dated U.S. bonds. Today’s $26 billion auction of 30-year notes didn’t go that well, leading prices to fall & yields to rise across the board. Interestingly, stocks have dipped lower in tandem with bonds.
Look at the vertical rise in rates from 1:00 pm in the chart below from Lisa Abramowicz:
But that must have been good for stocks, right? Wrong again! Look at her chart below & notice that SPX had crossed over the old closing high to 3387.24 at 1:01 pm. Then came results of the 30-year auction & bababa-boom – a steep fall.
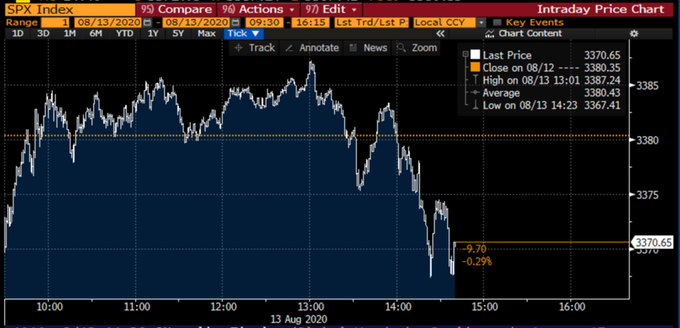
How many times have we seen this? Rates rising steadily seem fine to the S&P just as steadily rising water temperature seems fine to the frog of the monetary parable. But a sudden steep spike in rates does usually produce a sudden fall in stocks.
This synchronicity was also evident on Friday as the chart of past two days shows. But very very few anchors noticed it, not even the much-ballyhooed “investment committee” of CNBC Half Time Report. But they will wake up very quickly if the S&P drops close to 3100 as Carley Garner, a Cramer fav technician, warns it might.
Given this synchronicity, shouldn’t we first look at rates and then at stocks?
2. Rates.
This was a pretty bad week for rates. In fact, the 30-year yield rose every single day this week to close up 21.5 bps on the week. The 20-yr & 10-yr yields closed up 20 bps & 15 bps resp. The 7-yr & 5-yr yields closed up 9 & 6.5 bps resp. Thus the 30-5 yield curve steepened by 15 bps on the week.
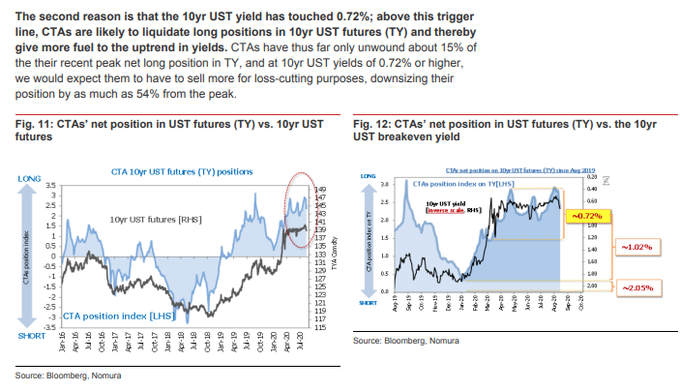
This is not a surprise because the Fed is least active in the 30-year space as Jim Bianco had warned on BTV this week. What about the big players who are very long the 10-year Treasuries? At what level do they start reducing exposure?
- LongConvexity@LONGCONVEXITY – Nomura-72bps in UST 10’spotential trigger for CTAs to reduce long exposure
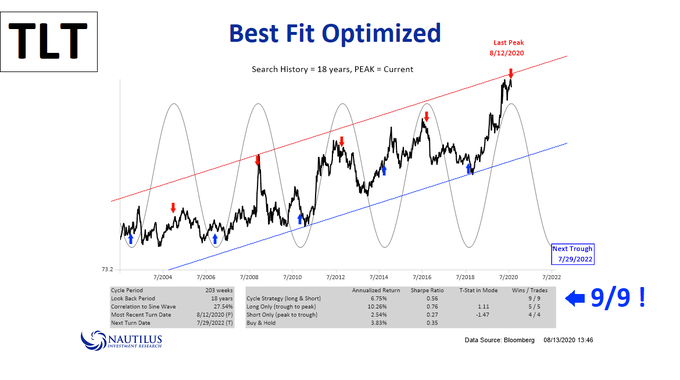
But isn’t every fall followed by a rise from the bottom line of the channel? So where is the lower line of the TLT channel? That depends on the thickness of your pencil as Dennis Gartman used to say or on your calculations. One such says TLT will hit the bottom line of the channel on 7/29/2022.
Priya Misra of TD Securities had said goodbye to the 60-80 bps range of the 10-year yield. Now she was back right smack in the middle. But she stayed true to her belief & said “fade this rise in rates“. She argued that supply is a liquidity event that is used to buy duration. She said that there is a ton of demand for duration in the world. But “watch out for the September Fed meeting“, she warned. If they disappoint in September, then we may get a big move in rates. Then Komal Sri Kumar came on BTV on Friday afternoon to say that he doesn’t expect yields to hold and he doesn’t see stagflation.
By the way, this fall did not stay contained to Treasuries. The High Yield ETFs, HYG & JNK, fell by 1.5% on the week. And a couple of firms downgraded Muni Bonds too.
But Carley Garner, Cramer’s featured technician of the week, thinks the 10-year Treasury note “might have one last hurrah that could take yields down to last week’s low“. (perhaps as the S&P falls to 3100, as she warns?)
After all of the above, we must draw your attention to the conversation between Scott Minerd of Guggenheim & BTV’s Scarlett Fu. But first a summary by Bloomberg’s Katherine Greifeld:
- “The Fed has made it clear to us that they would not want to see long-term rates rise, and I would expect in the policy statements coming in September that we will see some commitment to keeping rates lower,” Minerd said in a Bloomberg Television and Radio interview Friday. “The weakness in bonds, especially from here, would be a buying opportunity.”
- Minerd — who doesn’t think lawmakers will agree to anything until September — says that’s another reason to bet on bonds, even with yields still hovering near historical lows.
- “They don’t represent good value, they give incredibly poor returns, but the pressures in the economy look like they will ultimately turn back to negative,”
Now for the big statement – Minerd says he expects the 10-year yield to hit negative 50 bps in the next 18 months & that their model has an estimate range for the 10-year yield between minus 2% & plus 1%. And he points out that this model has failed to overshoot the lower end of the range.
He also refers to the terrific discussion about bonds by Dr. Lacy Hunt of Hoisington on BTV. It is a long discussion but a superb one.
By the way, did you notice something weird? In this detailed section about the nasty action in Treasuries, we didn’t mention Rick Santelli even once. It is almost as if they have retired his jersey. They have certainly ended his Santelli Exchange segments. Guess they assumed that Treasuries were finished as a point of discussion or they just don’t care about them any more now that they think they have become a semi-political or a health-care channel. How idiotic!
3. Stocks
Remember that Bond volatility was suppressed for several weeks. It woke up this week with a snarl. That does tend to wake up stock volatility at least sometimes. But this time, it might be a different one than the VIX.
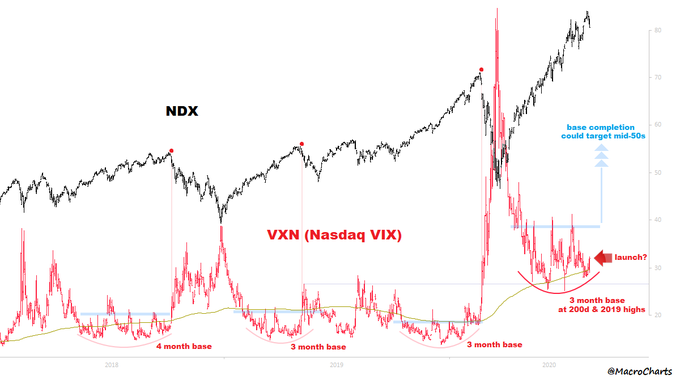
- Macro Charts@MacroCharts – – The most critical Equity chart I’m watching here: $NDX Volatility Index $VXN has formed a *massive* 3-month base. Even more important: yesterday MAY have been the initial launch out of the pattern. If Tech Volatility confirms a break higher, be ready for widespread panic.
Putting this another way,
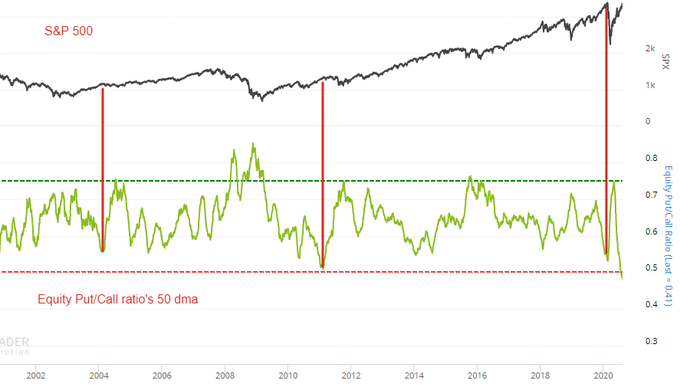
- SentimenTrader@sentimentrader – – History being made: Put/Call ratio’s 50 dma is at the LOWEST level in the past 20 years. Even less extreme cases led to pullbacks/corrections. Worrisome?
This brings us to the aforementioned Carley Garner, Cramer’s featured technician in this week’s “Off the Charts” segment:
- “If we keep getting good news, Garner thinks the S&P could benefit from another short squeeze that would take us to new highs at around 3,400, which is up less than 1% from here, …. We’re practically close enough to taste it. If we get to 3,400, then longer-term she believes 3,600 is in the cards,”
- If the S&P 500 crosses the 3,400 mark, about 20 points from Wednesday’s end, the event could usher in a round of selling that could bring the benchmark back down to 3,100.
- The RSI and the Williams Percent Range, another momentum indicator, in the S&P 500 are signaling that the market is overbought and likely headed for a pullback. The uptrend should remain intact afterward,”.
“Garner believes it’s foolhardy to be aggressively bullish right here, at least for short term,” he said. “In Garner’s view, the uptrend, though, is not in danger. You might get some sort of nasty short-term sell-off like we had in June … and that means any sell-off is going to be used to buy.”
On the other hand, Lawrence McMillan of Option Strategist wrote on Friday:
- Market breadth has been relatively constructive recently, and both breadth oscillators remain on buy signals. Cumulative breadth statistics are even more positive. The “stocks only” cumulative advance-decline line has made a new all-time high on four of the last six trading days.
- The intermediate-term interpretation of the $VIX chart is bullish for stocks. That will remain the case as long as both $VIX and its 20-day moving average are below the 200-day moving average of $VIX.
- Overall, we have no sell signals in place and $SPX remains above support on its chart. Hence, we remain bullish.
Looking back, this was really an ordinary week in most indices, with S&P up 66 bps, NDX up 22 bps & RUT up 57 bps. But the stalwart was the Transports sector, up 3.6%. This led J.C.Parets to argue on BNN Bloomberg that the rotation helps the S&P to get to 4,000.
- J.C. Parets@allstarcharts – The relative strength in transports is real, and started at a perfectly logical place
![]()
4. Dollar, Commodities, China
Despite last Friday’s big action, the Dollar meandered this week, up Monday & Tuesday but down Wednesday-Friday. It closed down by about 30 bps on the week. But Gold did not benefit. Instead, Gold fell 4.5% with miners also down 4.5% & Silver fell 6.4% on the week. Oil did very little but Oil stocks rallied with OIH up 4.3% & XLE up 2.4%. Copper also rallied 2.4%.
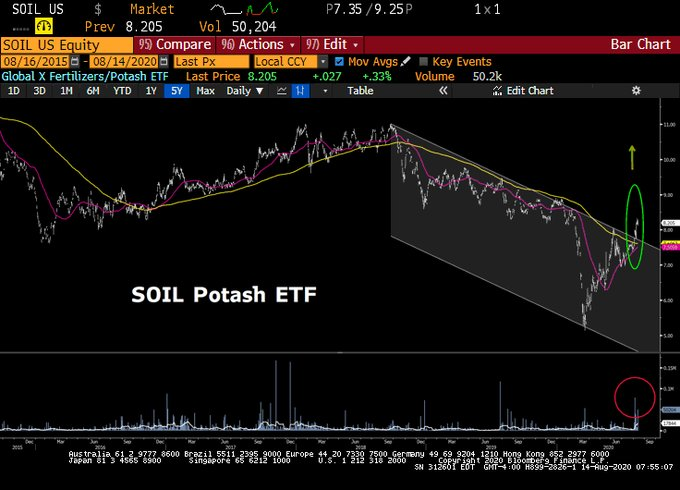
So which asset broke out this week?
- J.C. Parets@allstarcharts – Prior uptrend, multi-year consolidation, base breakout, new uptrend?
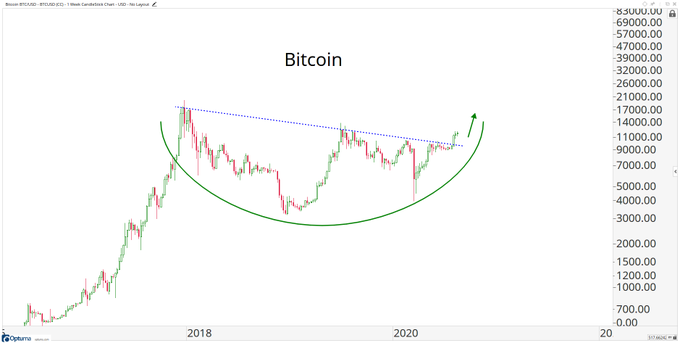
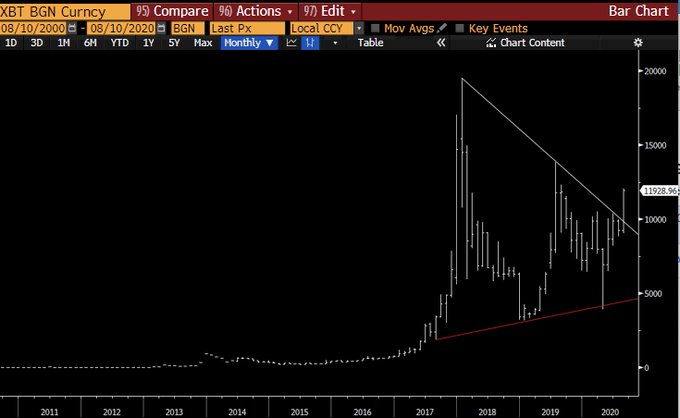
What about on a monthly chart?
- Raoul Pal@RaoulGMI – – I like to get the texture of a move by looking at the long-term charts. Bitcoin is a stunner. The monthly chart has only just broken out this month. It has a long way in time and price to go….
Remember “Buy Bonds, Wear Diamonds”, Raoul’s 2019 call? What is he really saying about Bitcoin?
- Raoul Pal@RaoulGMI – – These are all INCREDIBLY BULLISH long-term chart patterns. The probabilities in the charts suggest that Bitcoin is likely set to be the best performing major asset in the world over the next 24 months and by a big margin. I remain #irresponsiblylongbitcoin #bitcoin
But there might be something brewing out there, out east in the land of today’s crazy chutzpah!
- Lawrence McDonald@Convertbond – – Black Swan? There are reports of up to 30% of China´s agricultural output could be at risk. China facing food shortage after months of flooding, infestations. Xi’s description of food waste as ‘shocking and distressing’ could portend looming food shortage.
For a discussion about numbers, take a listen to the clip below:
Send your feedback to editor@macroviewpoints.com Or @MacroViewpoints on Twitter