Summary – A top-down review of interesting calls and comments made last week in Treasuries, monetary policy, economics, stocks, bonds & commodities. TAC is our acronym for Tweets, Articles, & Clips – our basic inputs for this article.
Editor’s Note: In this series of articles, we include important or interesting Tweets, Articles, Video Clips with our comments. This is an article that expresses our personal opinions about comments made on Television, Tweeter, and in Print. It is NOT intended to provide any investment advice of any type whatsoever. No one should base any investing decisions or conclusions based on anything written in or inferred from this article. Macro Viewpoints & its affiliates expressly disclaim all liability in respect to actions taken based on any or all of the information in this article. Investing is a serious matter and all investment decisions should only be taken after a detailed discussion with your investment advisor and should be subject to your objectives, suitability requirements and risk tolerance.
1.”reverse dispersion” month
Remember last week’s outperformance of IWC, Micro-cap ETF over IWM, Russell 2000 ETF, and in turn the outperformance last week of IWM over S&P? What happened to that this week? No follow through.
Look at the huge earnings beat of Amazon & Apple this past week. Those two stocks did explode up right after the earnings. But no follow through on that up move. Actually Apple closed negative on the week and Amazon gave up all its after market gains on Friday. A simple description is, but wait! Better to see the E-word from a DeMarkian:
- Thomas Thornton@TommyThornton – $SPX up 1 point on the week despite blowout earnings and crazy strong economic data. Throw in the President pitching $4 trillion in stimulus. Fair to say this market is exhausted.
All this makes more sense when we look at it month over month. Despite giving up all its after-market gains, Amazon was up 12% in April and GOOGL was up 14%. Apple was up 8% on the month. So FAAMG had already recovered from the sell off in Q1 prior to earnings. Similarly, the action in Russell 2000 last week merely took back its underperformance in the first weeks of April.
And then you have commodities. Copper was up 11.5% in April with FCX up 14%. Gold was 3.5% & Silver was up 6%. Oil was up 7% as well. With this outperformance of Copper over Gold, Rates should have shot up in April, right? Actually rates fell both across the long end and across the belly – 30-10 yr yields fell 10 bps & 7-5 yr yields fell 8 bps.
It is as if April reversed almost all of the excesses of Q1. And it did so without any real correction in any asset class. Did this mean anything & more importantly what does it suggest for the next month? As we were pondering this, we came across a @MacroChoices podcast with Nomura’s Charlie McElligott on Friday. Quickly we got an answer to the second part of our question:
- “It’s this reversal that we’re seeing over the course of April looks to probably continue to a certain extent into May and potentially even in June to a certain extent …”
OK, but was this a simple numerical reversal or does it signify a phase change of some sort? CM (with apologies to Mr. McElligott for shortening his wonderful name into a short acronym) described it as a “phase pivot” from recovery/reflation to expansion. Our simplistic understanding is that the pre-April period was a period of reflationary recovery and the correct trades for that period were short long duration Bonds, overweight high beta cyclical value and underweight secular growth.
CM describes April as “a big, kind of reverse dispersion month” that has “gone into the face of” of the reflation trade. Hmm, we thought Quants used Gamma vs Theta language and not one akin to a Antoine Winfield & Tyreek Hill conversation? Getting back to his “phase pivot from recovery to expansion” description, he added “I think we are currently capturing this transition into a much more
kind of diversified return story.”
But that is not merely what April has done. It featured rallies in just about every asset class. What has that done to sentiment? CM said in the @Macrovoices podcast:
- “So what we look at right now is the sentiment index that looks at a number of metrics from, you know, momentum, credit spreads, vol indicators, technicals. We have currently are running a score that since 2004, this US sentiment index is 99.6 percentile. Extreme, extreme, extreme, high, high sentiment across all of these various metrics, right.”
That reminded us of the discussion by @TommyThornton on @RealVision on Tuesday – “market sentiment remains extreme; daily sentiment indicators are at extreme levels; now seeing a very very large number of weekly exhaust signals ,,,, volume really light as if sellers are on strike“. Listen to this clip, we suggest.
So what happens to forward returns when sentiment across all asset classes is so high? CM said – “The one month forward return is just like 70 bps, and no excess return“.
2. FOMC, Treasuries
To us, the best comment about the FOMC was the tweet below:
- Tom Graff@tdgraff – A lot of changes made to FOMC statements are to acknowledge what we all see while justifying inaction.
Notice that none of the markets cared what Powell said on Wednesday. Stock Indices went up on Thursday and Treasury yields rose a bit. Stocks fell on Friday and Treasury yields fell a bit.
But one position was increased:
- Jesse Felder@jessefelder – ‘Short interest in the $12 billion iShares 20+ Year Treasury Bond exchange-traded fund (ticker TLT) now clocks in at 25% of shares outstanding, the highest since early 2017.’ bloomberg.com/news/articles/
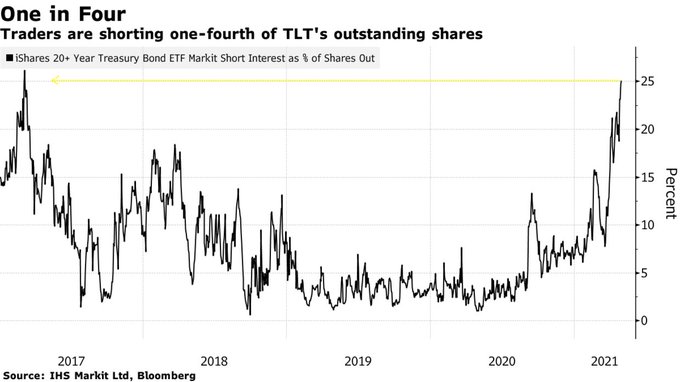
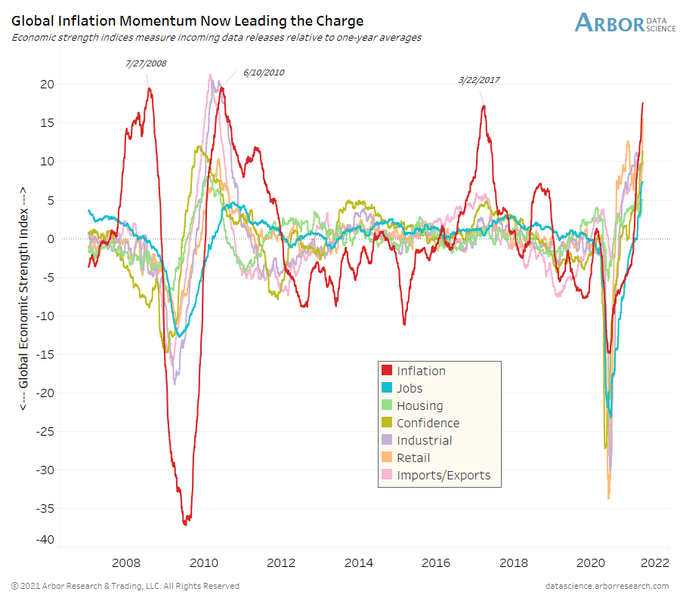
Surely that is consistent with inflation going up, right? But wait:
- Ben Breitholtz@benbreitholtz – Apr 29 – The momentum behind global inflation data releases is reaching extremes seen in July 2008, June 2010, and March 2017. Inflation expectations (i.e. TIPS breakevens) struggled over the ensuing months after each of these instances.
3. Stocks
In case you didn’t notice, Tom Lee’s 4200 target was reached on Thursday April 29 with the S&P closing at 4211. What about his 4400 target by June? That’s only 4.5% away with 2 months to go.
The immediate question is what happens next week? Simple folks like us look at history of the 1st week of May & old tired indicators like that. The smart ones tell us to focus on the wagging tail of a dog in relation to the movement of the dog’s belly button – the point being the magnitude of the movement is not the same but the same dance steps show up in both. Using this interesting & innovative market indicator (with Bitcoin as tail & stock market as belly button), Tom McClellan said on Tuesday, April 27 that
- “.. by the time the stock market gets to the end of this week, it should start echoing the upturn in Bitcoin not in terms of magnitude but in terms of direction & timing. I am expecting … going to mean in an upturn in stocks after we get past this week, after we get past the Fed announcement. “
Just in case people think we are kidding, below is the CNBC clip:
That brings us to our true & tried Lawrence McMillan of Option Strategist who wrote on Friday:
- “Equity-only put-call ratios continue to decline, and so they remain bullish indicators for the stock market. … After some flirtation with sell signals about two weeks ago, market breadth has regrouped and improved. Both breadth oscillators are on buy signals, albeit in only modestly overbought territory. … Meanwhile, the trend of $VIX is still downwards, since it is trading below its declining 20-day and 200-day moving averages. That is bullish for stocks.”
- “In summary, we remain bullish. Maintain a “core” bullish position. There are no confirmed sell signals at this time. The main things to watch are the trends of $SPX (upward) and $VIX (downward). As long as those are intact (i.e., as long as $SPX is trading above support [4,000 & then 3850-3870]), then the bulls have the upper hand.”
In a similar vein,
- Macro Charts@MacroCharts – Apr 28 – Said this last month: absolutely textbook strength, coming from all the right individual Stocks. Setups responding w precision & no hesitation – a major tell. Now Energy back on schedule, Cyclicals (even office REITs) ready to go, EU Banks engaged. “No stone left unturned” rally.
- Thomas Thornton@TommyThornton – Next week I will be adding to my recent energy positions. Long $XLE, $XOP, $OIH I figured we’d get some decent prices in the coming weeks
- “It’s not as easy now as just being short bonds, long inflation, long cyclicals. You’re really going to get some chop. And that, you know, we can speak to that later as far as kind of my more medium term, you know, one to three months view. A lot of these back tests tell us that there’s some chop coming with regards to themes, you know, between assets, sectors, and industries. … So it’s just kind of like this grinding 70 bps expected return when sentiment is this high. “
But what does he get when he looks at a “sustained period of high sentiment” :
- ” … we tested the 50-day rolling score of our sentiment index, when it was higher than 99.2 percentile, which just gave us more data points as you widen kind of the band. And what it showed was, you know, pretty remarkable. When you’ve sat in such a high extreme sentiment view for, you know, this 50-day period, kind of approximately, two and a half months of a trading month. The S&P three months median return is down 2.1% and there’s actually a negative excess return. So it actually underperformed where you would typically expect the market to do by a significant amount, which again, looking at this sentiment index, it tells us that we are probably going to go through this period of consolidation, maybe even a slight pullback on kind of a one month, three month window, just because we’re so overshot with regards to sentiment. …”
- ” .. there’s macro study, this sentiment study, this vol study that we’re looking at, are really telling me that there’s a kind of rotationally consolidation period as we transition the economic cycle and that makes sense to me.”
By the way, this fits with what Tom McClellan said in his clip above, the real clip which CNBC prohibits simple folks from watching. He said that after the upturn he sees next week, his indicators suggest a fall in the S&P in July. McClellan didn’t say why July but, as we all remember, the 1998 & 2007 summer selloffs did begin in July.
This year July comes after June, more precisely the FOMC meeting in June in which many including CM think “they’re going to begin to really start talking about tapering the asset purchases“. And after July comes August with its Jackson Hole Fed summit. So we could see lots of talk in June-July about a taper.
The term “chop” was also used by J.C. Parets who pointed out that a sideways chop has been seen in Year 2 of market cycles. He writes – “This environment continues to remind me of a lot of the “Year 2” of market cycles that we’ve seen before.” Read his article that provides charts going back to 1975.
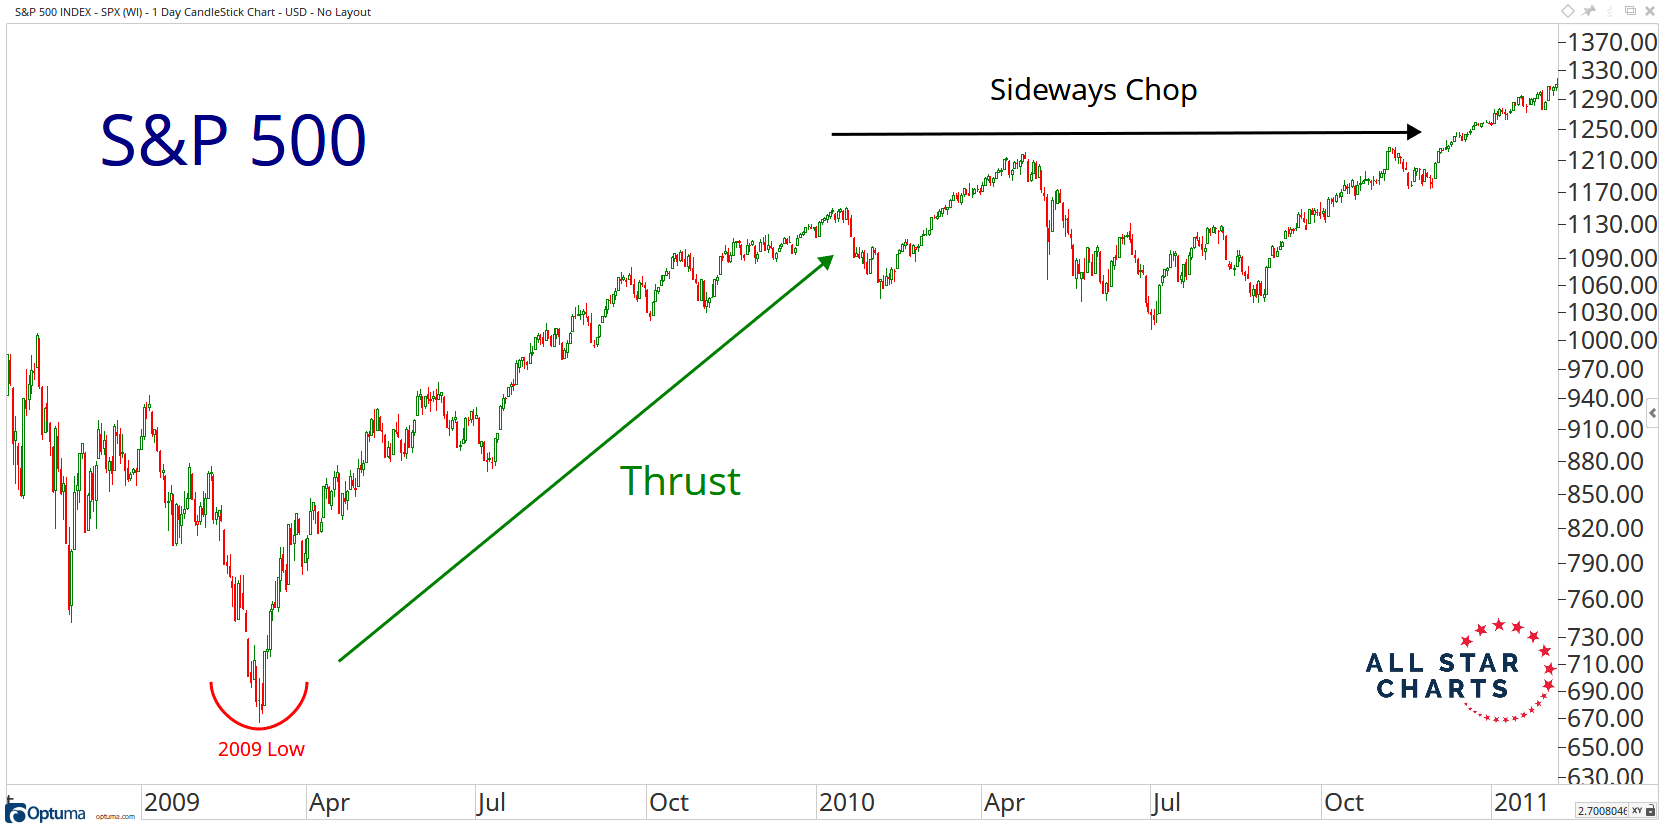
Notice the bottom in July in the above 2010 chart. His charts of 2004 & 1983 also show a bottom in July-August of those years.
Now moving to a more near-term focus, look at the cautionary clip of view of Carolyn Boroden as described by Jim Cramer. Simply put
- “she is raising the caution flag with the fatigue setting in & points to the next window for a pullback is in May (this week was her first window); her downside target is 4012 & if that is broken then to 3720 support … what’s her cue – if the 5-day exponential moving average of S&P crosses below the 13-day emv, then its the cue to get out of Dodge … “
4. India stocks
Last week, we asked Indian Stock Market – Is It Time To Get In? So far, the answer has been yes, both on absolute & relative to SPY basis. The 4 ETFs we track INDA, INDY, EPI & SMIN were up 2.5%, 2.2%, 3% & 3.1% respectively while SPY was up 2 bps.
Notice that these ETFs were up every day except Friday, the day President Biden announced his restrictions on non-citizen Indians coming to America. Our basic thesis was that the worst was nearly over and that the markets would figure that out early & before the psychology changes. That seems to be coming true.
- Reuters@Reuters – EXCLUSIVE India’s oxygen crisis to ease by mid-May, output to jump 25% – executive reut.rs/3u4bHsn
![]()
Notice the market rally began on Monday, April 26 while the Reuters article appeared on Thursday April 29. The bottom line of the article is:
- “India’s severe medical oxygen supply crisis is expected to ease by mid-May, a top industry executive told Reuters, with output rising by 25% and transport infrastructure ready to cope with a surge in demand caused by a dramatic rise in coronavirus cases.”
The crux of this treatment & hospitalization crisis has been shortage of Oxygen &, as usual, the transport system is to blame:
- “Medical oxygen consumption in India has shot up more than eight-fold from usual levels to about 7,200 tonnes per day this month, said Moloy Banerjee of Linde Plc (LIN.N), the country’s biggest producer.”
- “This is what is causing the crisis because no one was prepared for it, particularly the steep curve up,” Banerjee, who heads the company’s South Asia gas business, told Reuters on Thursday.”
- “A logistics crisis impeding the speedy movement of oxygen from surplus regions in eastern India to hard-hit northern and western areas would also be resolved in the coming weeks as more distribution assets are deployed, Banerjee said.”
His bottom line:
- “My expectation is that by the middle of May we will definitely have the transport infrastructure in place that allows us to service this demand across the country,” he said.
What about the toll?
- Minhaz Merchant@MinhazMerchant – Mumbai cases 3888, a gradual improvement from the 11000+ high of April 4. Maharashtra cases too dip to 62000 from 67000. #COVIDSecondWaveInIndia
These numbers are not great but the improvement is undeniable. The big difference between this wave and the first wave in 2020 is that this time, the middle & upper middle class was hit hard while the first 2020 wave mainly afflicted the lower middle class & poor. The upper middle class is urbane, articulate & understands how to use media to put pressure on the governments.
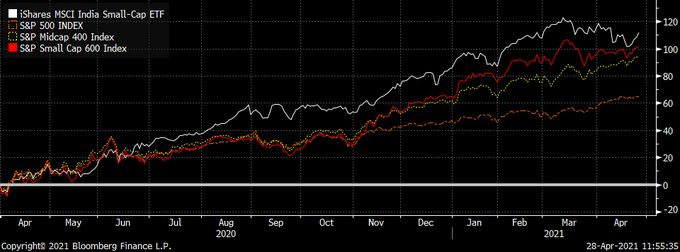
Getting back to the Indian market, look what has been leading this year- the iShares India Small-Cap ETF:
- Richard Bernstein@RBAdvisors – We all know the #COVID tragedy taking place in #India but few people know India’s small cap #stocks with their huge cyclical exposure are actually soaring. (Measured in USD, too!)
And how did our favorite Indian ADR perform this week? IBN (ICICI Bank ADR) was up 7.6% this week. India is still at a stage where Banks are secular growth stocks with 20%+ loan growth rates.
PS: The discussion about relative magnitude of movements of belly button vs. tail of a dog somehow jogged the memory of a lovely Mermaid Tales (Belly Dance) clip from a Artur Xasanov of Petrucho Studio about a woman named Samira. For those who welcome a stock analyst named Samir on their shows, this will reaffirm the Sanskrut linguistic lesson that adding “a” makes a male name feminine. The clip below is included on a 100% voluntary & freedom of artistic content basis :
Doesn’t this again make the case that YouTube should be spun off in an IPO? How we wish “handsome” Pichai & the Board concur? For those who didn’t get it, “Sundar” literally means handsome & its feminine “Sundari” means beautiful bringing to mind Sundari.com & its story of Beauty being an endeavor, a journey that millions of women over thousands of years have taken.
Send your feedback to editor@macroviewpoints.com Or @MacroViewpoints on Twitter