Summary – A top-down review of interesting calls and comments made last week in Treasuries, monetary policy, economics, stocks, bonds & commodities. TAC is our acronym for Tweets, Articles, & Clips – our basic inputs for this article.
Editor’s Note: In this series of articles, we include important or interesting Tweets, Articles, Video Clips with our comments. This is an article that expresses our personal opinions about comments made on Television, Tweeter, and in Print. It is NOT intended to provide any investment advice of any type whatsoever. No one should base any investing decisions or conclusions based on anything written in or inferred from this article. Macro Viewpoints & its affiliates expressly disclaim all liability in respect to actions taken based on any or all of the information in this article. Investing is a serious matter and all investment decisions should only be taken after a detailed discussion with your investment advisor and should be subject to your objectives, suitability requirements and risk tolerance.
1.Support levels?
SPY closed on Friday very slightly above its 50-day moving average. Why is this worth noting? Because Ryan Detrick tweeted that the “50-day MA has been support all year” and asked “will it continue?“.
The 50-day might have held but a “week-long triangle” was broken this week & that brings up the next support level:
- Mark Newton@MarkNewtonCMT – Near-term break of this week-long Triangle in S&P gave way to addtl weakness & likely to test the key 4401-4 area into FOMC which is initial support to this pullback
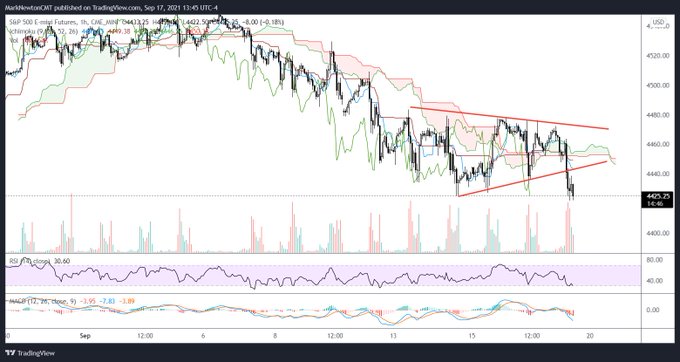
Lawrence McMillan wrote about his support levels on Friday:
- “For now, $SPX has tentatively found support near 4435. But that only occurred this week, so it is hardly seasoned or tested. The first truly tested support area is still the major one at 4370, and that is not too great of a distance from today’s levels. As long as the support at 4370 holds, the bulls are still in control although it might not completely seem like it right now. A violation of that support area, though, would change things in a negative manner.”
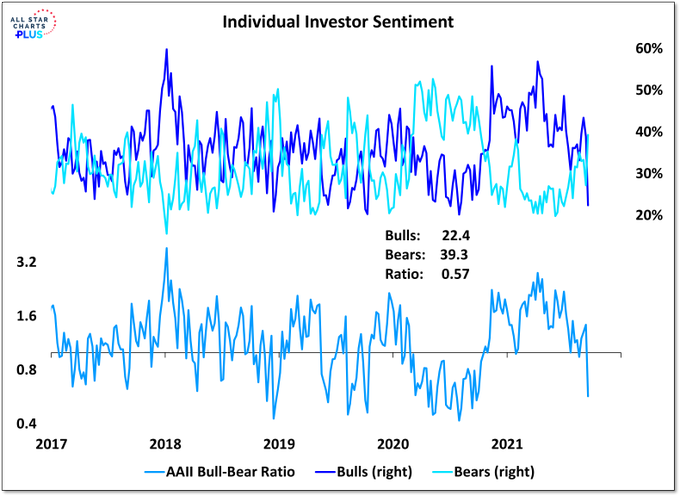
The S&P was down about 57 bps this week with the NDX down 70 bps, the worst among major indices. Yet, it felt so bad! Is that what is measured in what they call “sentiment”?
- Willie Delwiche@WillieDelwiche – Sentiment unwind is happening, fast: AAII bears rise to highest level since Oct 2020, bulls drop to lowest level since Jul 2020.
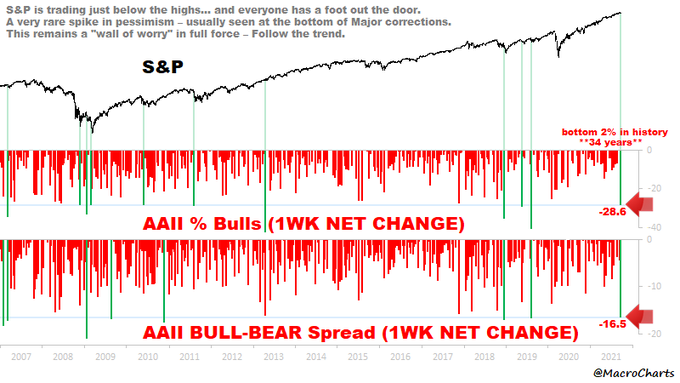
Some argue this pessimism is actionable:
- Macro Charts@MacroCharts – Everyone has a foot out the door. AAII Sentiment plunged this week – among the fastest drops in history. Spikes in pessimism are very rare – this time all it took was a 2% pullback. This remains a “wall of worry” in full force – Follow the trend.
J.C. Parets constructed his own composite chart by combining “3 seasonal patterns into one: The Annual Seasonality Cycle, Every Post-Election Year and Every Year Ending in 1, as part of the Decennial Pattern.”
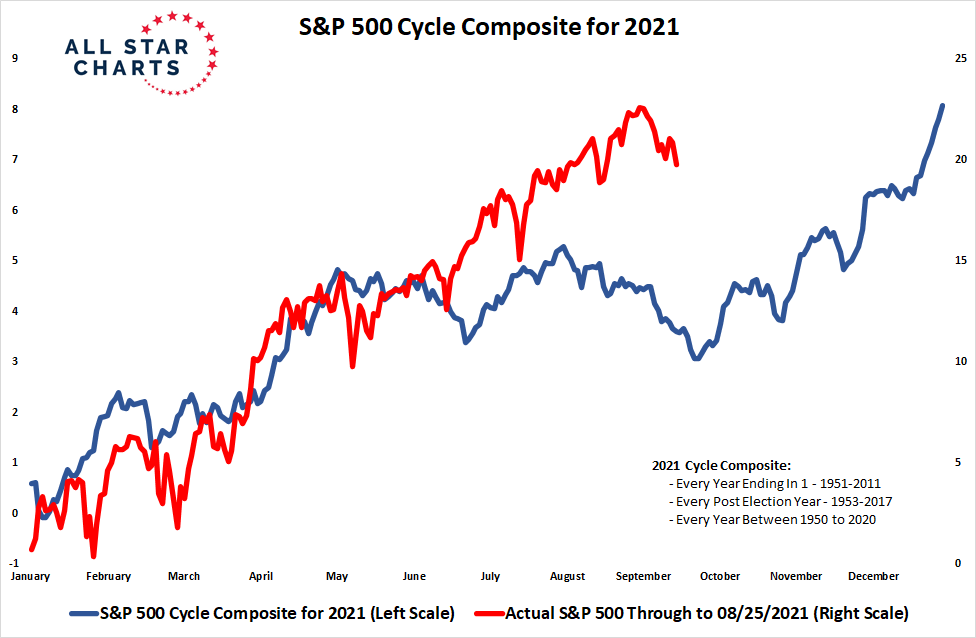
He wrote “As you can see, we’re getting close to the end” and posed “Are we almost done with this correction and we’re about to rip into the end of the year?“
Michael Hartnett of BAML reminded everyone about the huge influx of cash that came into stocks & bonds raising the following question:
- Ryan Detrick, CMT@RyanDetrick – Are you confused yet? Last week saw…. * The largest weekly drop in AAII bulls since August 2019. * The largest inflows to global equity funds ($51B) since March 2021 (EPFR data). Buy the dip, but be scared doing it I guess?
Weird comment from him because he himself had tweeted a reason to not buy:
- Ryan Detrick, CMT@RyanDetrick – One of the worst parts of the year for stocks historically is the last part of September. 2021 has laughed at most of these seasonal warnings, but worth at least knowing.
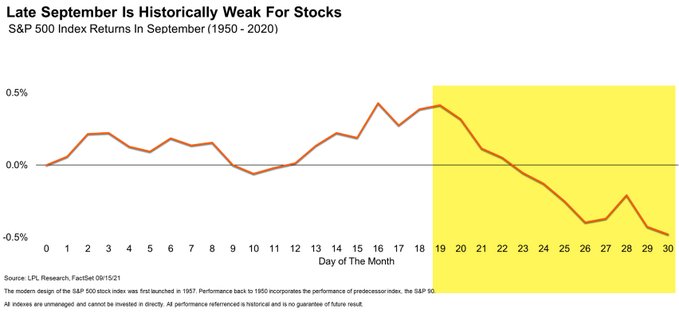
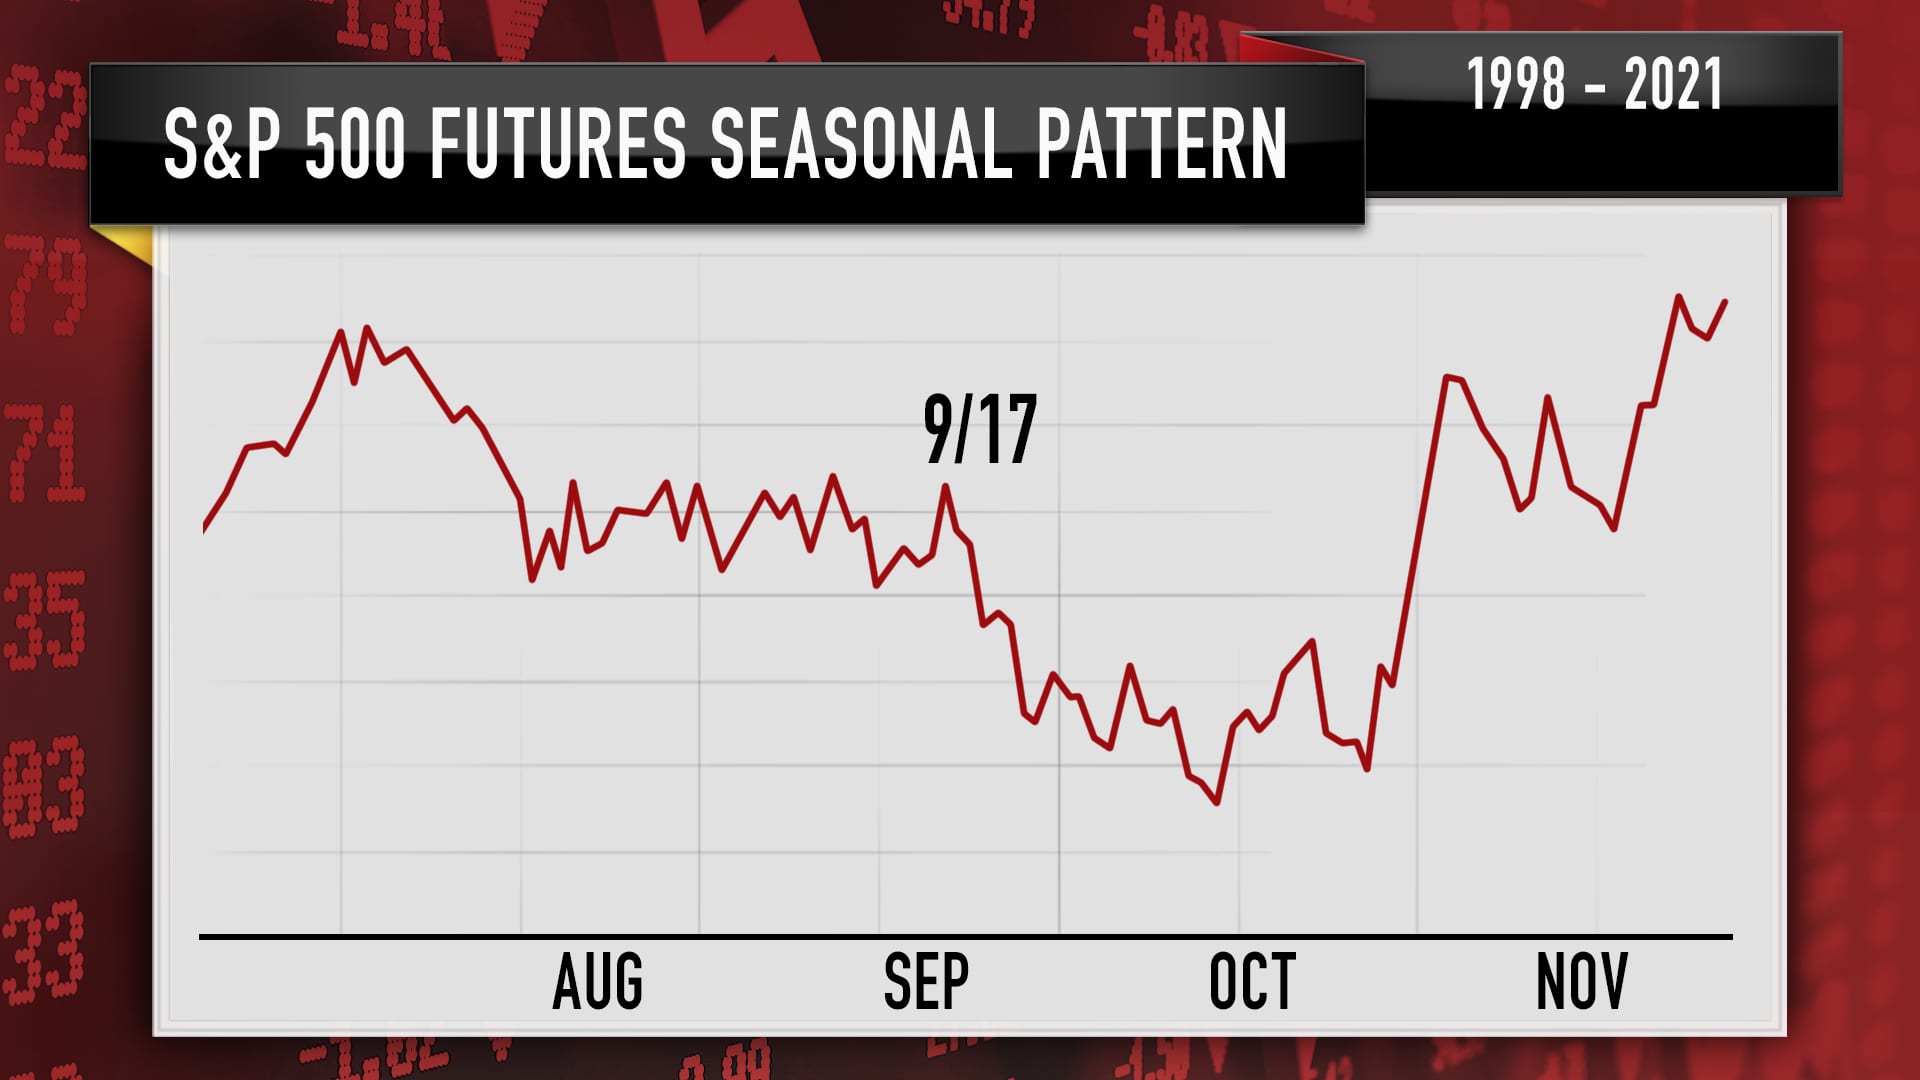
Jim Cramer also reiterated the seasonal pattern communicated to him by Larry Williams the week before. That called for traders to sell the S&P on Friday, September 17 into October. That seasonal pattern is reproduced below for convenience:
On the other hand & despite all the fear & sentiment declines, the VIX fell by 67 bps this week to close at 20.81. Lawrence McMillan of Option Strategist wrote about it on Friday:
- The $VIX “spike peak” buy signal of August 19th remains in place. As one can see from the chart in Figure 4, $VIX has risen a bit, but there is definitely no spike. The trend of $VIX remains friendly to stocks as well.
And then we have the FOMC next week!
2. FOMC & Rates
Look what the Treasury curve did this week:
- 10-yr yield rose by 3 bps; 7-yr rose by 4.5 bps; the 5-yr rose by 5.2 bps; the 3-year rose by 3 bps while the 30-yr yield fell by 3 bps
What does this flattening suggest? A tighter Fed? That sounds like a joke, right? On the other hand, look what our favorite indicator, performance spread between leveraged credit funds & unleveraged credit ETFs, did this week:
- Leveraged DPG fell 6.5% & UTG fell 2.9% while unleveraged ETFs HYG & JNK rose by 19 bps & 32 bps
Just as we were about to say “hmmm”, we saw the following:
- Macro Charts@MacroCharts – Time to really think about: • Portfolio exposure (& sensitivity) to Rates • Stocks most vulnerable • Stocks most well-positioned to benefit Most managers are not prepared for this shift – which could be a Major opportunity. Have a good weekend.
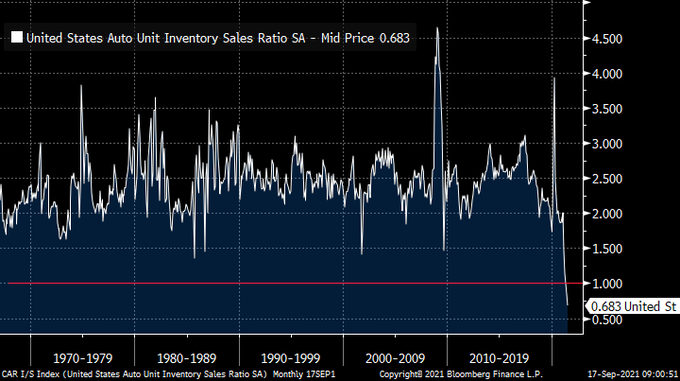
Is there anything in the real economy that might point in that direction?
- Richard Bernstein@RBAdvisors – US #Auto inventory/sales ratio falls below 1.0 for the first time…EVER! Hard to imagine the #economy meaningfully slowing with this backdrop.
All this makes next week’s FOMC meeting & the Powell presser even more interesting. Not only would the FOMC statement & the Powell presser be interesting but even more so would the reaction of markets.
3. So what to buy?
The suggestion below is an interesting one ahead of next week’s FedEx earnings & the FOMC-Powell meet:
- J.C. Parets@allstarcharts – I was taught in my career that you want to buy new 6-month lows within strong structural uptrends. The Dow Jones Transportation Avg just went out at new 6-month lows.
![]()
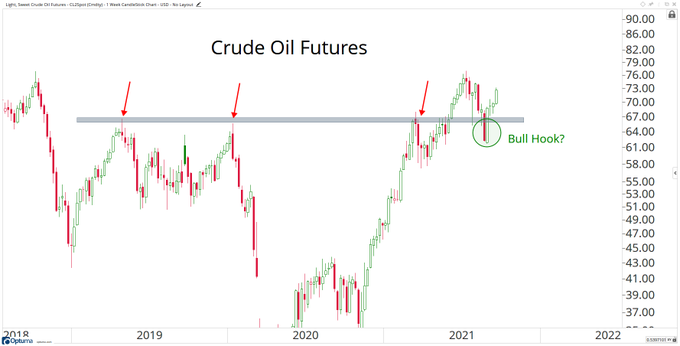
Usually transports have a negative correlation with oil. But does that remain valid when the demand for oil & transports comes from a strengthening global economy? Is that why the crude oil chart speaks to Mr. Parets?
- J.C. Parets@allstarcharts – Bear Traps. @Convertbond
If that isn’t enough, the tweet below suggests a secular long term growth rate for energy:
- Lawrence McDonald@Convertbond – Oil is approaching $80 a barrel and there are still 200 million people in India* without access to electricity and 1 billion people in China* without an automobile. *Colossal future demand for energy, the fastest growth on earth.
So does that “colossal future demand” also suggest a multi-year outperformance of energy over techs?
- Richard Bernstein@RBAdvisors – Earth transportation > #space transportation. The last time #crude prices rose this much relative to drilling capacity (1999/2000) #Energy outperformed #Tech for …. a DECADE!!!!
Send your feedback to editor.macroviewpoints@gmail.com Or @MacroViewpoints on Twitter