Summary – A top-down review of interesting calls and comments made last week in Treasuries, monetary policy, economics, stocks, bonds & commodities. TAC is our acronym for Tweets, Articles, & Clips – our basic inputs for this article.
Editor’s Note: In this series of articles, we clude important or interesting Tweets, Articles, Video Clips with our comments. This is an article that expresses our personal opinions about comments made on Television, Tweeter, and in Print. It is NOT intended to provide any investment advice of any type whatsoever. No one should base any investing decisions or conclusions based on anything written in or inferred from this article. Macro Viewpoints & its affiliates expressly disclaim all liability in respect to actions taken based on any or all of the information in this article. Investing is a serious matter and all investment decisions should only be taken after a detailed discussion with your investment advisor and should be subject to your objectives, suitability requirements and risk tolerance.
1.”Bonkers“!
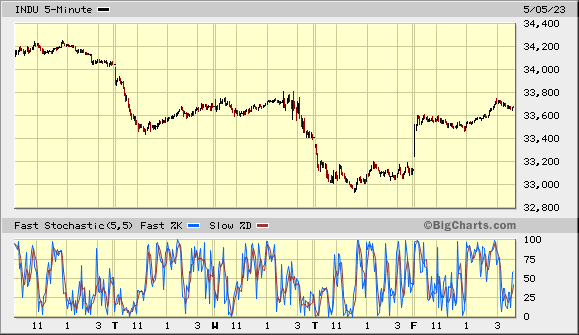
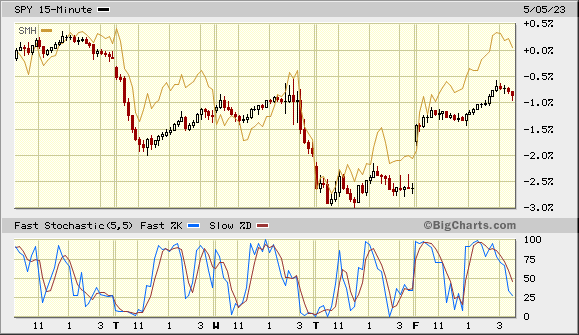
All week it felt as if the much-awaited sell off was at hand. The climax of this sentiment came around noonish on Thursday. Then presto!
First this bounce on Thursday noonish seemed like “bonkers”. Then we saw strength in European ETFs & boom – it reminded us of what Jeff DeGraff had said to CNBC’s Mike Santoli the week before:
- “Keep in mind how much better global indices look than the US indices … the breadth we are seeing globally is more important about the economic outlook, about the health of the market … “
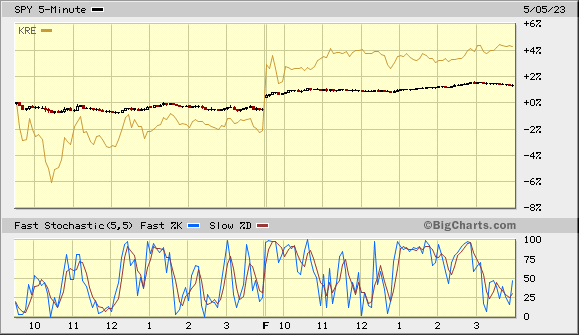
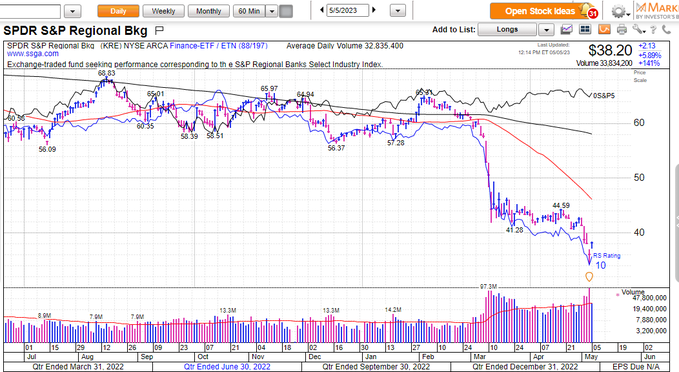
We also saw KRE stabilize vs. SPY from about 10:30 ish on Thursday. KRE beat SPY right from the open on Friday. But is this KRE bounce believable?
That’s why we follow smart people. Look what we saw on Friday after the close:
- Mark Newton CMT@MarkNewtonCMT – Fri May 5 – Today’s reversal is important for #Banks and coincides with a S/T cycle that ive been tracking- This also coincides with DAILY AND Weekly DeMark exhaustion for $KRE – I am out at my daughters college graduation, but put out a short note to discuss short-term market analysis as a… Show more
Then we saw the following on Sunday evening:
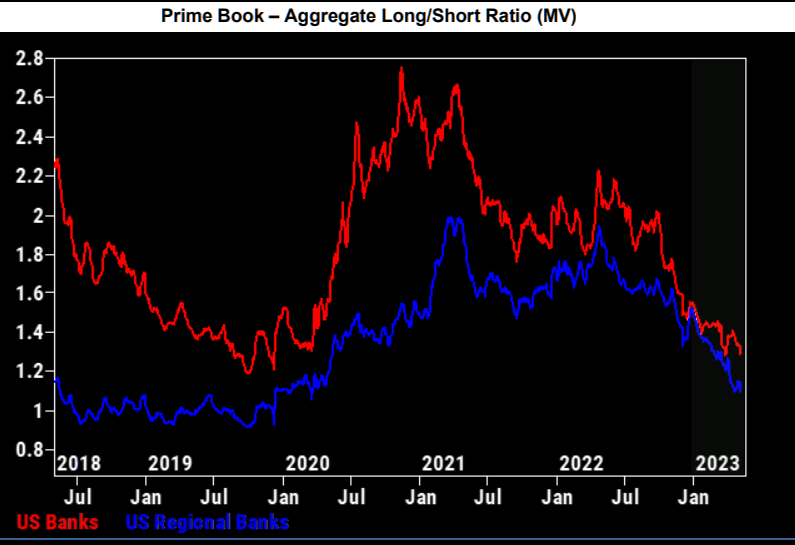
- Via The Market Ear – Got regionals? Everybody hates this space. Let’s see what happens should they squeeze it for another day or two… Source GS
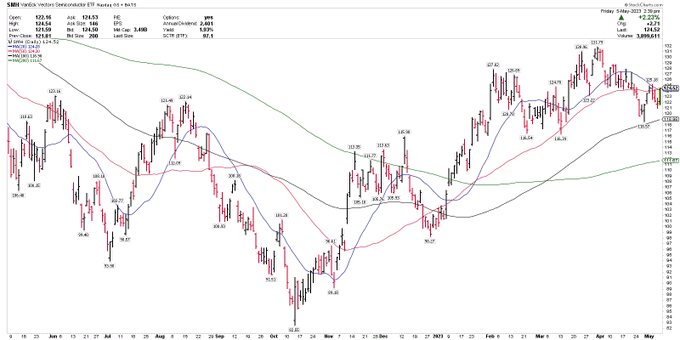
Last week, we had explored Semis as a long from its current selloff. How did SMH behave this week, especially relative to S&P?
This is especially positive given two earnings blowups this week:
- Larry Tentarelli, Blue Chip Daily@LMT978 – May 5 – $SMH held the 100-sma so far.
Pending higher for the week, trying to close > 50 & 20-sma. In a week where $AMD and $QCOM sold off sharply after earnings. When stocks move higher on bad news, that is a bullish price signal.
Not exactly all bad news given the news that Microsoft was teaming up with AMD to develop a new AI-focused chip to combat NVIDA’s dominance. This sort of reminds us of the old adage about buying railway equipment manufacturers instead of choosing a winner among competing railroads. With that in mind, we urge all to read our summary of the superb clip of Bloomberg’s Anuraag Rana last week on AI & the resultant spending on Cloud. Remember all that runs on chips & the newer/faster the better.
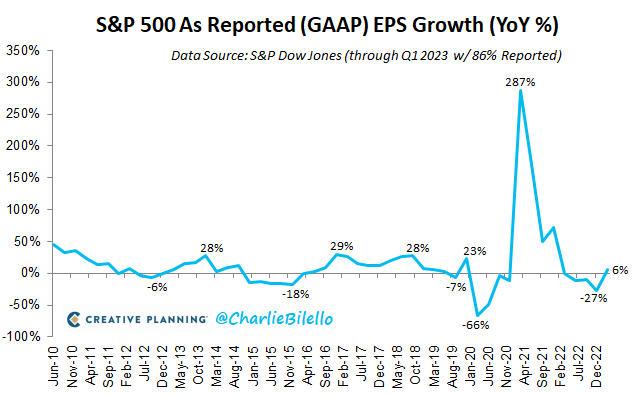
But what about the broader earnings picture across the S&P 500?
- Charlie Bilello@charliebilello – May 4 – With 86% of companies now reported, S&P 500 GAAP earnings have come in much better than expected, flipping the YoY growth rate back into positive territory (+6% YoY) for the first time since Q1 2022. $SPX
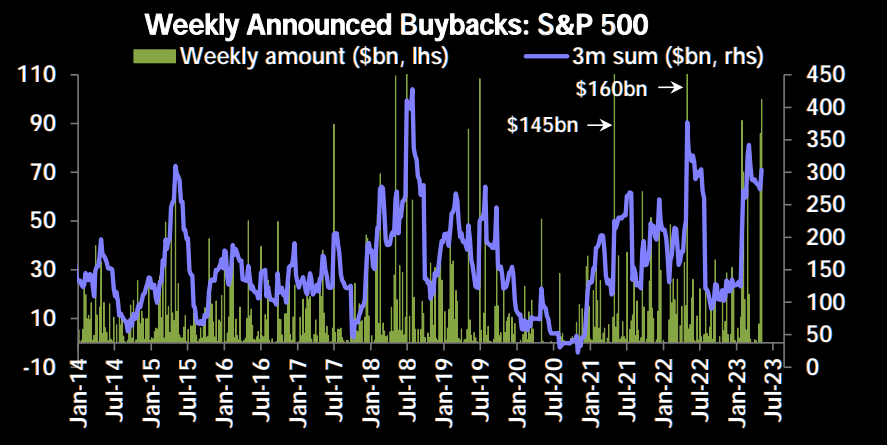
Wait a minute! What happens after earnings are reported? Doesn’t the BuyBack window open? But how much can there be left to buy?
- Via The Market Ear on Sunday – Boom boom buybacks – Buyback announcements have continued to boom…almost $200bn worth in the last 3 weeks. Source Deutsche
Then who was selling this week?
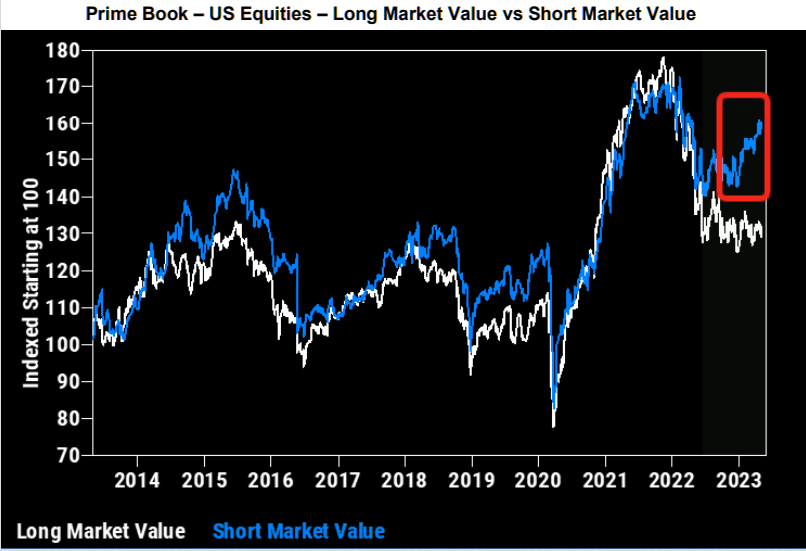
- Via The Market Ear -Sunday – Selling and selling – Goldman’s PB was net sold for the 3rd week in a row and saw the largest net selling in three months…note short selling was the main driver, not selling of longs… Source GS
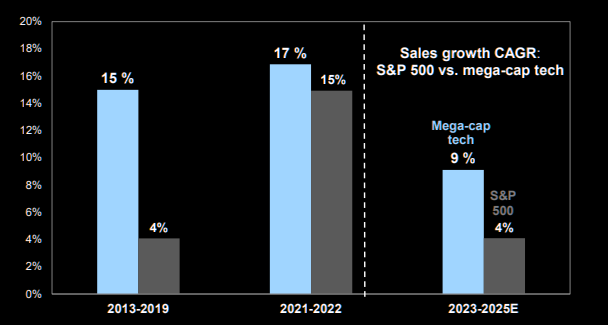
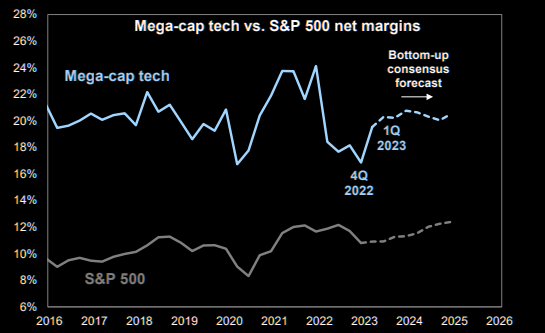
We all know that the rally is a narrow one & dominated by mega-cap techs. But is that dominance rational at least to some extent?
- Via The Market Ear – Sunday – Mega-cap tech fundamentals getting even better
– Consensus expects mega-cap tech’s sales growth gap to widen (chart 1) and the gap between mega-cap tech & S&P 500 margins is also expected to widen (chart 2). Source Goldman
We saw a real life example of this with Apple’s earnings on Thursday. Of particular note was Tim Cook’s multiple mentions of Apple in India. Frankly, we get sick of the 1.4 billion people throw away line. The reality is, based on Indian media figures, only about 10 million Indians (out of 1.4B) account for 50% of consumer spending in India. But that is more than ample for Apple to grow because Indians are even more voracious spenders than Americans. And Indian parents can’t let their kids get embarrassed at school. We keep hearing of 10-yr old kids demanding Apple iPhones from parents to avoid getting laughed at by their friends.
Finally getting back to regional banks & the awful prognostications of terrible consequences, we wonder whether what we experienced in the last few weeks is possibly a version of the 1998 LTCM selloff? While frightening in its scope, that sell-off was restricted to the financial sector. So when Greenspan responded by cutting rates 3 times, we got 1999.
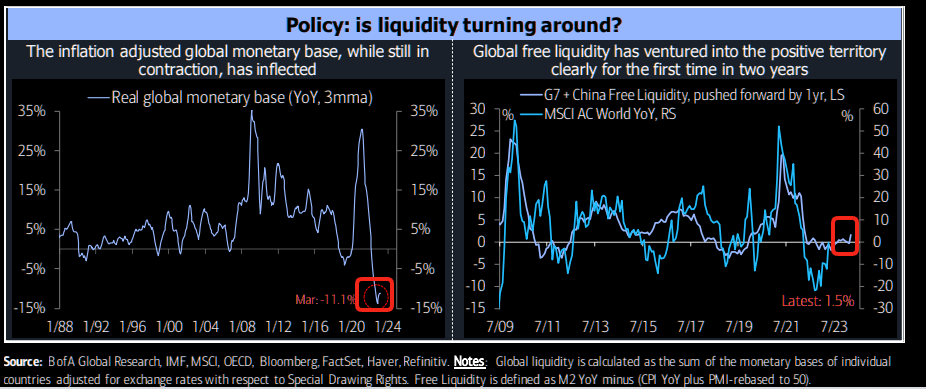
There is no way we can see even a small version of that, is there? Look what we saw on Sunday?
- Via The Market Ear – Friday May 5 – Liquidity – green shoots? BofA writes: “…global free liquidity – measured as the gap between money supply and nominal economic growth – is now clearly in the positive territory for the first time in two years, implying positive returns in the next year.” Source BofA
So the worst of the regional banking crisis may be behind us; S&P earnings are fine; MegaCap tech fundamentals getting better & Semis are rallying. And now global free liquidity is clearly positive for the first time in 2 years? Are we “bonkers” or doesn’t this even slightly remind you on post-LTCM kind of environment?
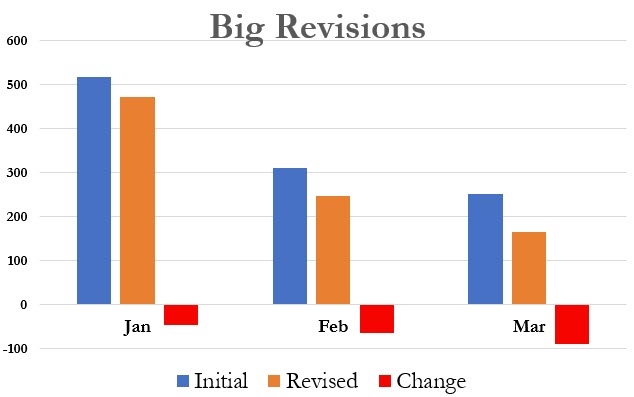
And the employment situation that turned down in July 2007 is still not to be found:
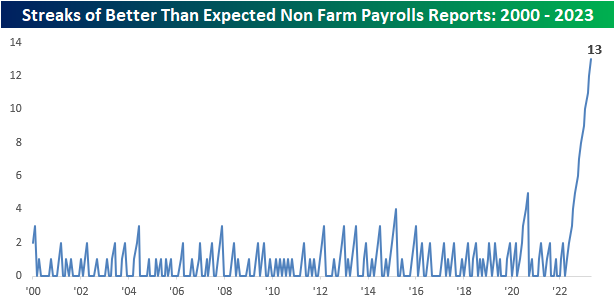
- Bespoke@bespokeinvest – Fri – This chart is bonkers. Non Farm Payrolls has now exceeded expectations for a record 13 straight months. https://bespokepremium.com/interactive/posts/think-big-blog/bespokes-morning-lineup-5-5-23-unlucky-thirteen
No wonder Mr. Deemer turned from a bearish tone mid-week to what he tweeted on Friday, around 11:00:
- Walter Deemer@WalterDeemer – Fri – 87.5% upside day at 11 am. UVOL/(UVOL+DVOL); Lowry’s definition. Data per http://wsj.com. See https://docs.cmtassociation.org/docs/2002DowAwardb.pdf for explanation. Can also follow @HamzeiAnalytics
2. But?
Look what might eventually make the BeSpoke chart “un-bonkers”:
We do think that Powell would need to see some signs of employment slowdown before even pausing verbally. And that might require, a la 2007, the current interest rate stress morphing into a credit stress. Until then, we can only extrapolate from previous Fed commentary a la:
And,
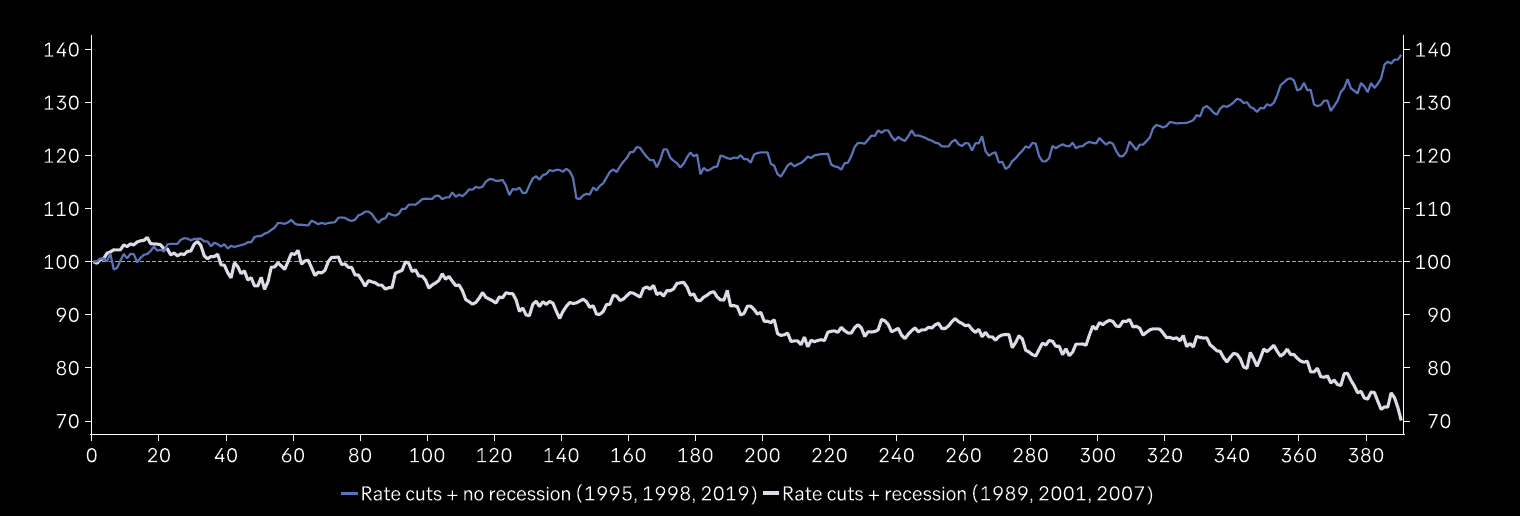
But didn’t Powell wait too long to raise rates? If so, wouldn’t Powell wait too long to cut rates? That might prove bad if he does end up cutting rates late. Just remember 2007 August & Cramer’s “They know nothing” rant!
- Via The Market Ear – Friday – Cuts in time or too late… Huge difference between rate cuts in time and rate cuts too late. Source Macrobond
3. Commodities
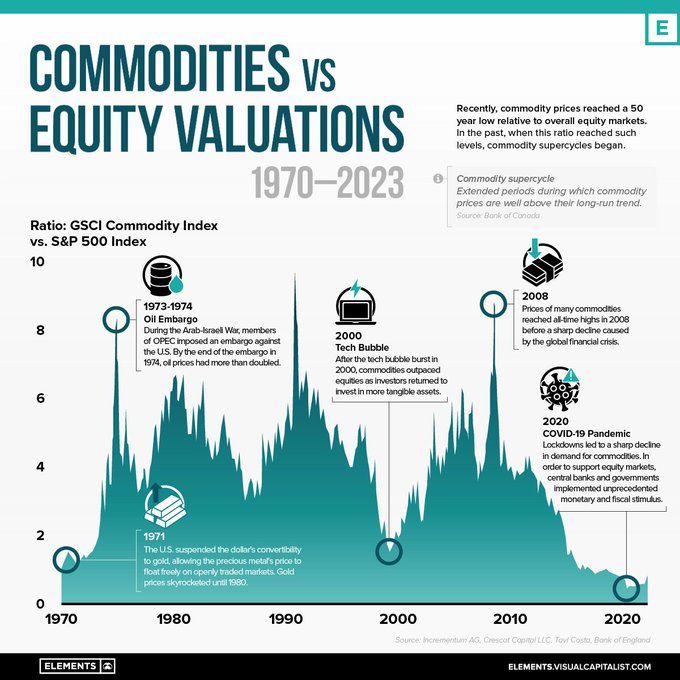
Remember what happened to commodities post-LTCM?
- Jesse Felder@jessefelder – May 2 – ‘In recent years, commodity prices have reached a 50-year low relative to overall equity markets. Historically, lows in the ratio have corresponded with the beginning of new commodity supercycles.‘ https://visualcapitalist.com/charted-commodities-vs-equity-valuations-1970-2023/ by @VisualCap
That brings us to:
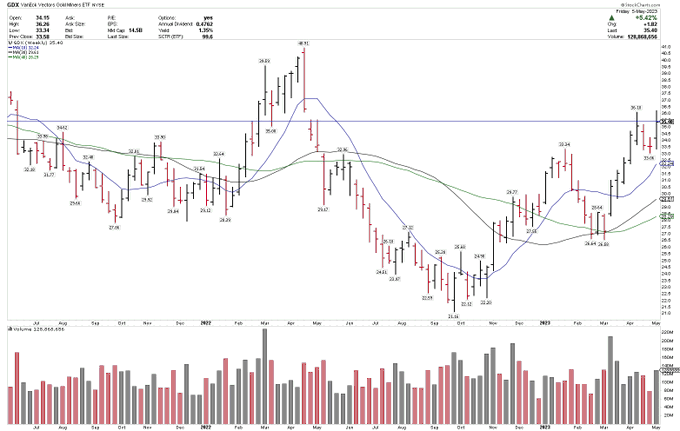
- Larry Tentarelli, Blue Chip Daily@LMT978 – Sat May 6 – $GDX new 52w-weekly closing high above average volume rising MAs heavy upside volume over the last 8 weeks.
And to:
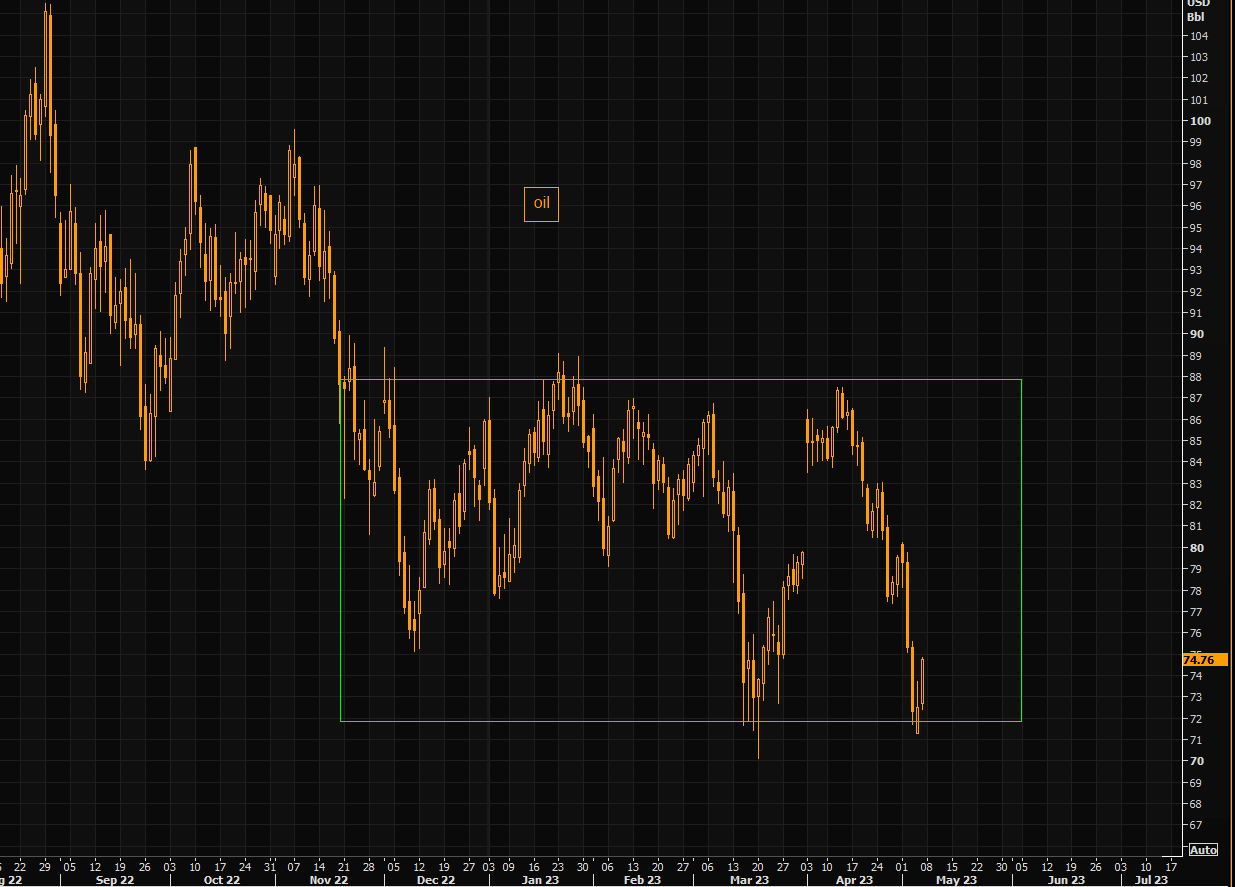
- Via The Market Ear – Fri – Oil is “back” – Oil continues the bounce move, putting in the biggest up candle in a very long time. So far a great reversal inside the range where most continue buying highs and puking lows (more from yesterday’s thematic email here). Mean reversion requires the “opposite” thinking. Source Refinitiv
Kentucky Derby is now behind us. Mid-May is ahead of us. Marinas & Golf courses are beginning to open & will be all open by Memorial Day. Is that good seasonal cheer why they keep saying Buy in Mid-Way & Sell in August? Of course, we have inflation numbers ahead of us before we get to mid-May!
Send your feedback to editor.macroviewpoints@gmail.com Or @MacroViewpoints on Twitter
