Summary – A top-down review of interesting calls and comments made last week in Treasuries, monetary policy, economics, stocks, bonds & commodities. TAC is our acronym for Tweets, Articles, & Clips – our basic inputs for this article.
Editor’s Note: In this series of articles, we include important or interesting Tweets, Articles, Video Clips with our comments. This is an article that expresses our personal opinions about comments made on Television, Tweeter, and in Print. It is NOT intended to provide any investment advice of any type whatsoever. No one should base any investing decisions or conclusions based on anything written in or inferred from this article. Macro Viewpoints & its affiliates expressly disclaim all liability in respect to actions taken based on any or all of the information in this article. Investing is a serious matter and all investment decisions should only be taken after a detailed discussion with your investment advisor and should be subject to your objectives, suitability requirements and risk tolerance.
1.Markets Last Week
US Indices:
- VIX up 3.6%; Dow down 54 bps; SPX up 1.6%; RSP down 84 bps; NDX up 3.5%; SMH up 6.3%; RUT down 1%; IWC down 92 bps; MDY down 74 bps; XLU up 14 bps;
Key Stocks & Sectors:
- AAPL up 7.9%; AMZN down 36 bps; GOOGL up 1.4%; META up 2.3%; MSFT up 4.4%; NFLX up 4.5%; NVDA up 9.7%; MU up 8.1%; BAC down 1.4%; C down 1.6%; GS down 2%; JPM down 3.1%; KRE down 2.5%; EUFN down 7.6%;
Dollar was up 76 bps on UUP & up 57 bps on DXY:
- Gold up 1.6%; GDX down 59 bps; Silver up 1.1%; Copper up 87 bps; CLF minus 5.7%; FCX down 2.3%; MOS down 4.2%; Oil up 4.3%; Brent up 4.3%; Nat Gas down 1.7%; OIH down 2%; XLE down 2.4%;
International Stocks:
- ACWX down 2.8%; EEM up 45 bps; FXI down 1.4%; KWEB down 17 bps; EWZ down 4.7%; EWY up 1.4%; EWG down 6.1%; INDA up 2.2%; INDY up 1.1%; EPI up 3.2%; SMIN up 4.8%;
And interest rates moved down for the week in what might be the “most notable” action among markets;
- 30-year Treasury yield down 20.7 bps on the week; 20-yr yield down 18 bps; 10-yr down 22 bps; 7-yr down 23.5 bps; 5-yr down 22.4 bps; 3-yr down 23.1 bps; 2-yr down 18.5 bps; 1-yr down 13 bps;
- TLT up 3.4%; EDV up 4.8%; ZROZ up 6%; HYG up 27 bps; JNK up 23 bps; EMB up 90 bps;
2. Is the most notable action also the most chartable?
- CyclesFan@CyclesFan – Sun – $TLT – Finally closed above the 20 week MA which confirms that it made an int. term low in April. I expect it to rally to the late 2022 high around 110 in Q3. When? Probably at the next turning point of this 30 week cycle, in the last week of July, after the next FOMC.
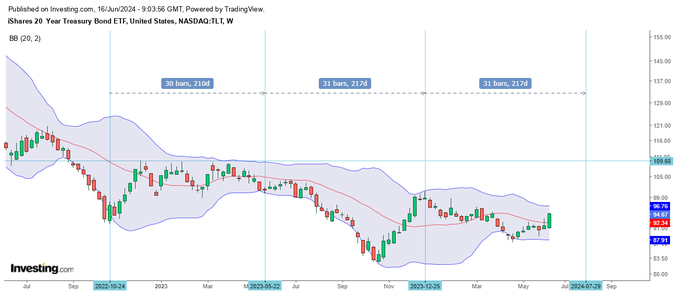
And a weekly MACD crossover!
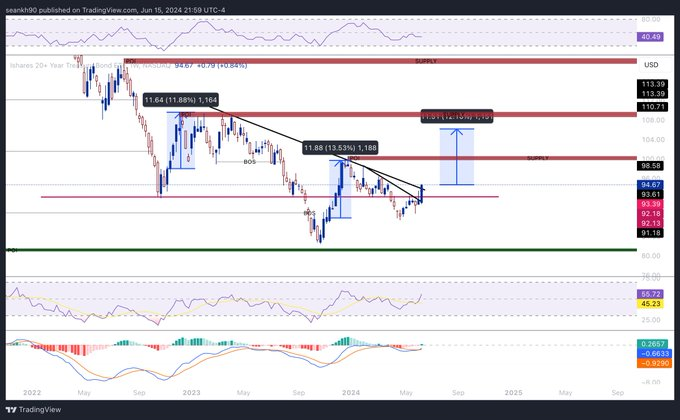
- Sean Khatibi@Sean_khatibi – Sat – $TLT weekly MACD cross overs have been quite powerful. Last two times we had 11-13% runs. Is $TLT going to print a higher high vis a vis December 2023 ?! Retail Sales on Tuesday and more concerns about normalisation of US Economy could be the catalyst. Perhaps a Sept Cut?!
Is it possible to have an emphatic comment without the almost proverbial “Mother” reference?
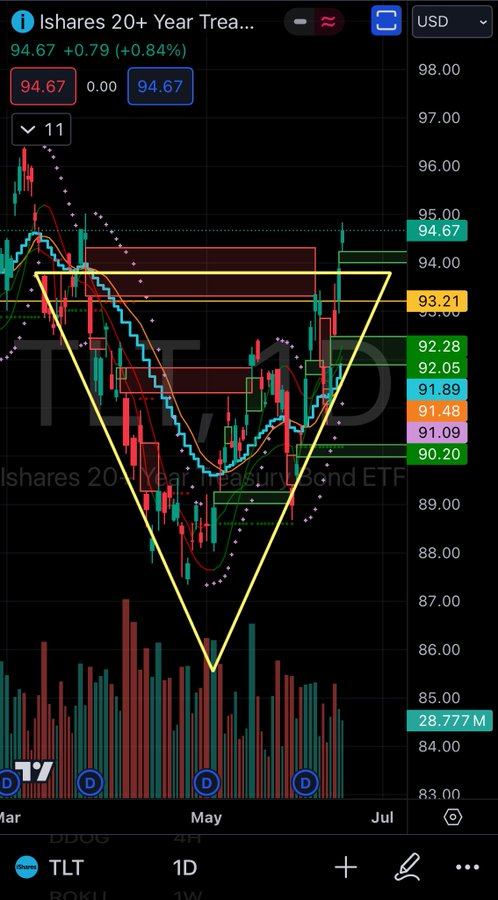
- Wandering Capitalist@Venturinglist – Jun 15 – $TLT just made the mother of all island bottom reversals. It gapped up to invalidate the mother of all down gaps from months ago. BULLISH cc @PeterReznicek @fundstrat @2kaykim
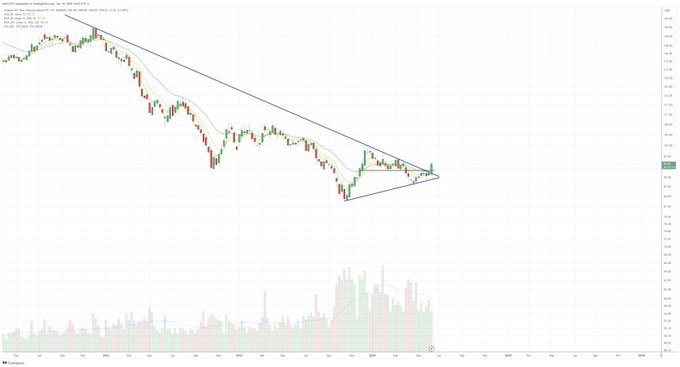
And the simplest of all:
- kpak@kpak82 – Jun 14 – $TLT (weekly) breakout
3. “apocalypse” postponed“? There or “never-ending …” Here?
In this case, as we heard it, the apocalypse reference was to fears of investors finally refusing to buy US Treasuries. And that reference came from the musical side of CNBC’s Steve Liesman. What drove him to shed his fears of the apocalypse? Rick Santelli giving two successive A-grades to this week’s 10-yr & 30-yr Treasury auctions.
When has Jim Cramer proved less verbose & less emphatic than Steve Liesman? No need to think. It was this past week. Yes, the same Jim Cramer who roared on national TV saying “they know nothing” about the Fed. Here is what the gentle avataar of Cramer said the evening before the Fed Wednesday:
- “consider the stock of CLF – that is getting clobbered; down almost 26% for the year & off about $8 from its $23 peak; … Nucor is down almost 10% for the year; … represents lack of demand that will lower prices for many goods down the road; iron ore is down big too; .. property-casualty insurance prices are finally rolling over… commodities – lumber rolling over; iron ore rolling over; nickel rolling over; wheat, sugar getting clobbered; corn is down big; cotton is down big from its 2024 high; even copper, the most integral of data center costs, is getting pummeled; – so much for the copper super cycle; ..autos next? too many pieces of cars coming down in price… commodities don’t weaken like this unless there is a problem with demand … these are brown sprouts … “
Why is it that CNBC usually hides the really interesting clips of Cramer on Mad Money? Others are pointing to different gauges:
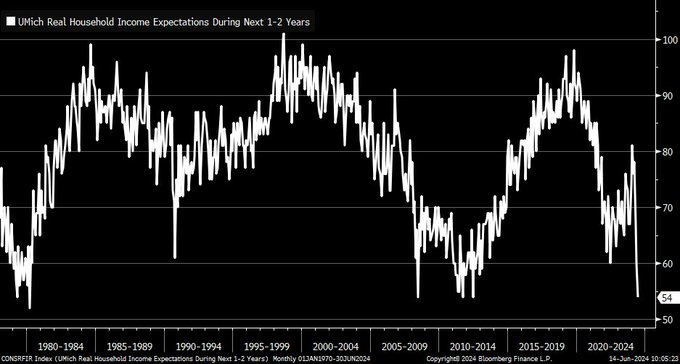
- Kevin Gordon@KevRGordon – UMich consumer sentiment around real income growth over next 1-2 years has plunged to the lowest since June 2012
If you expected Fed Chair Powell to notice this fall in commodities, consumer sentiment or wonder about demand, you were wrong. Because this is, in the words of Emily Rolland of John Hancock, is the “never-ending late stage environment” in which “the labor market looks fine“, to use the phrase of Ed Yardeni.
Goldman’s John Flood seems to concur:
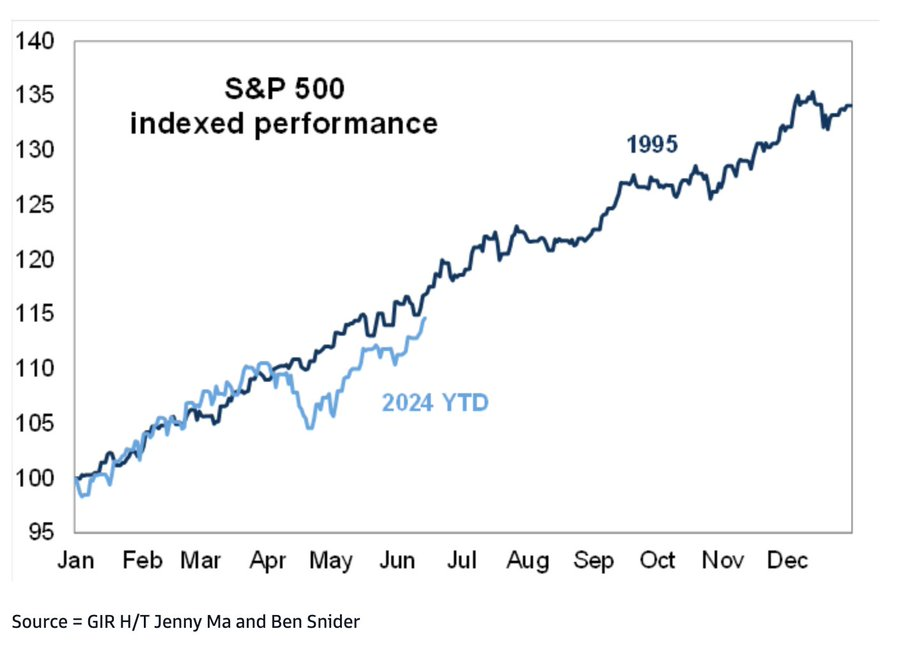
- Holger Zschaepitz@Schuldensuehner – Fri – Party like it’s 1999 or 1995? The bearish answer would certainly be 1999 w/plenty of AI and dotcom bubble comparisons being made. But Goldman’s John Flood think this year has a 1995 flavor: ‘1995 was the last time we got a soft landing – the Fed cut from 600bps to 525bps. S&P 500 made 77 ATHs in 1995 and that was just the appetizer w/the epic run through…you guessed it…1999′. The S&P 500 already has 29 ATH closes (and the best start to an election year ever). Flood believes that there are plenty more ATH’s to come.
What doesn’t look fine is the Banking sector, especially the European banking sector. EUFN, the MSCI European Financial ETF, was down 7.6% last week, about 3X the fall in KRE, the regional bank ETF in the US. So far, the big action in Europe is localized to elections & politics. But if the European economy starts falling with European Bank stocks & US interest rates & US Banks follow, that might force the Fed’s hand. And, as all know, 1995 did not have an European banking or political crisis.
4. US Large Cap
What about the near term, meaning next two weeks?
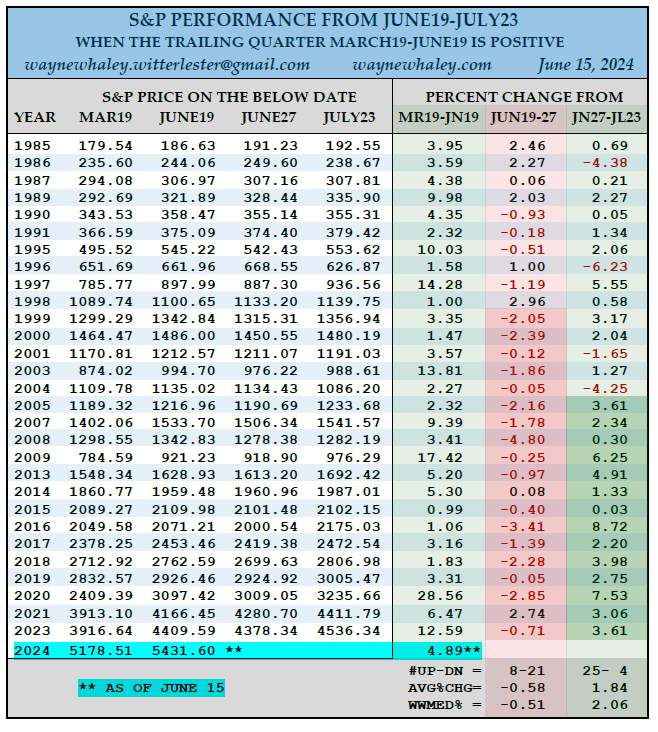
- Wayne Whaley@WayneWhaley1136 – THE SUMMER RALLY – One of 28 new studies on 14 different markets shared with commentary subscribers this morning. This study looks at the S&P performance from June19-July23 in those 29 years of the last 40 in which the trailing Quarter, March19-June19 was positive. As of June 15, the March19-June19 time frame, with three trading days remaining, is up 4.89% for 2024. The June19-July23 reaction period will be split into two measures which have distinctly different characteristics, namely June19-27 and June27-July23. The June 19-27 period which is strongly correlated to the June Post Opex week has been negative in this setup in 17 of the last 19 years. The last 14 cases has seen June27-July23 positive, as well as 25 of the last 29 cases, the so called summer rally time frame you have heard speak of.
Consistent with the above are the two below:
- Seth Golden@SethCL – Jun 15 – Pullback next week ranks 91%ile according to my indicators: technicals, breadth and momentum, and closely monitored composite fund flow data from 3 prime brokerage desks. Anticipate flush for all cap-tiers, re-emergence of broadening breadth thereafter. $SPX $SPY $QQQ $NYA
In that case,
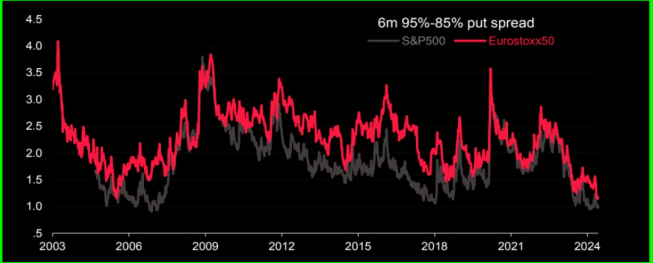
- Imran Lakha | Options Insight@options_insight – Index puts are looking v cheap. Socgen are agreeing, saying that 6m put spreads are as cheap as they’ve been in 20y! Any way you slice it, protecting equity longs is a no brainer even if you’re bullish. Whether is $VIX upside, $SPX skew or naked put spreads, take your pick!
Then comes July!
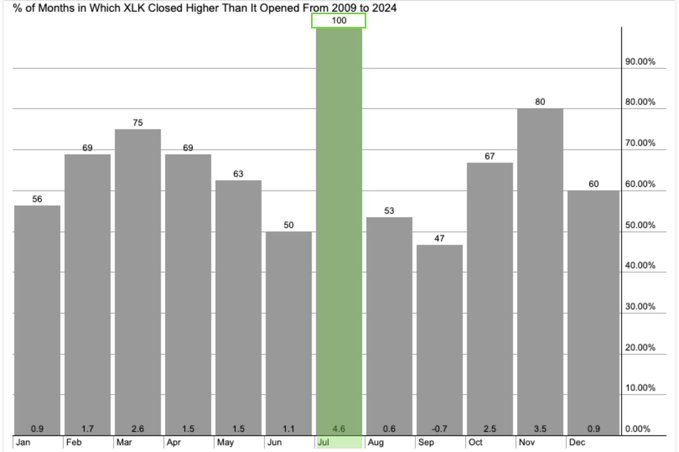
- Seth Golden@SethCL – Looking forward to July? So are Tech investors! Tech sector has a beautiful trend of positive returns in July, with no losses over last 15 years, and avg. return of 4.6%. Yes this could be the year to break the streak, which has been said for 15yrs. $SPX $QQQ $NDX $XLK $SPY
5. US Small Cap
When Interest rates fall, small caps tend to do better. Below is a finer tune:
- Mike@MichaelStockkk – Jun 14 – Keeping a close eye on the bullish divergence between $HYG and $IWM. When $IWM makes a lower low but $HYG forms a higher low, it has historically signaled potential reversals. This divergence could be a leading indicator of an impending market turnaround. @3PeaksTrading
And,
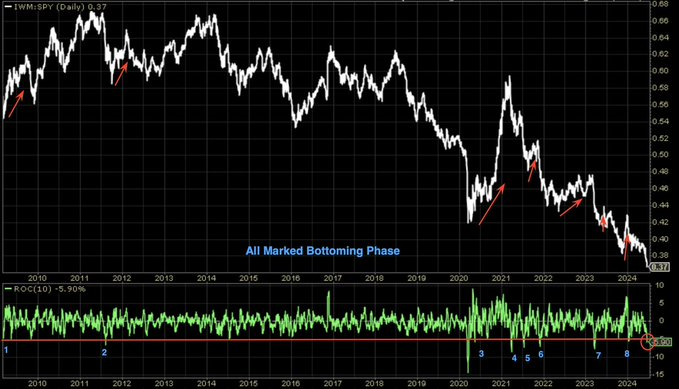
- Seth Golden@SethCL – Only 8 other times has 10-day ROC $IWM : $SPY been greater than 5.5%, since Great Financial Crisis. Every. Single. Time… IWM outperformed in the coming days/weeks/months. Will this time be different? $RUT $SPX
On the other hand,
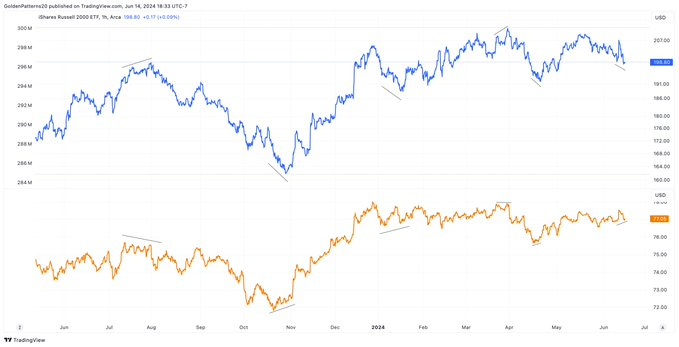
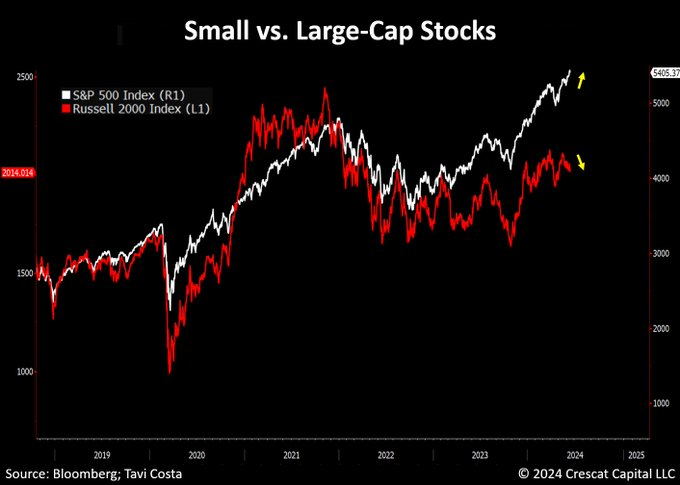
- Otavio (Tavi) Costa@TaviCosta – One of them is lying. Small-cap stocks continue to negate the recent rally in large-cap stocks. These divergences don’t matter until they do. I suspect that small caps, which represent two-thirds of the labor market, are likely a leading indicator that the overall market is far ahead of itself.
6. Semis vs. Software
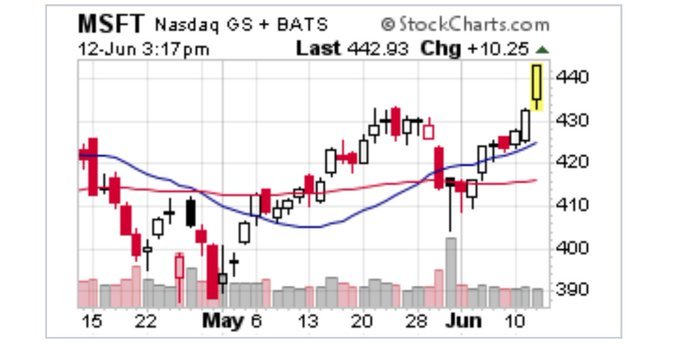
Can you discuss this without first displaying the action in the world’s best software company?
- Larry Tentarelli, Blue Chip Daily@bluechipdaily – $MSFT big breakout to new highs. These multi-month range breakouts in $MSFT $AAPL and $QQQ are most often indicative of the start of a bigger trend move, not the end of one.
But whom does he prefer at this time? MSFT or NVDA?
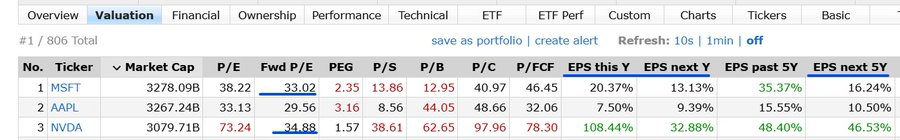
Why have the software stocks performed so badly compared to the Semiconductor stocks? Rajiv Jain of GQG Partners said something that even simpletons like us can understand:
- ” … CapEx-revenue ratios can go higher even for Microsoft; all these businesses are becoming more capital intensive which bodes very well for Semiconductors in general; so the shift in our case has been cutting back software over the last six months towards more semiconductor hardware type businesses … the sovereign aspect of AI, data centers etc. , …. the risk of distruption or somewhat of an existential risk in software is going up … which is what the markets are getting nervous about … growth rates could slow down dramatically in some of … these software companies … “
But the above has been true for “over the last six months“, as Jain said. That brings up the question – is software dead or is the spread between software & semis become so large that “smart money” may be tempted to buy Software stocks? A smart investor like Brad Gerstner of Altimeter suggested the latter but without pointing to a catalyst & without saying if & what he was buying. The clip below of the segment is interesting:
It was Anastasia Amoroso of iCredit who, on CNBC Half Time, gave the best analysis of how cheap software stocks have become vs. Semis. We paused to listen but couldn’t take notes. And now, for some reason we cannot fathom, CNBC WebLords have NOT put that segment on either cnbc.com or on YouTube.
But what if the opposite happens & NVDA falls hard after having made a top last week? That is what the famed Larry Williams suggested to Jim Cramer. See & listen for yourselves:
6. Indian Stock Market
Jeffrey Gundlach has been bullish on India for over 10 years now. He repeated his view this week in his post-FOMC appearance on CNBC Closing Bell – “India – love it for the long term; don’t look at it even if it falls by 20%; Own it; India is probably the strongest economy in the world …”. Kudos to him. He is 100% correct in our view.
But to most Indian stock market looked very dicey on Tuesday June 4 when the explosive rally on Monday reversed & collapsed below in the confusion over the “lower-than-expected” result for PM Modi. We thought the fall was a big opportunity & told CNBC Fast Money late Tuesday that we had started adding when they were saying it was an opportunity to book losses.
Then in our June 9 article, we explained our rationale & our increasing bullishness to profit from the idiotic panicked fall in our last week’s article titled Section I. Indian Election up & Down & the Resultant Opportunity Now let us look at the performance on $INDA (MSCI BlackRock India ETF) from the explosive rise on Monday, June 3 (on exit polls) to this Friday June 14, 2024.
Notice that $INDA closed at $55.27, higher than the explosive close on Monday, June 3 on crazy hopes from exit polls. Frankly, this action – a complete reversal from the panicked lows to $51 on Tuesday June 4 open to close above the ecstatic close on Monday June 3 – is much more bullish. Look again, $INDA closed up virtually on every single trading day from June 4 to June 14.
Why did this happen? We don’t know but would like to guess. Very quickly investors realized selling in panic on Tuesday June 4 was a big mistake & then the buying began slowly & steadily. Now recall what Feroze Azeez, a wealth manager had told BTV’s Haslinda Amin,
- “If you look at flows from 1st of April till yesterday, about $4.5 billion have been sold; .. if you look at index short positions of foreign institutional investors, they have raised shorts to 86%-87% vs. 40% long which is the one of the least I have seen from a long standpoint; … I think they will reverse that position & become net positive over the next 10 trading sessions. So there is going to be a lot of short covering ..”
But now the short covering has to compete with new buying. And this is at a time when GEM Fund managers are already under-weight India and when India’s weight in EM increases with every rally. Read what Ridham Desai, the Morgan Stanley Strategist & MD told CNBC-TV18 in India this week:
- ” we find that fund managers with GEMS mandate are under-weight India …. they had been worried about valuation & they have been waiting for the market to correct; the market is not obliging them. So they remain under-weight. “
And,
- “India’s weight in EM has gone up significantly in last two years; we were around 8% pre-covid; we are now 17%; actually fund managers are NOT being able to keep pace with the rise in India’s weight in the index; “
That’s simple. Just buy more, right? But how much money would it take for GEM portfolios to be over-weight India on average? Desai answered:
- “the answer is a staggering $50 Billion U.S. Dollars“
But there is a bigger problem, Desai pointed out:
- “… we have domestic inflows that just keep rising; every morning domestic mutual funds have to buy about $100-$150 million of stocks; so if they don’t buy for 5-6 days, suddenly they have about $1 billion in cash & more buying to do because inflows don’t stop ..”
Right now there are only 2 categories of participants domestic buyer & foreign investors. That is why foreign investors who are buyers are being squeezed out to some degree. So where will the liquidity emerge in size for foreign investors to buy? Desai’s answer:
- “.. I expect a deluge of primary deals in the next several months and that will allow foreign investors to start buying. If I may make a prediction here, foreign institutional investors will start buying India in the second half of the year largely because primary issuance will go up & that will create the space for them to buy .. “.
And the majority of these will be PSUs (Public Sector Units) or foreign subsidiaries like Hyundai Motors that can go public in India. By the way, how did the two defense PSUs we like do in the past 2 weeks – Both are up 24% from Tuesday close EST or Wednesday’s open in Mumbai:
HAL – Hindustan Electronics
BEL – Bharat Electronics
We think the above is a big reason for US Fin TV to only invite investors (fund managers, wealth managers etc.) who operate in India to comment on market events & news. India-haters or Modi-haters on Fin TV can & do only damage to viewers & hence to the franchise of these Fin TV networks. How many viewers ended up selling their India ETFs on Tuesday only to now feel angry & un-smart!
In case you didn’t know, PM Modi was invited after his swearing-in by Italian PM Meloni to attend the G-7 as an honored guest.
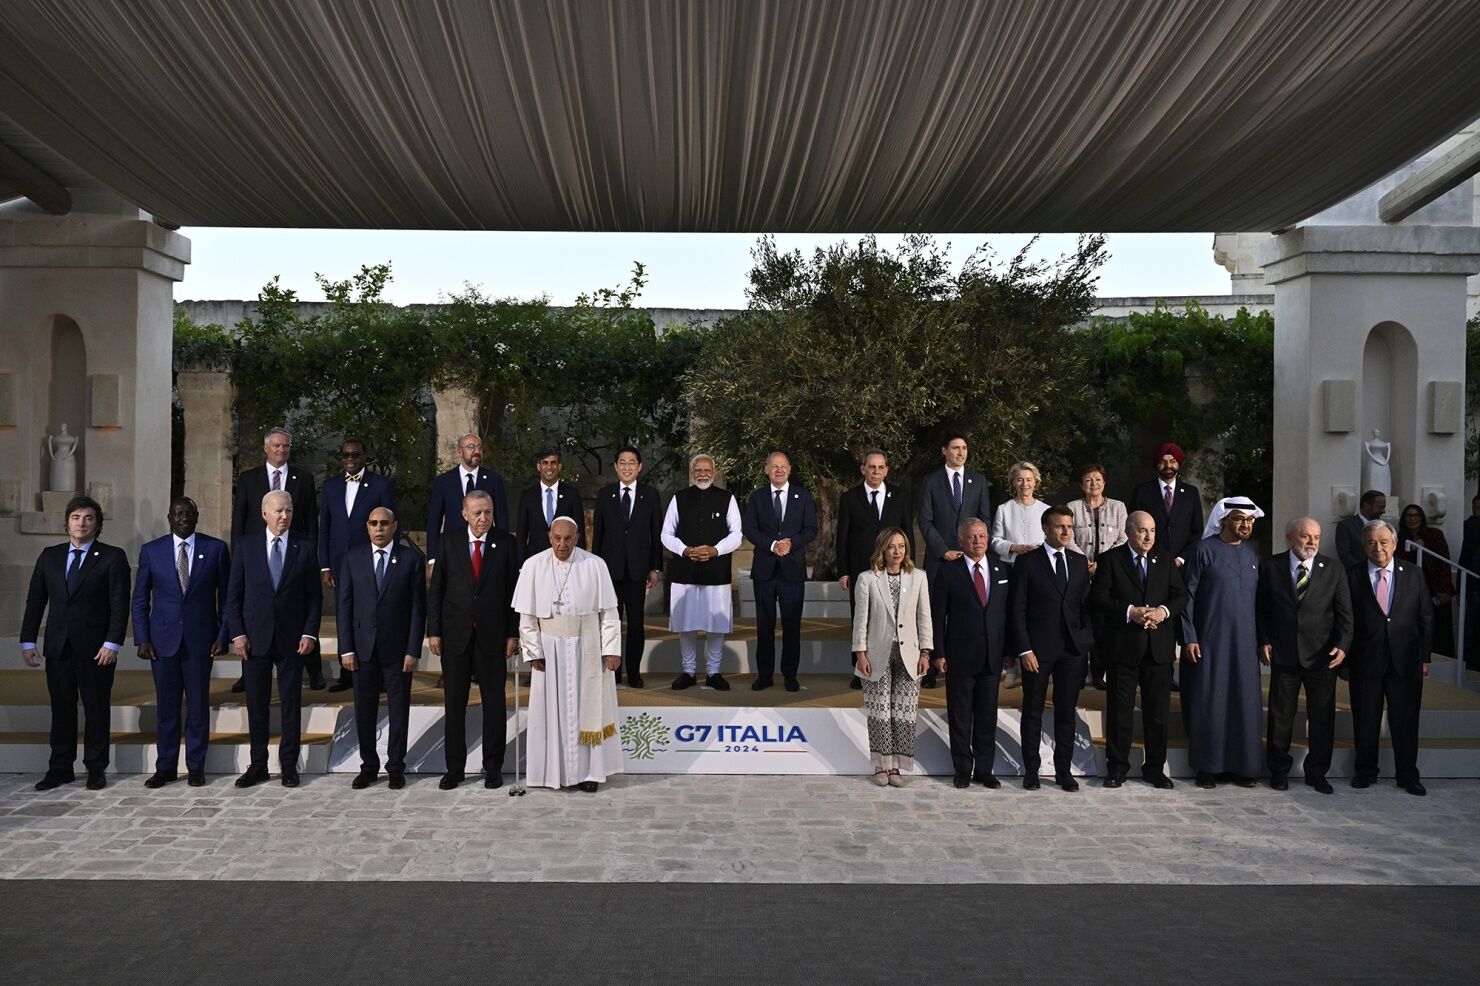

What did Ian Bremmer, previously non-positive about PM Modi, tweet from G-7?
This is Ian Bremmer turning over a new leaf.
On the other hand, look at Ruchir Sharma of Rockefeller Foundation who proved to be so wrong about the election in India. His title for the election was “Moral Defeat for Modi“. How Brahministic* in never admitting he was wrong? Kinda reminds you of Sorkin, right?
In contrast, Ian Bremmer’s one-liner about the same election – hard to imagine india’s election going better.
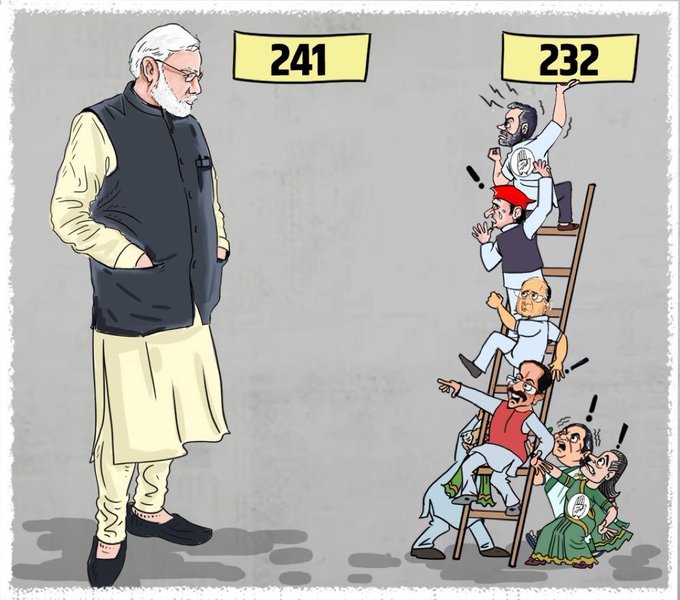
PS: The usual game is afoot in India. Look at the young winner in red cap on the second rung on the right; he can’t stand the guy on the top rung. So he has moved to Delhi to oppose his no. 1 ally nationally. Also the 4th guy on the ladder in the brown half-jacket is negotiating furiously to join Modi’s BJP with his 12 seats. Commentators are saying that Modi’s BJP now has 275 seats, 3 more than required to form the government themselves. Remember our prediction about the true result of the election – Modi Unbound. Don’t you all wish you bought on Tuesday June 4?
Send your feedback to editor.macroviewpoints@gmail.com Or @MacroViewpoints on Twitter