Summary – A top-down review of interesting calls and comments made last week in Treasuries, monetary policy, economics, stocks, bonds & commodities. TAC is our acronym for Tweets, Articles, & Clips – our basic inputs for this article.
Editor’s Note: In this series of articles, we include important or interesting Tweets, Articles, Video Clips with our comments. This is an article that expresses our personal opinions about comments made on Television, Tweeter, and in Print. It is NOT intended to provide any investment advice of any type whatsoever. No one should base any investing decisions or conclusions based on anything written in or inferred from this article. Macro Viewpoints & its affiliates expressly disclaim all liability in respect to actions taken based on any or all of the information in this article. Investing is a serious matter and all investment decisions should only be taken after a detailed discussion with your investment advisor and should be subject to your objectives, suitability requirements and risk tolerance.
1.Volatility of Volatality
After what seemed like a turbulent week, what do we have? S&P and Dow down 1% on the week; Nasdaq & NDX down 1.5%; Russell 2000 down 2.7%; TLT up 1.1%; yields down 6-7 bps along the curve; Oil down 1.4% and Gold up 2.5% – This is the sort of action we used to see in a single day’s turbulence, right? So what’s the big deal? The vertical geyser-like jump of 44% in VIX on Thursday capping a 54% rise in VIX on the week. Jeffrey Gundlach said on Thursday’s CNBC FM 1/2 that “volatility going up” was his highest conviction trade. How prophetic did that statement prove thanks mainly to President Trump’ blunt warning to Kim Jong Un of North Korea.
A one-day rise of 44% in volatility! That means volatility itself became highly volatile on Thursday, right!
- Lawrence McDonald @Convertbond Volatility: VVIX – Highest Mark Since June 2016
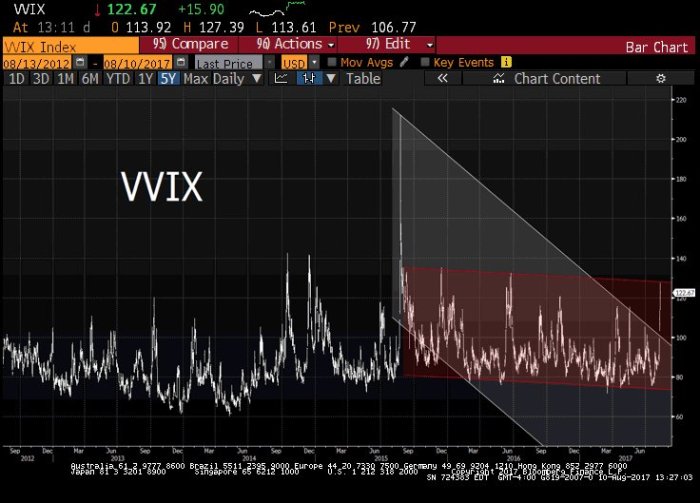 Why this panic in VIX? Jon Najarian of CNBC FM suggested that many had not only shorted VIX but had actually put on large one-x-many ratio trades on VIX. As VIX exploded up on Thursday, the ratio trades proved destructive & had to be liquidated en masse leading to the explosive rise in VIX. That lead to a greater explosion in VVIX, the volatility of VIX.
As the above chart shows, the volatility of volatility tends to fall in intensity after such an extreme spike. As fears of immediate follow up to Thursday afternoon’s event receded on Friday morning, it became evident to some that Thursday’s spike had presented an opportunity to take profits in the long VIX trades:
- Greg Harmon, CMTVerified account @harmongreg $VIX traders, I know you’re waiting for a spike to 50, but look back & see how often closes outside of BB’s 2 days in a row – take profits
When viewed in the above context, you have to wonder whether the decline in US & Global indices was entirely a byproduct of the volatility turmoil rather than a correction generated within the equity markets.
This is an important distinction because a correction that is a byproduct of a volatility event can subside as the volatility declines and volatility tends to decline faster than just about everything else. That may be why Lawrence McMillan tweeted the following on Friday afternoon:
- Lawrence G. McMillan @optstrategist – Weekly Stock Market Commentary 8/11/17 http://www.optionstrategist.com/blog/2017/08/weekly-stock-market-commentary-81117 …
$SPX$VIX
- “In summary, the long-awaited correction has begun. Oversold conditions are already appearing, and even one day of rally might generate buy signals. We will follow the signals wherever they lead us, without getting hung up on downside targets or duration of the correction”
Regardless of what happens next week, it seems clear to us that this week’s North Korea rumblings have changed the event risk profile of markets. It seems clear to us that President Trump and his foreign policy & military teams are not stopping until a solution is reached on North Korea. Recall what the mild mannered Secretary Tillerson said this week “stopping where they are today is not acceptable to us“. Secretary Mattis spoke in much starker terms.
It seems clear to us that President Trump & his team is determined to de-nuke North Korea either in one stroke or via a negotiated deal that is implemented in stages. Notice Foreign Minister Lavrov of Russia also stated in unveiling his Russia-China proposal that ” nuclear North Korea is unacceptable” to Russia as well.
This will NOT be accomplished without a far greater level of rhetoric & real warnings from the Trump Administration. Because it is a strategic imperative for Kim Jong Un to retain his nukes and he will NOT accept getting de-nuked unless he is faced with real & total destruction of his regime including himself.
At this time, very few in America believe President Trump will attack unilaterally without any overt action from Kim. So you can excuse Kim & China for not believing it either. That raises to a near certainty the event risk of greater & greater level of rhetorical warnings from the Trump Administration. As we wrote in our July 4, 2017 article, this period is similar to the October 1990 – early January 1991 period which saw progressively higher level of warnings to Saddam Hussein.
So even if this specific spike in VIX subsides & even if S&P rallies during next week’s option expiration week, this week’s turbulence may prove to be merely the first.
2. Treasuries, Bunds, Financial Stress
It was good to hear Gundlach say that he spends a lot of time on positioning. Because that tends to protect traders from unprofitable trade locations. We saw that this week in Treasuries. Despite the big spike in VIX, Treasuries hardly budged. That was probably because of the very long positioning in Treasuries of large players. This bad trade location, Gundlach said, has led the 10-year yield to trade between 2.20%-2.30%.
Gundlach said he would expect the 10-year yield to break to the upside & this upside breakout would be confirmed if the 10-year yield broke above 2.42%. What was more interesting to us was his reasoning & trigger. Gundlach said the movement in yields was “all balanced on the German 10-year“. He noted it had broken above 50 bps and added “it has no business being at 50 bps while the US 10-year is at 2.30%; the economic fundamentals are not that different between Europe & US; inflation in Germany is similar to inflation in US; GDP growth is similar & PMIs are stronger in Europe“. So Gundlach said “policy in Germany has to change & that will be the catalyst for the US 10-year yield“.
We concur with Gundlach about the huge chasm between the German 10-year yield & the US 10-year yield. We also concur with the idea that the move in the German 10-year is likely to be a catalyst for the US 10-year. But a catalyst in which direction?
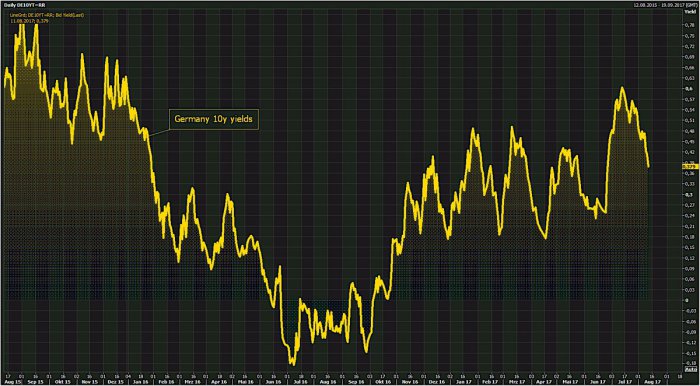
- Holger Zschaepitz @Schuldensuehner – #Germany‘s 10y yields keep falling as markets in Europe sending a grim Risk-Off sign.
The German 10-year closed the week at 38 bps, down 8 bps on the week. The US 10-year yield fell by 7 bps. Is this due to economic data or is it due to North Korea fears? Do we really expect Draghi to do anything hawkish while the North Korea situation remains alive or before the German election? This week’s US economic data has certainly put a damper on rate hike expectations in the USA. Add to that Fed Head Kaplan’s statement on Friday morning about the “neutral rate, the long term rate coming down to 2% from 3%“.
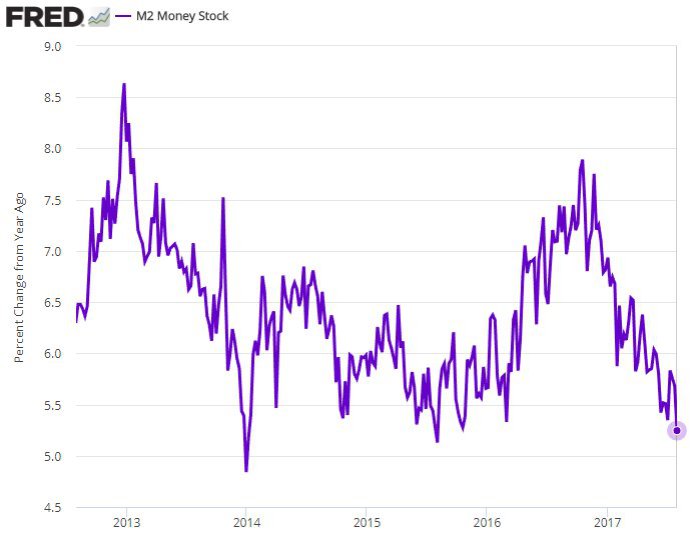
This, if confirmed, would be a huge change. In fact, this statement by Kaplan led Treasury yields to reverse on Friday morning and go down hard, especially in the belly of the curve. A terminal Fed Funds rate of 2% would make 2.30% level a fair value for the 10-year yield and could support a fall to 2% during times of global fears. Add to that the message from US money supply:
- (((The Daily Shot))) @SoberLook Chart: US broad money supply growth (M2); this indicates weaker credit expansion
Gundlach also said that “MOVE is 1/3 rd lower than it used to be“. And his view was that a rise in bond yields could trigger a stock correction.The opposite happened this week with VIX exploding up & MOVE remaining dormant:
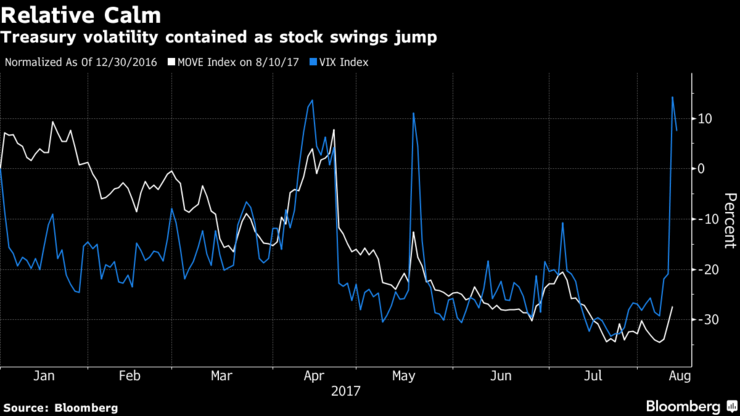 And as we noted a few weeks ago, unlike the VIX, a low in MOVE doesn’t necessarily get resolved by yields exploding higher. A fast fall in yields can also lead to MOVE spiking higher.
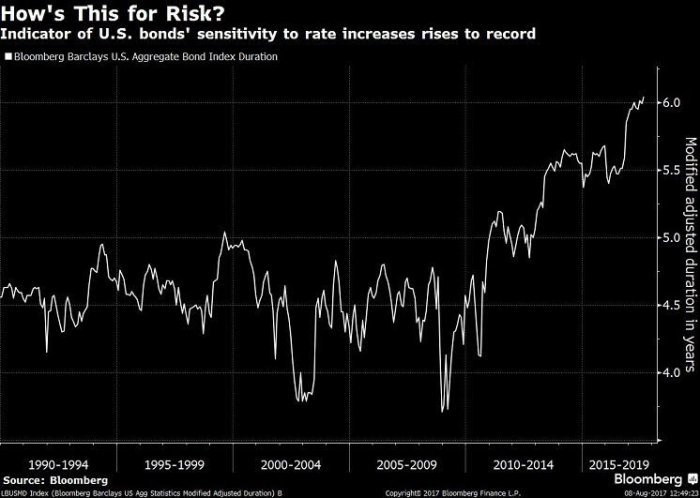
There is no question about duration risk either:
- Babak @TN modified bond duration at record levels suggesting unprecedented risk in fixed income markets
$BND$AGG h/t@RBAdvisors via@TheOneDave
- Lawrence McDonald @Convertbond –% of Eurozone Junk Bonds yielding less than US Treasuries 2017: 62% 2015:8% 2013: 0% 2011: 0% 2009: 0% BofA
#MoralHazard#Lehman#ECB
- Bond Vigilantes @bondvigilantes Today on
#thingsihaventseenbefore… Euro high yield (YTW) and US 10yr yields have converged. Via@TruthGundlach.
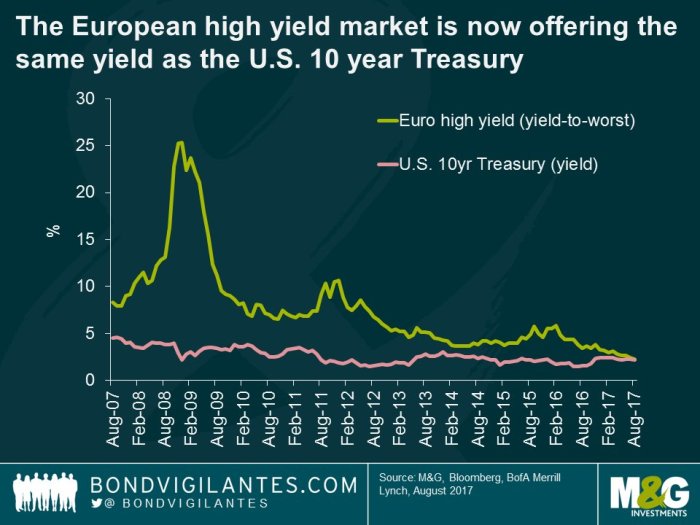 This can correct itself as it usually does by Treasury yields spiking higher leading to a sell off in High yield. But this can also get corrected by credit weakening hard & Treasury yields falling hard. The former, like in 1994, can be very painful but is not systemic. The latter, like in 2007-2008, can be far more cancerous. This is the condition that makes Treasuries rally despite a bad trade location.
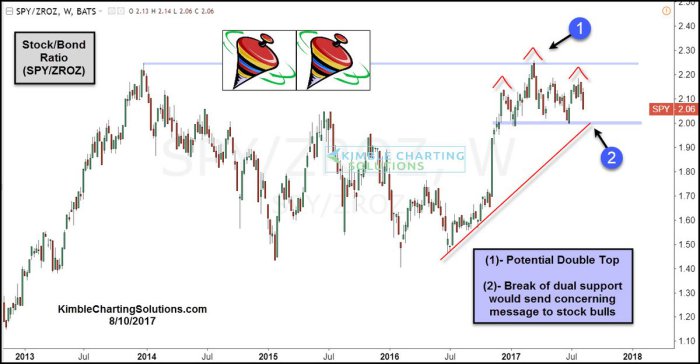
And weakening credit & falling Treasury yields can lead to:
- Chris Kimble @KimbleCharting Stock/Bond ratio creating double top and Head & Shoulders topping pattern?
$SPY$SPX$TLT$ZROZ
3. Stocks
A big spike in VIX followed by a steep fall usually leads to a rally in S&P. But stability is often a pre-requisite:
- SentimenTraderVerified account @sentimentrader When CNN Fear & Greed first starts to enter “fear”, usually not an immediate buy signal. Has been better to wait until it recovers.
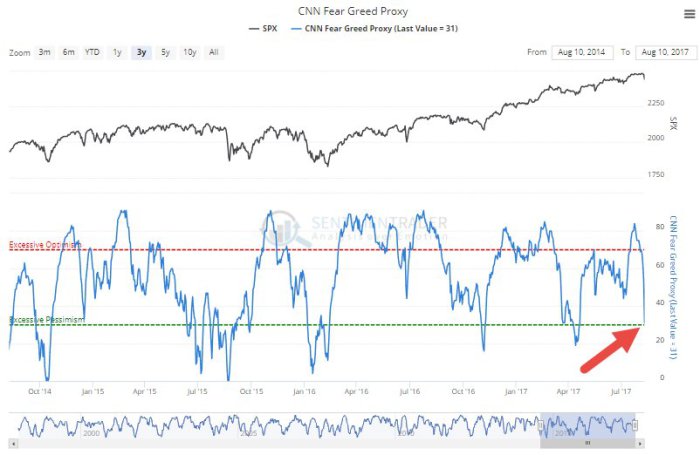 Tony Dwyer of Canncord Genuity sort of sounded a similar note in saying he didn’t think this week’s dip was big enough to buy. But he added when VIX spikes up 40% in one day, a month later the S&P is often higher with an average return of 2.9%. What size of a dip would he consider worth buying? Dwyer didn’t say. Perhaps, an average dip in a negative August?
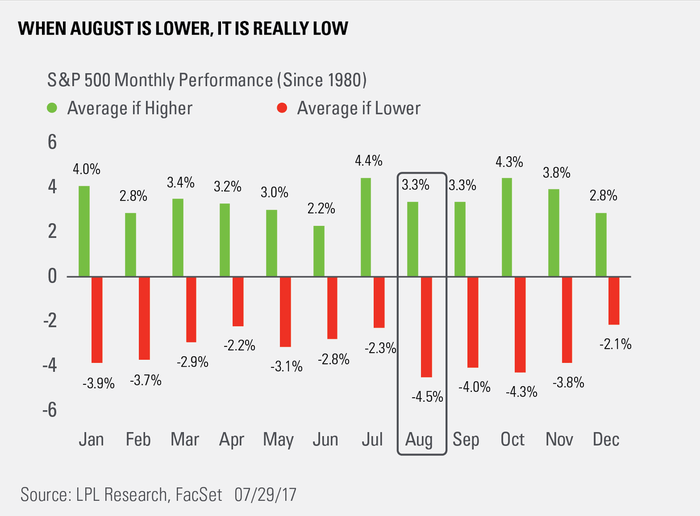
- Ryan Detrick, CMT @RyanDetrick – Pick a reason why (probably low volume), but events surprise
#SPX in August and when it is down, it is really down. https://lplresearch.com/2017/07/31/august-preview-this-is-one-historically-bearish-month/ …
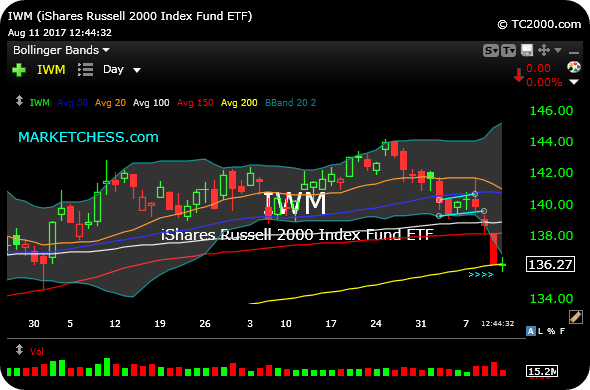
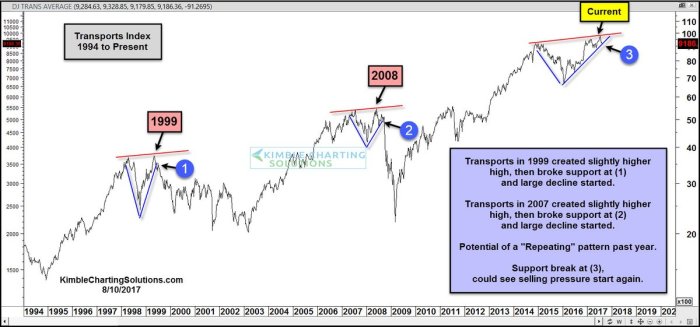
 Last week, we spoke positively about Russell 2000 & Transports bouncing off of key levels. They didn’t hold this week and both sectors don’t look so good.
 - Chess @chessNwine
$IWM Daily. Despite broad market bounce, small caps’ inability to react to oversold would be a concern into weekend.
- Chris Kimble @KimbleCharting Transports could be repeating 1999 & 2007 topping pattern right now.
$DJT$IYT$SPY$DIA https://kimblechartingsolutions.com/2017/08/transports-repeating-1999-2007-now/ …
- Chris Kimble @KimbleCharting Emerging markets “Sub-merging?” Bearish reversal at resistance, with momentum highest since 2007.
$EEM$SPY$EFA
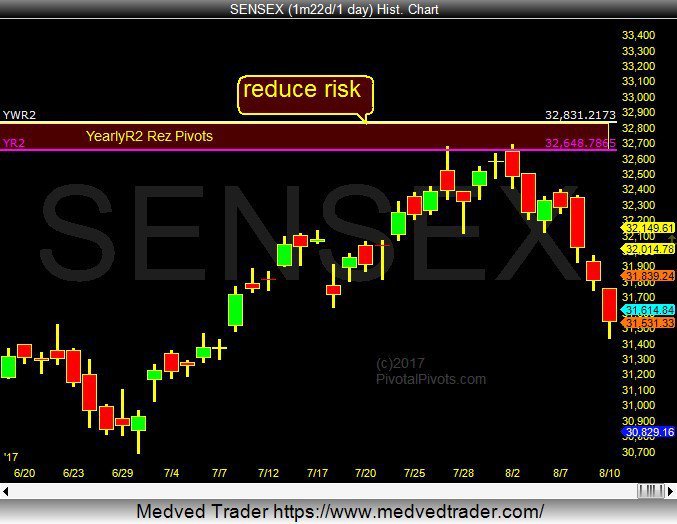
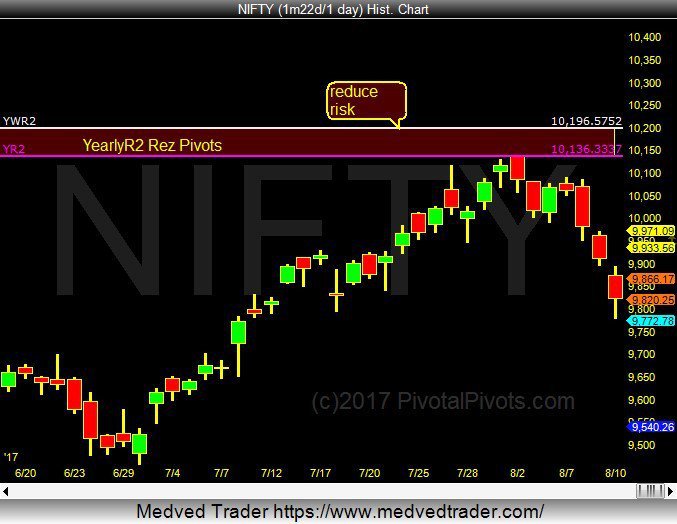
- Jeff York, PPT @Pivotal_Pivots The
#SENSEX &$NIFTY in India, are also rolling over after testing their YearlyR2 Rez Pivots. The BIGGEST reversals happen at Yearly Pivots!
4. Gold
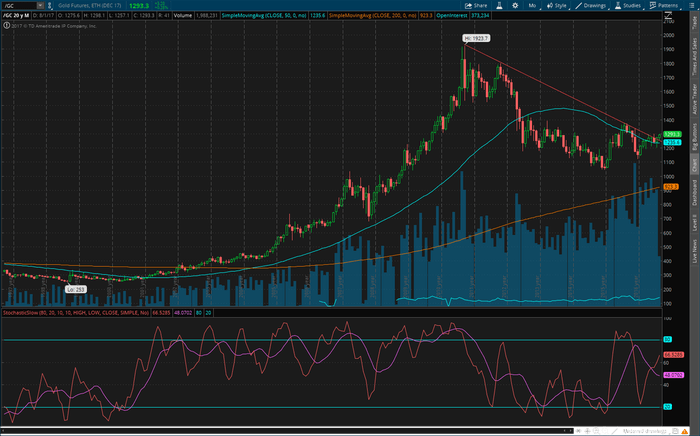
Gundlach mentioned his favorite Copper/Gold ratio as support for his breakout in yields position. Not so fast as Coach Lee Corso would say – FCX fell 3.3% this week while GDX rose 3.7%, a 7% outperformance of Gold miners over Copper miners. In fact, Gundlach himself tweeted:
- Jeffrey GundlachVerified account @TruthGundlach You need a magnifying glass, but GDX breaking out of a textbook six month pennant formation to the upside. Up day tomorrow would confirm it.
Yes. GDX did close up on Friday. Gold was the star of the week, up 2.5%.
- Todd HarrisonVerified account @todd_harrison #Gold update; working off overbought conditions as a function of time vs. price historically pretty bullish.
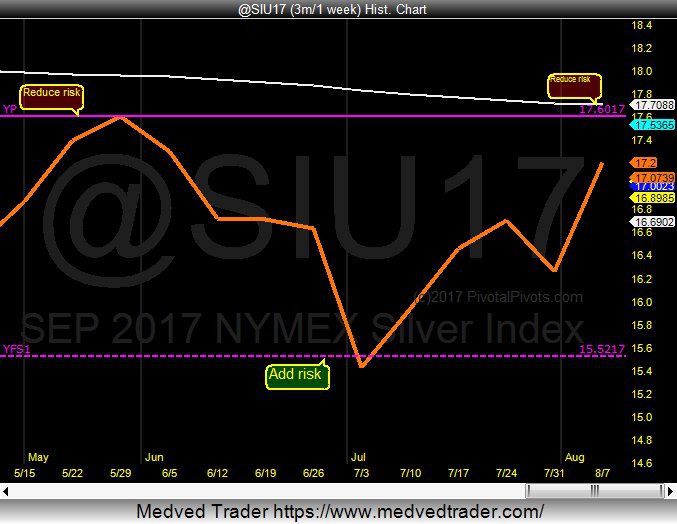
If Gold was a star, then Silver, up 5.2%, was a superstar this week. That actually diminished the ardor of some:
- Jeff York, PPT @Pivotal_Pivots Silver
$SI_F$SLV is close to my 1st. profit target @ $17.60(YP). Buy @ Ys1 and Sell @ YP.#TradethePivots
5. Oil
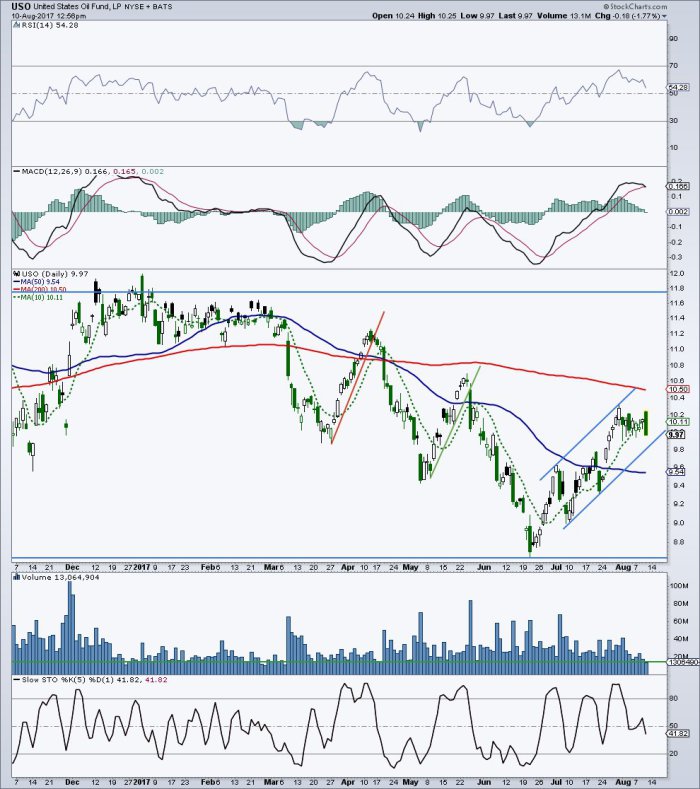
If Gold & Gold miners were stars, Oil & Oil drillers were tar this week. Oil was down 1.4% while OIH, the Oil Services ETF, was down 7.2% on the week. XLE, the integrated ETF, was down 2.7%. Guess, unlike a war in Kuwait, a war in North Korea is more likely to weaken demand for oil.
- Mark Arbeter, CMT @MarkArbeter Crude oil
$USO topping again. COT data NOT pretty here.$OIL,#CRUDE
Commodities got shellacked this week – FCX down 3.3%, CLF down 7% & MOS down 10% on the week. Perhaps sellers confused them for retail stocks. Or they might be providing a signal for lowering of global growth expectations.
Send your feedback to editor@macroviewpoints.com Or @MacroViewpoints on Twitter
