Summary – A top-down review of interesting calls and comments made last week in Treasuries, monetary policy, economics, stocks, bonds & commodities. TAC is our acronym for Tweets, Articles, & Clips – our basic inputs for this article.
Editor’s Note: In this series of articles, we include important or interesting Tweets, Articles, Video Clips with our comments. This is an article that expresses our personal opinions about comments made on Television, Tweeter, and in Print. It is NOT intended to provide any investment advice of any type whatsoever. No one should base any investing decisions or conclusions based on anything written in or inferred from this article. Macro Viewpoints & its affiliates expressly disclaim all liability in respect to actions taken based on any or all of the information in this article. Investing is a serious matter and all investment decisions should only be taken after a detailed discussion with your investment advisor and should be subject to your objectives, suitability requirements and risk tolerance.
1.Inexorable Force
No, it is not the stock market. It is the 2-year yield. Since September 7, the Thursday before Irma, the two year yield has had one direction – relentlessly up. Neither Draghi nor the Fed has been able to arrest this force. Naturally it is dragging the entire belly higher including the 5-year yield. The Great Gundlach gave voice to this on Friday:
- Jeffrey GundlachVerified account @TruthGundlach Two year UST yield up 40 bp in last two months, for an annual rate of 240 bp! That’s triple the rate Fed Funds has been climbing this year!!
The 5-year yield is up 43 bps vs 40 bps for the 2-year. But the 30-year yield is only up 21 bps in that period. By the way, the German 30-year yield is also up 21 bps over that period (Thursday 9/7 to Friday 11/10). The 30-year & 10-year yields have been rising & falling over this period. But not the 2-year. It just keeps going up.
Why not blame the Fed for this 2-year move? Because the 3-2 year yield spread, Gundlach’s favorite indicator, is only up 2 bps after this entire move from Thursday, September 7.
On the other hand, the 30-10 year yield spread, the purest measure of inflation expectations, has flattened as if gripped by a python. It has flattened from 62 bps on September 7 to 48 bps on Friday. This bothers us because, in our experience, 50 bps has been the threshold for an end to a sustained yield collapse as it was in December 2008.
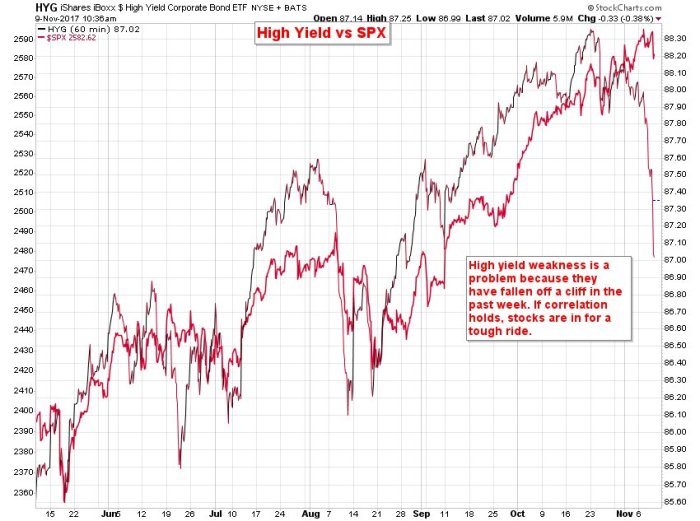
We wonder whether the inexorable rise in the 2-year yield is suggesting a squeeze on excess liquidity. We have pushed aside these misgivings until now because credit was holding up and as long as credit holds up, misgivings don’t matter much. But then,
- Contrahour @Contrahour – Thu Nov 9 – That’s a problem because high yield bonds have fallen off a cliff in the past week. $HYG $SPX
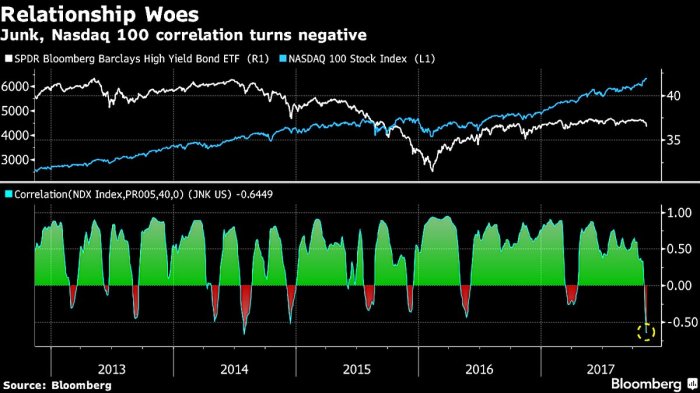
- Holger Zschaepitz @Schuldensuehner Oops! Gundlach’s stock market warning comes true as Junk Bond, Nasdaq correlation turns most neg in 3yrs. Threatens equity-market darlings. https://www.bloomberg.com/news/articles/2017-11-10/gundlach-s-warning-comes-true-with-ominous-faang-junk-bond-link …
2. Stocks
Despite weeks of going up, despite rates rising & credit falling, the stock market keeps holding up & possibly working off some of its overbought condition. Look what our lying eyes as well as those of others saw on Thursday and Friday:
- Bob Lang @aztecs99 – impressive action in the SPX last two days — every reason to finish on the lows, but battled back.
Others seem to have some of the misgivings we have but …
- Lawrence McMillan of Option Strategist – In summary, until $SPX breaks support or $VIX breaks out to the upside, the intermediate-term outlook will remain positive. Other sell signals and overbought conditions give compelling arguments for a short-term pullback, which has had trouble materializing, but whose probabilities are still high.
And seasonality with statistics suggests higher returns by year-end:
- Ryan Detrick, CMT @RyanDetrick – Wed Nov 8 – If the #SPX is up >15% by Halloween (like ’17), then the final two months have been higher 16 of 17 times … https://lplresearch.com/2017/1
1/07/the-halloween-indicator/ …
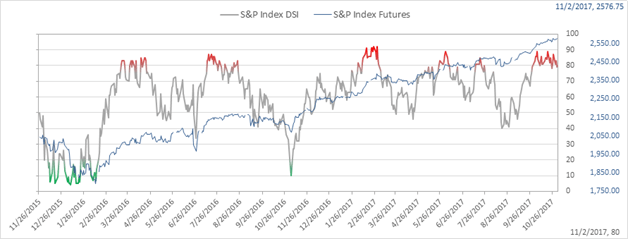
But we did sense a loss of momentum last week. This week the daily sentiment index tracked by @TommyThorton showed it graphically:
 When we do get a correction, how bad could it be? Some said not so much on Fin TV. Another view is more dire:
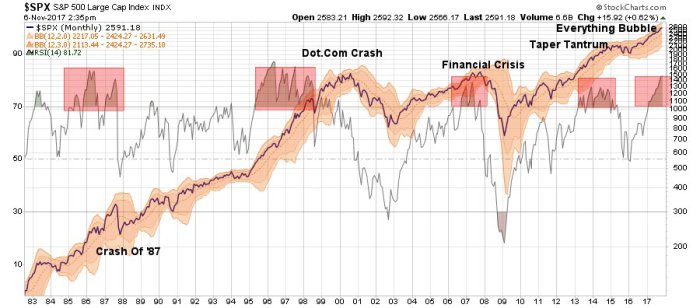
- Lance Roberts @LanceRoberts With the S&P 500 over 80 on the MONTHLY RSI, corrections have tended to be substantial when they occur. https://realinvestmentadvice.c
om/technically-speaking-a-blin d-bull/ …
 Not all are so worried or have misgivings:
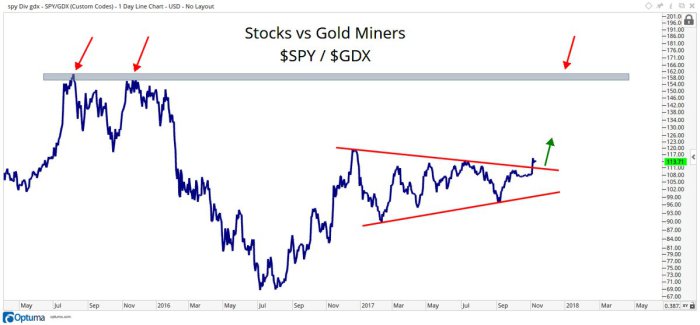
- J.C. Parets @allstarcharts – Here is the S&P500 vs Gold Miners resolving this 2017 consolidation higher with a lot of room to run to the upside. I still like buying stocks and shorting gold miners very aggressively
$SPY$GDX$GDXJ
3. Gold
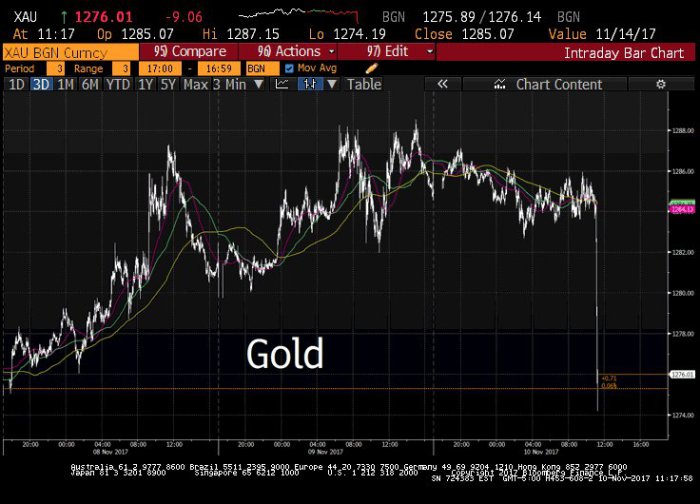
Did the big fall in Gold on Friday have anything to do with Treasury yields shooting up? Where does that correlation stand?
- Lawrence McDonald @Convertbond– Nearly a 70bp drop in gold last few hours. Rates up / gold down (negative correlation up near 80% / 7 yr high last we checked…
#Bonds =#Gold
The drop seems to have persuaded Greg Harmon of Dragonfly capital to write on Friday Why Gold is headed higher?
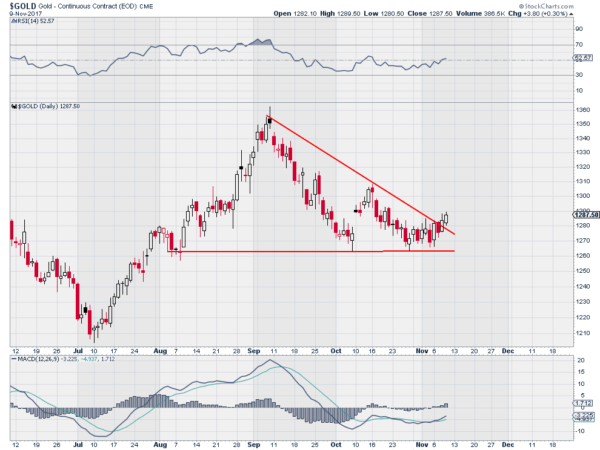
- The short answer is price says so … The fall back also held at the 1270 level. … Now it has crossed falling trend resistance and is moving higher. It has support for more upside from a RSI steadily rising and through the mid line. The MACD also has crossed up and is rising in support. The next levels to watch are 1310, the October high, and 1360 as possible resistance. And a break under 1260 ends the bias to the upside.
4. What is a Veteran?
On this Veteran’s Day, isn’t it important to know What is a Veteran?
[embedyt] http://www.youtube.com/watch?v=tIjgpzGC6h0[/embedyt]
Send your feedback to editor@macroviewpoints.com Or @MacroViewpoints on Twitter
