Summary – A top-down review of interesting calls and comments made last week in Treasuries, monetary policy, economics, stocks, bonds & commodities. TAC is our acronym for Tweets, Articles, & Clips – our basic inputs for this article.
Editor’s Note: In this series of articles, we include important or interesting Tweets, Articles, Video Clips with our comments. This is an article that expresses our personal opinions about comments made on Television, Tweeter, and in Print. It is NOT intended to provide any investment advice of any type whatsoever. No one should base any investing decisions or conclusions based on anything written in or inferred from this article. Macro Viewpoints & its affiliates expressly disclaim all liability in respect to actions taken based on any or all of the information in this article. Investing is a serious matter and all investment decisions should only be taken after a detailed discussion with your investment advisor and should be subject to your objectives, suitability requirements and risk tolerance.
1.The Key
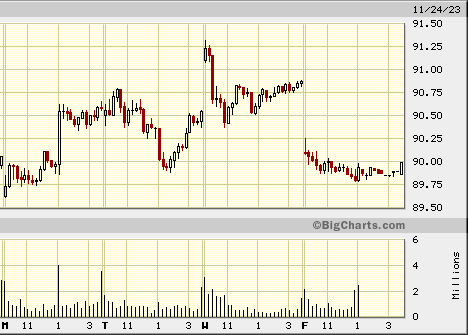
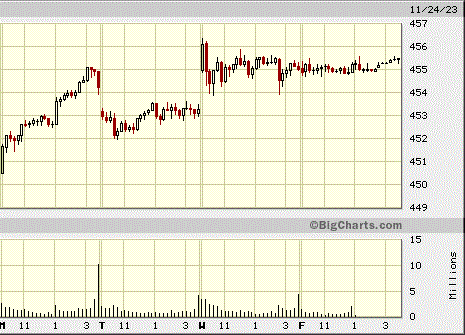
This week was a low volatility week. It had something to do with the calendar & also with the belief that, to quote Jay Pelosky’s theme last week, we might be on the cusp of “macro stability“. This week, we were again reminded what really is beneath the “macro stability” we see now. Look at the 4-day charts of the week below & look specifically at 1 pm on last Monday:
(TLT) (SPY)
The TLT chart above shows the vertical move at 1 pm on Monday – direct result of a successful 20-year Treasury auction. The SPY move may not look like much but its immediate impact was big:
- zerohedge@zerohedge – There is zero liquidity: TICK soars to 1700, highest since CPI Tuesday on the solid 20Y auction
This shows how everything depends on the Treasury market’s ability to digest the supply of long duration Treasuries coming via Treasury auctions.
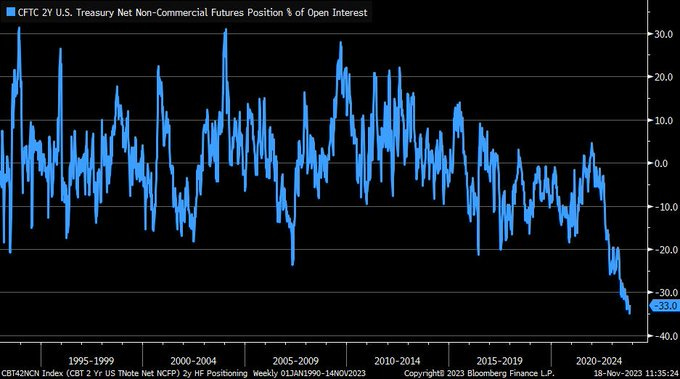
Fortunately, “CTAs are very very short bonds” as Stuart Kaisar of Citi said on CNBC Fast Money on Wednesday. But which maturities are these CTAs short? The Fast Money crew didn’t ask him. But we know one maturity that they are big time short:
- Daily Chartbook@dailychartbook – Wed Nov 22 – “Back to near-record negative territory for large speculators’ net short positioning in 2-year Treasuries.” @LizAnnSonders
With Treasury rates Ok, the rest of the investment world was stable:
- Dow up 1.3%; SPX up 1%; RSP (equal weight) up 1.2%; NDX up 91 bps ; SMH down 37 bps; RUT up 56 bps; IWC up 74 bps; DJT up 1.1%;
The mega-cap techs were ok:
- AAPL down 44 bps; AMZN up 1%; GOOGL up 1.2%; META up 77 bps; MSFT up 2.7%; NFLX up 2.9%; NVDA down 3.1%;
But financials were weak:
- BAC down 83 bps; C down 1%; GS down 35 bps; KRE down 1.8%; SCHW down 62 bps; JPM up 61 bps;
Dollar was a little weak with UUP down 31 bps & DXY down 44 bps. Overseas markets rallied modestly:
- EEM up 59 bps; EWZ up 90 bps; EWY up 48 bps; EWG up 82 bps; FXI up 1%; KWEB up 3%; EPI up 32 bps; INDA up 27 bps;
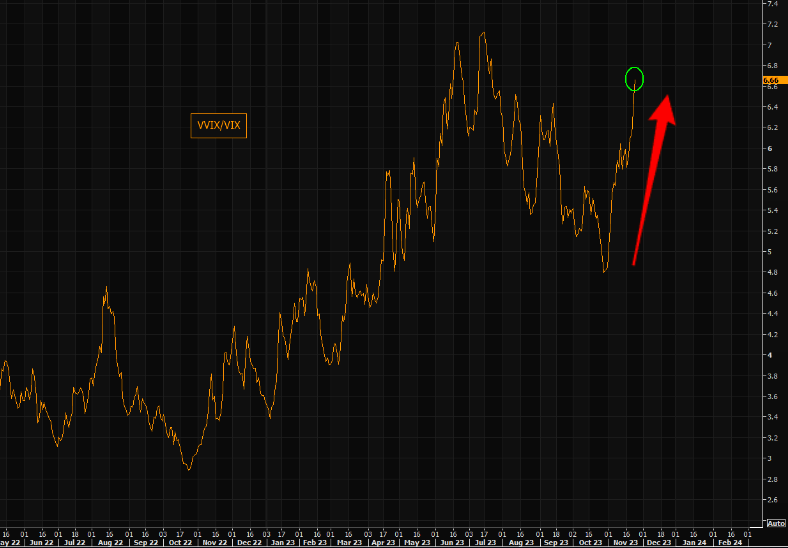
The most positive indicator for equities was the VIX down 9.7% to sub-13. But is another ratio chart warning about VIX?
- Via The Market Ear – Fri – 6.66 – The VVIX vs VIX ratio has exploded to the upside in November and closed at 6.66 today. Source Refinitiv
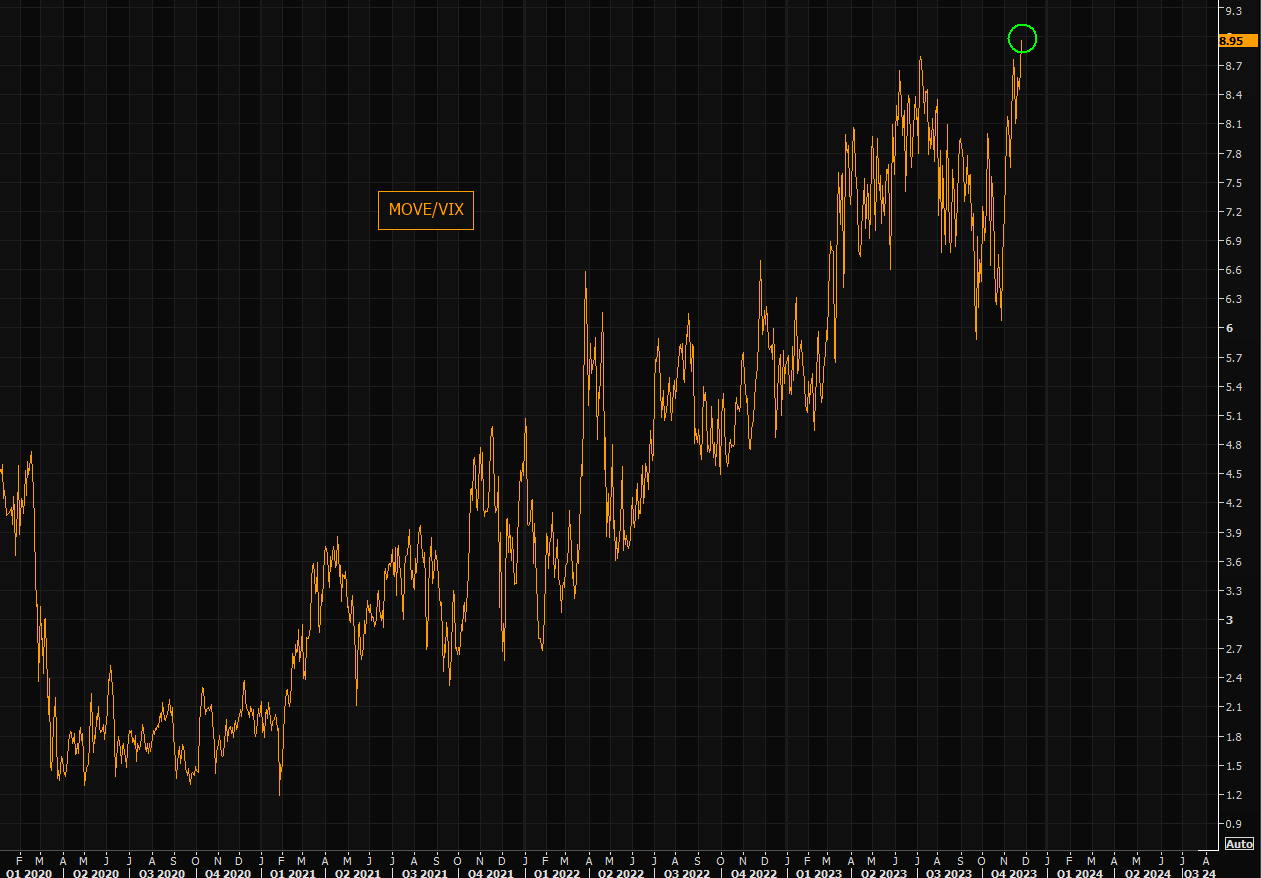
Sub-13 VIX showed up in another ratio that is now at all-time high:
- Via The Market Ear – Fri – ATH – The MOVE vs VIX ratio at all time highs. Source Refinitiv
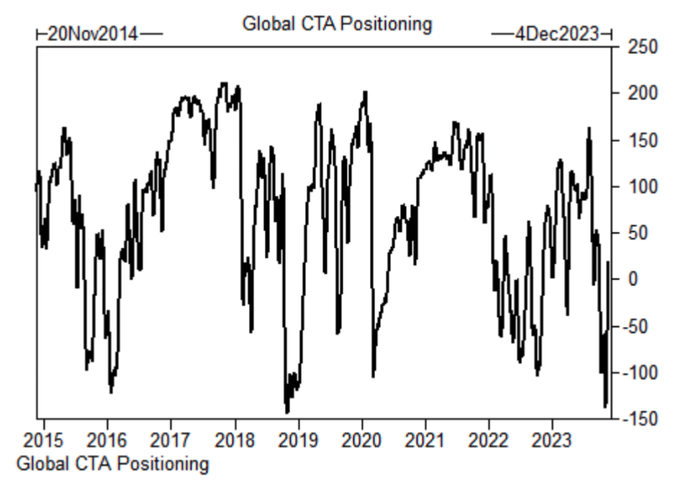
Perhaps the VIX fall has to do with the buying in the past 10 days:
- Daily Chartbook@dailychartbook – CTAs bought $153bn of global equities over the past 10 days, the most on record. They are buyers in every scenario over the next week, per GS models. via GS Cullen Morgan
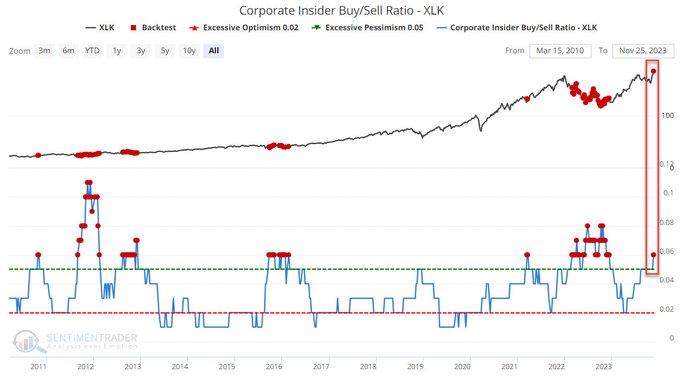
All this is fine. But what about insiders of companies, especially insiders of tech companies that are leading the stock market?
- Jay Kaeppel@jaykaeppel – Sat – There they go again. Despite all the concerns about tech being overbought (and many argue, overdue for a clobbering), tech corporate insiders apparently disagree. Make of it what you will. @sentimentrader
With the Dollar down, Commodities did well:
- Gold up 96 bps; GDX up 3.1%; Silver up 2.4%; SLV up 2.5%; Copper up 1.5%; FCX up 2.8%; Oil up 32 bps; Brent up 77 bps; OIH up 36 bps; XLE up 13 bps;
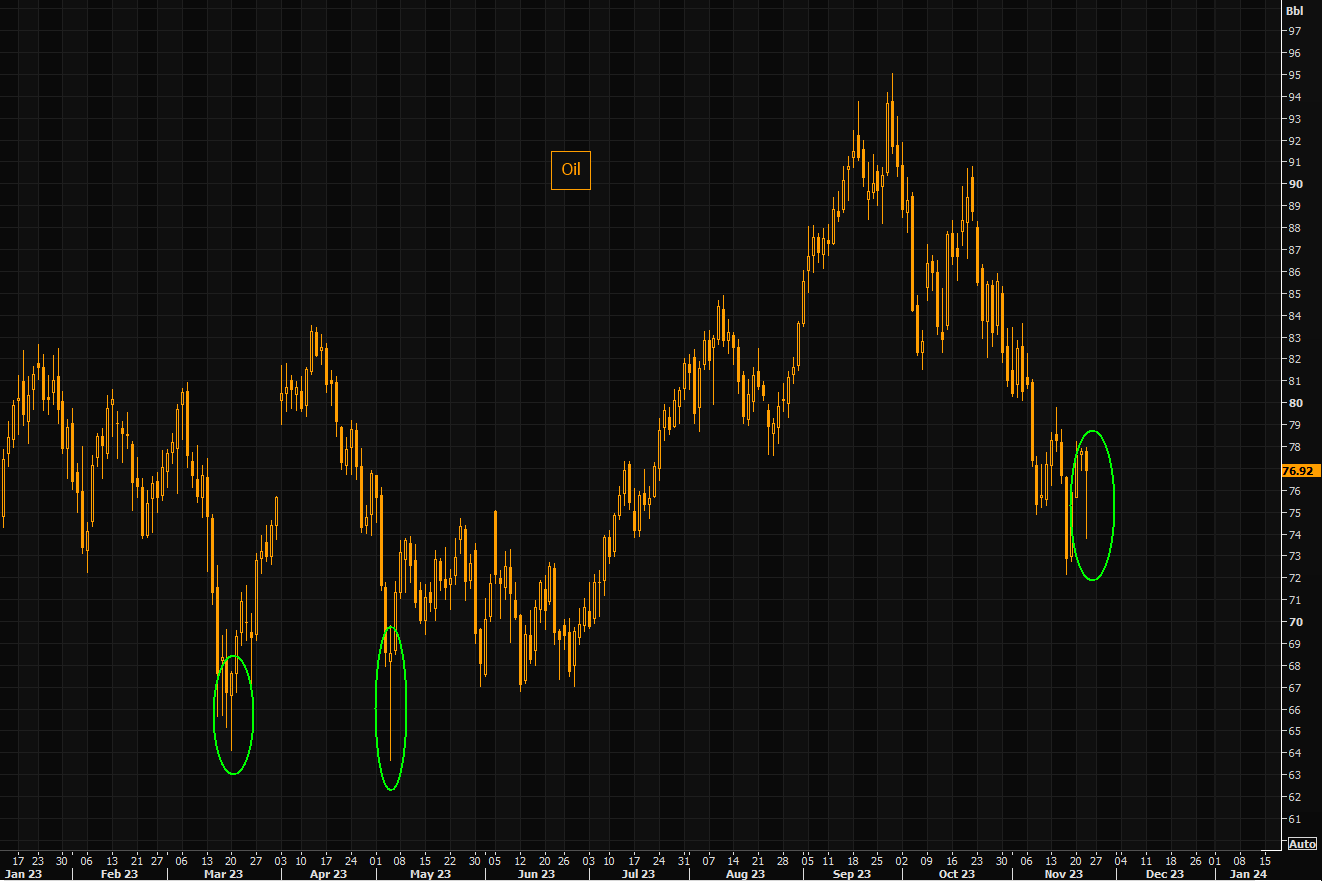
Speaking of Oil,
- Via The Market Ear – Friday – Hammer Time – Oil loves making local lows with massive hammer candles. Today we had one of those big hammer candles. GS recently outlined a strategy for the fairly bullish view (more here). Source Refinitiv
Since we began with action in Treasuries, why not end with Treasuries for balance?
- Larry Tentarelli, Blue Chip Daily@bluechipdaily – Multiple bearish daily 20/50-sma crosses in bond yields and USD. $USD $UUP + yields for 3M, 2Y, 5Y, 10Y, 30Y. Bullish 20/50-sma crosses for $TLT and $HYG. If yields and USD hold here or trend lower, should be a continued tailward for $SPX $NDX $TLT.
2. First a Soft Landing & then?
The markets are in a rally mode and much of that is being attributed to the near certainty of a soft landing. The theory is that the Fed is done & so after the soft landing we should get an up move in the economy.
That certainly was not the case in the great financial crisis in 2006-2009. As Thomas Hoenig, ex-President Kansas City Fed, pointed out on Wednesday:
- “ … in some ways we are still reasonably early in the cycle; around the great financial crisis, it was more than 2 years after the Fed stopped raising rates that we had our first major banking problems – Bear Stearns, Fannie-Freddie, Lehmann … “
Then he added about the Fed:
- ” … so they have to be cautious & they are being …. if it is just commercial real estate then the Fed will come out of it in pretty good shape but what I am worried about is if we are in early stages of spreading beyond commercial real estate to commercial industrial loans …. there is a lot of repricing going on in the markets right now; Fed knows that … a lot of risks still await them … they have a long ways to go before we are thru this, … “
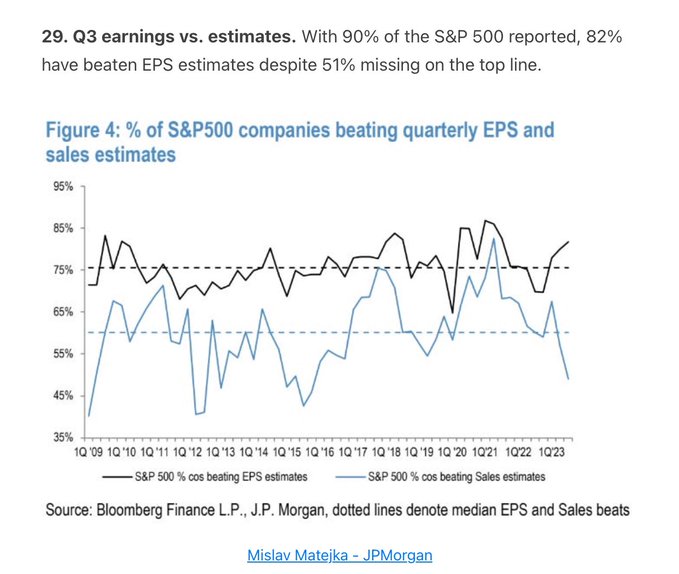
Below is an interesting point why companies are showing rising margins despite weakeneing sales numbers:
- Albert Edwards@albertedwards99 – The unusual divergence in the chart tells me that that the sales cycle has decisively turned downwards in the last quarter (aka recession) but that companies have used the cover of rapidly falling raw material input costs to boost margins even further – aka Greedflation.
3. A 4-day Thanksgiving for the 3rd straight year
With a sincere nod to those from Ohio, we highlight the below:
Go BLUE!
Send your feedback to editor.macroviewpoints@gmail.com Or @MacroViewpoints on Twitter
