Summary – A top-down review of interesting calls and comments made last week in Treasuries, monetary policy, economics, stocks, bonds & commodities. TACs is our acronym for Tweets, Articles, & Clips –our basic inputs for this article.
Editor’s Note: In this series of articles, we include important or interesting Tweets, Articles, Video Clips with our comments. This is an article that expresses our personal opinions about comments made on Television, Tweeter, and in Print. It is NOT intended to provide any investment advice of any type whatsoever. No one should base any investing decisions or conclusions based on anything written in or inferred from this article. Macro Viewpoints & its affiliates expressly disclaim all liability in respect to actions taken based on any or all of the information in this article. Investing is a serious matter and all investment decisions should only be taken after a detailed discussion with your investment advisor and should be subject to your objectives, suitability requirements and risk tolerance.
1.“economy is downshifting a little bit“
said NY Fed President William Dudley in his interview with CNBC’s Steve Liesman on Friday morning. By now, everyone understands that markets are responding to only one factor – Fed’s potential response to the downshift in the US economy. A week ago, we argued that QE4 possibility drove the financial markets on last Friday. What happened this week? The best week for the S&P in 2015 and the 3rd best week for Oil since 2009. But what happened to gold & silver, the most obvious beneficiaries of new QE?
- Lawrence McDonald ?@Convertbond – Lawrence McDonald Retweeted Axios
Since the September Fed Meeting Silver +12% Gold +4% Pricing in #QE4 #Fed
For some unearthly reason, Dudley kept insisting that the October Fed meeting was still “live” for raising rates. They probably think this nonsense maintains their credibility. They are the only ones who think so. But what about further easing?
- Stock Trade Alerts ?@AlertTrade – *DUDLEY: NEGATIVE INTEREST RATES NOT A CONVERSATION RELEVANT NOW it keeps coming up b/c QE has failed and we need… http://money.zulutrade.com
Well, the markets don’t really care right now because they heard Dudley’s “economy is downshifting” line and didn’t need to listen anymore. Because the markets know Dudley & Yellen. And the Atlanta Fed came out with its own downshifting of Q3 real GDP to 1.0% from 1.1%.

But that is growth. How about inflation?
- Thursday – David Rosenberg – “Market based” inflation expectations – The 10-year breakdown inflation rate has plunged;one year it was 1.93%. two years ago it was 2.20% – today, 1.51%
2.Bonds
Think about it – the economy, already lukewarm, is now downshifting, inflation is coming down hard and the Fed has no chance of raising rates in the near future. Isn’t this tailor made for interest rates to fall? But they didn’t. In a week in which everything under the sun rallied hard, treasury interest rates went up, nay shot up – 3-year, 5-year, & 10-year yields went up 12 bps and the 30-year yield went up by 10 bps. Could you spell QE4 any better?
Think about it – HYG & JNK, junk bond ETFs, rallied 3.2% & 2.8% this week while TLT & EDV, Treasury ETFs, fell by 1.8% & 2.7% resp. And this in a “downshifting economy“? If this doesn’t signal market expectations of additional liquidity, what will?
But Treasury yields, especially in the long end, do eventually march to the tune of inflation.
- Bloomberg SURV ?@bsurveillance – Today’s Single Best Chart: HSBC prepares for disinflation in the bond market http://bloom.bg/1QdC6JZ
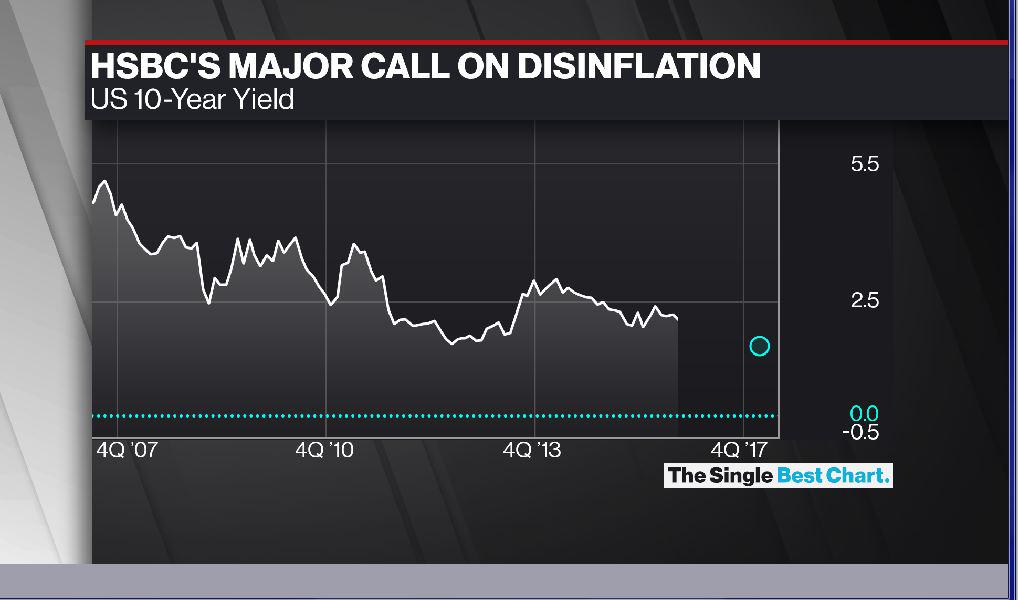
Yes, HSBC reduced their 10-year yield target to 1.5% for year-end 2016. If they are right, is there any chance the Fed will raise rates in 2016? However, what happens in the short term is anyone’s guess. And not even a savant like Mark Arbeter is willing to go out on that limb.
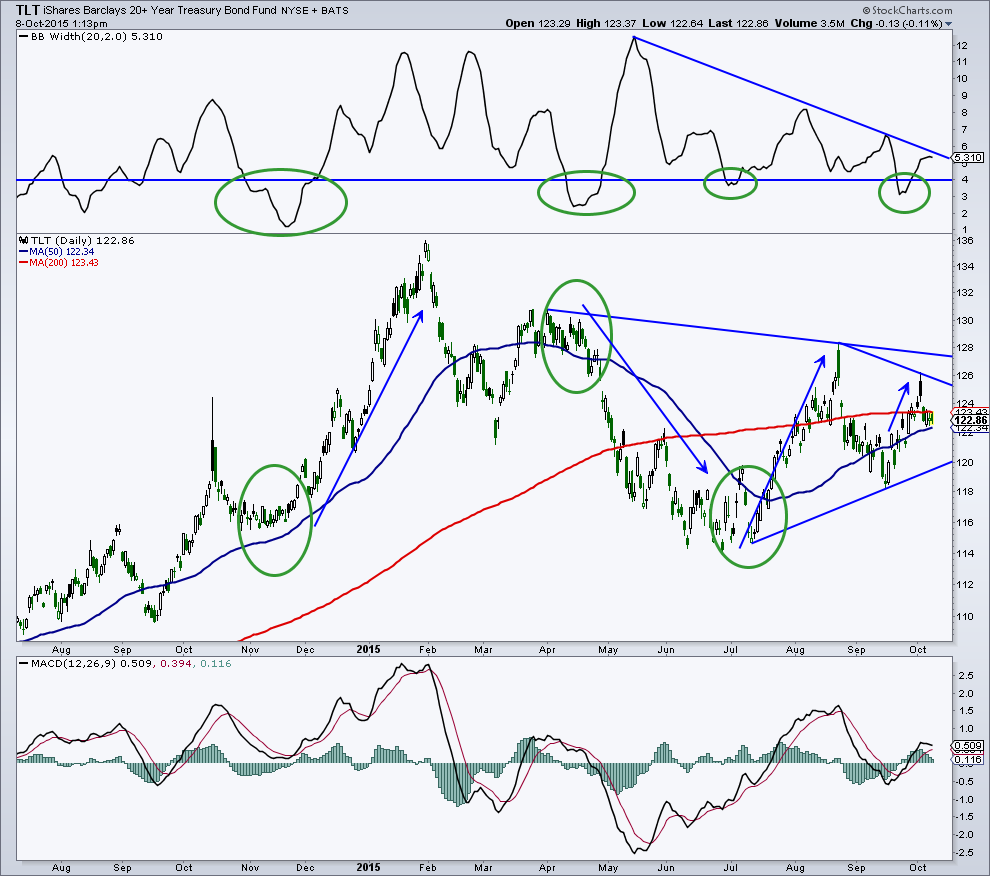
- Mark Arbeter, CMT ?@MarkArbeter – $TLT range shrinking, BB width tightening. Prior and recent times led to big moves. Something to watch. $TNX, $TBT
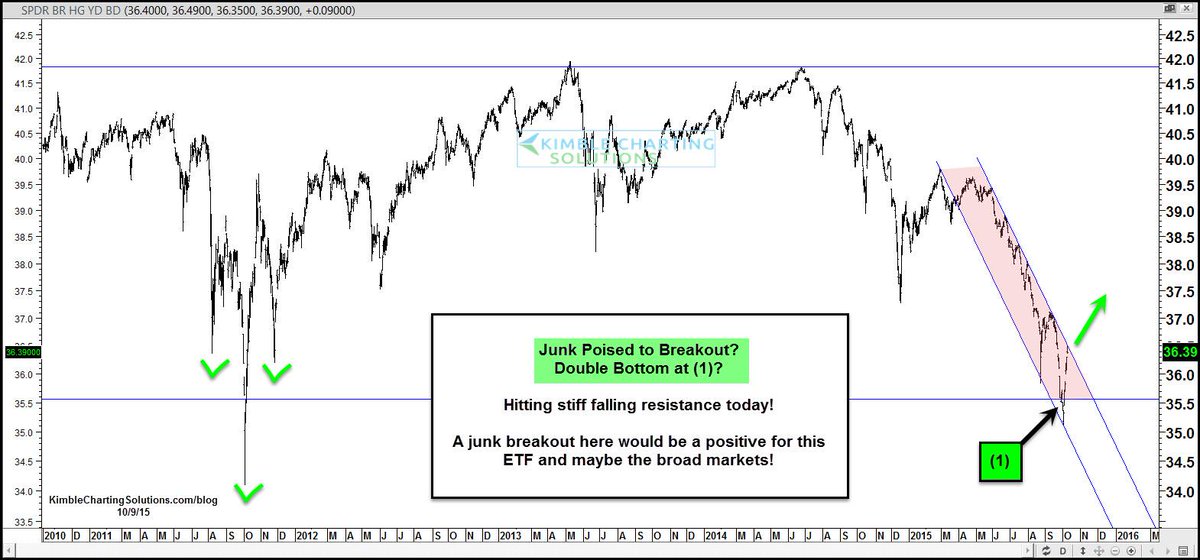
Junk seems easier:
- Chris Kimble ?@KimbleCharting – Junk poised for a breakout, which could benefit broad markets if it does! $JNK $SPY $SPX $HYG
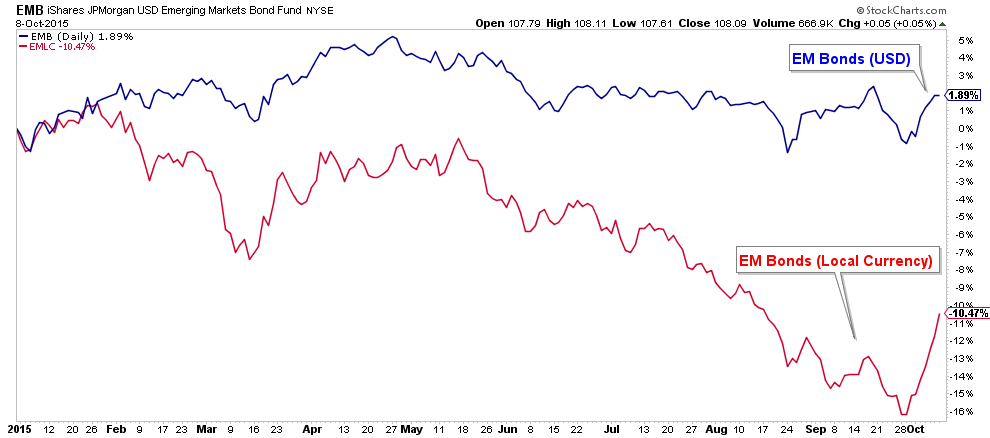
If Junk bonds look fine, can EM Debt look any different?
- Charlie Bilello, CMT ?@MktOutperform – EM local currency bonds catching a bid this week. Good sign, want to see this continue. $EMLC
That doesn’t mean the problems with EM debt have been addressed. Read what Carmen Reinhart of Reinhart & Rogoff fame, wrote in her article The Hidden Debt Burden of Emerging Markets:
- “In short, though emerging economies’ debts seem largely moderate by historic standards, it seems likely that they are being underestimated, perhaps by a large margin. If so, the magnitude of the ongoing reversal in capital flows that emerging economies are experiencing may be larger than is generally believed – potentially large enough to trigger a crisis.”
Prof. Reinhart may prove right but not any time soon. That seems to be what markets & HSBC are saying right now.
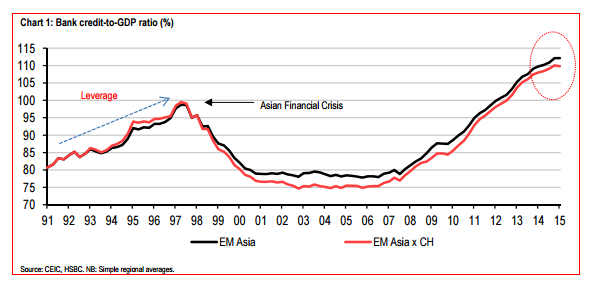
- ValueWalk @valuewalk – HSBC: Asian Debt Has Exploded, But No Imminent Stress http://www.valuewalk.com/2015/10/hsbc-debt-explodes/ … @MarkMelin
3. Stocks
We said already that this past week was the best week for the S&P this year. But that description seems so insipid, doesn’t it? Last week, there was fear of the Dow breaking 16,000 to the downside. The Dow did break 16,000 but to the upside by crossing over 17,000.
- Urban Carmel ?@ukarlewitz – Irony: breath so weak peeps feared a bear market transitions now to breadth so strong market looks overcooked
But doesn’t a picture tells it better?
- Charlie Bilello, CMT ?@MktOutperform – NYSE: Over 9 times as as many 52-week highs as 52-week lows, highest ratio since April.

Talking about momentum,
- Urban Carmel ?@ukarlewitz – NYMO 95 right now. That’s very hot. Last time was 7/3/12. This high only handful of times in past 15 years
Yes, the stock market is overbought and sentiment is feverishly bullish. But that could be interpreted either way:
- Charlie Bilello, CMT ?@MktOutperform – $NYMO at highest level since ’12.
If ur bearish: mkt is “extremely overbought”; If ur bullish: pos “breadth thrust”
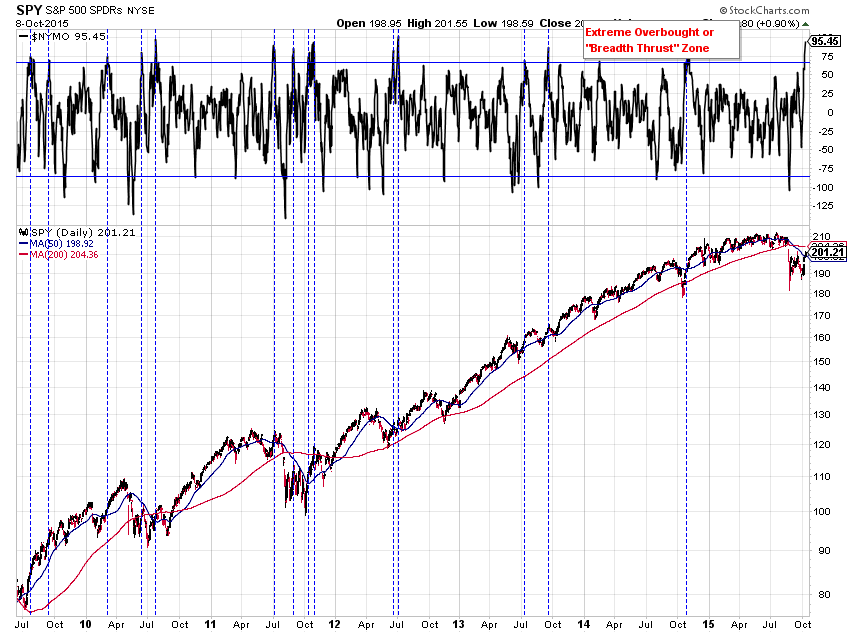
But the real question is whether the next move is up or down.
3.1 Up?
Next week is Options Expiration week. That suggests some fast & furious action. We remember how nasty the August & September expirations were. But that was in a downtrend. Now the markets seem pointing upward. Will that lead to another bonfire of the shorts?
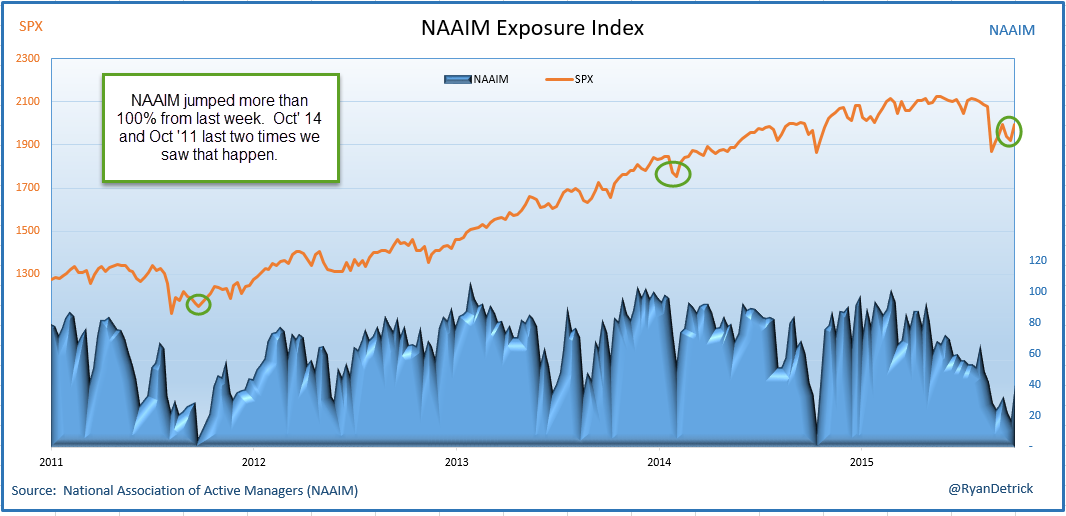
- Ryan Detrick, CMT ?@RyanDetrick – NAAIM jumped more than 100% last week. Last did that in Oct ’14 and Oct ’11. Check out this chart, major $SPY lows.
- Dana Lyons ?@JLyonsFundMgmt – (Post) Impressive Bounce For Stocks Following Re-test — But Will It Last? – via @YahooFinance $SPY http://tmblr.co/Zyun3q1vmTXat
The conclusion of this detailed discussion:
- “similar rallies strongly suggests that, while heavier volume would have been preferable, this rally can continue in the intermediate-term“
A more clear cut opinion comes from:
- Chris Kimble Retweeted See It Market ?@seeitmarket – New Post – “Double Bottom On S&P 500 Could Have Big Implications” http://www.seeitmarket.com/double-bottom-on-sp-500-could-have-big-implications-stocks-14852/ … by @KimbleCharting $SPY
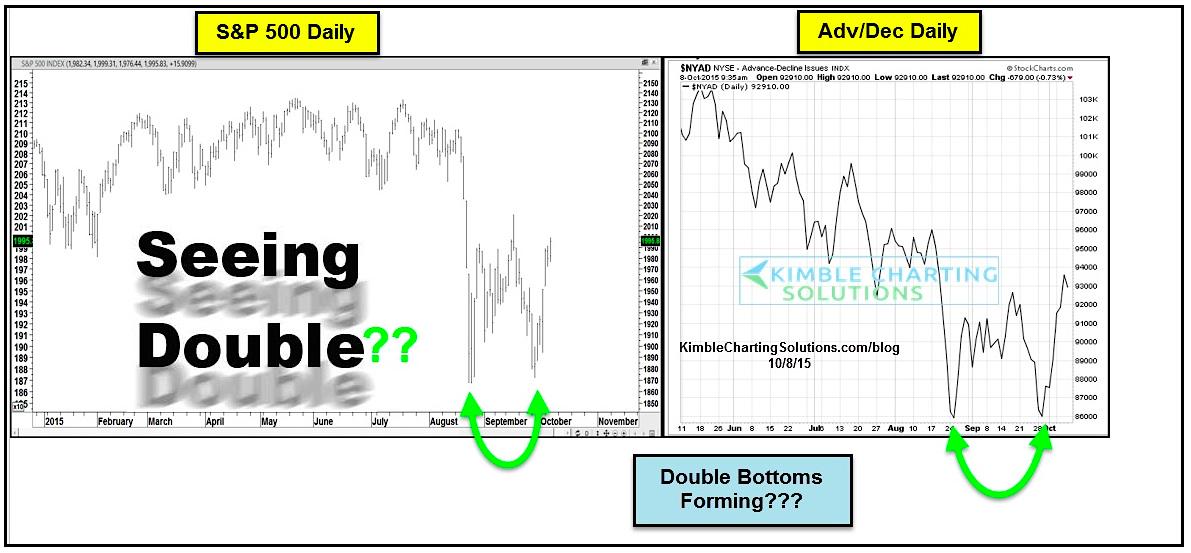
Chris Kimble writes in his article:
- If there’s one bullish formation that investors like to see it’s a double bottom pattern. Could this be occurring on one of the major U.S. stock market indices? Well, if this potential turns into reality it would be very bullish for stocks.
- U.S. heavyweight, the S&P 500 Index, recorded a low of 1867.01 on August 24th and a low of 1871.91 on September 29th. And since the second low (a retest), the S&P 500 has rallied all the way back up over 2000.
- The potential S&P 500 double bottom comes just above the 4-5 year rising channel support, which makes it all the more important!
- So what should we watch for over the near-term?
- Should the index push above the initial rally highs at 2020 (middle of the “W”), the double bottom could have legs (perhaps en route to a retest of the highs), But one sticky area will need to be overcome as further confirmation: 2040-2050. That price band is a overhead resistance made up of prior supports (now resistance).
- Lastly, the potential double bottoms on the S&P 500 comes at a time when we are seeing a similar double bottom formation in the NYSE Advance-Decline Line (a good barometer of market breadth).
- This potential double bottom formation could have major implications for stocks. A breakdown below the existing double bottom lows would bring lots of risk and volatility, while continuation higher may signal an end to the downturn. The coming days ahead will be important to stay tuned!
3.2 Down?
First, the immediate term:
- Ryan Detrick, CMT ?@RyanDetrick – October has started off strong, but the next few days are historically weak. $SPY
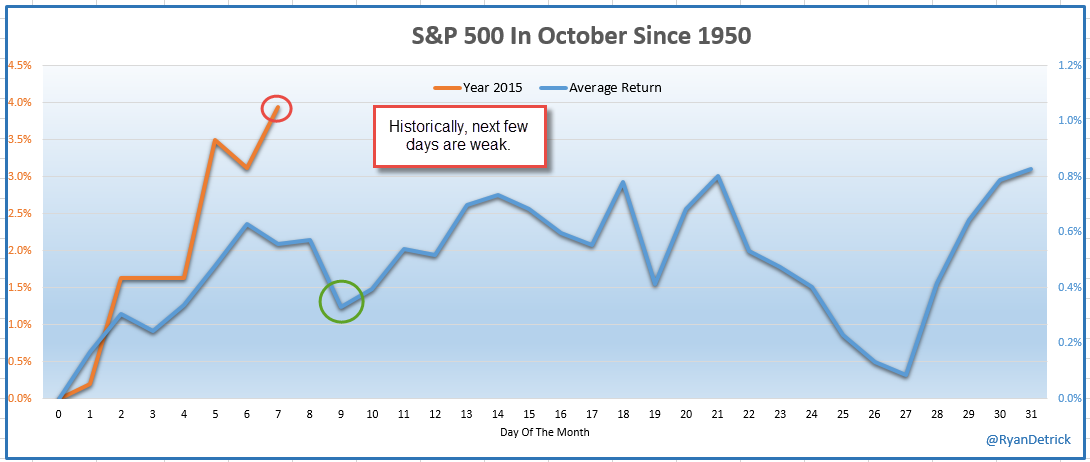
But what about the big thrust in breadth this week? Read how Tom McClellan ended his article Zweig Breadth Thrust Signal:
- “I am one of the biggest believers in the world about the idea of stock market breadth being one of the best tools we have to indicate financial market liquidity. But based on this evidence, I cannot offer much in the way of optimistic commentary about this current ZBT signal, especially since it has occurred at a point that appears to be the early stage of a new downtrend. Robust rallies within downtrends are great opportunities to get ready for the next phase of the downtrend. The problem is that they often disguise themselves that way, when in reality a new uptrend is beginning after a long bear market. This current moment does not seem like the end of a long bear market just yet.”
A clear cut opinion comes via:
- J.C. Parets ?@allstarcharts – NEW POST: The Overhead Supply is Near http://allstarcharts.com/the-overhead-supply-is-near/ … $ES_F $SPY $SPX
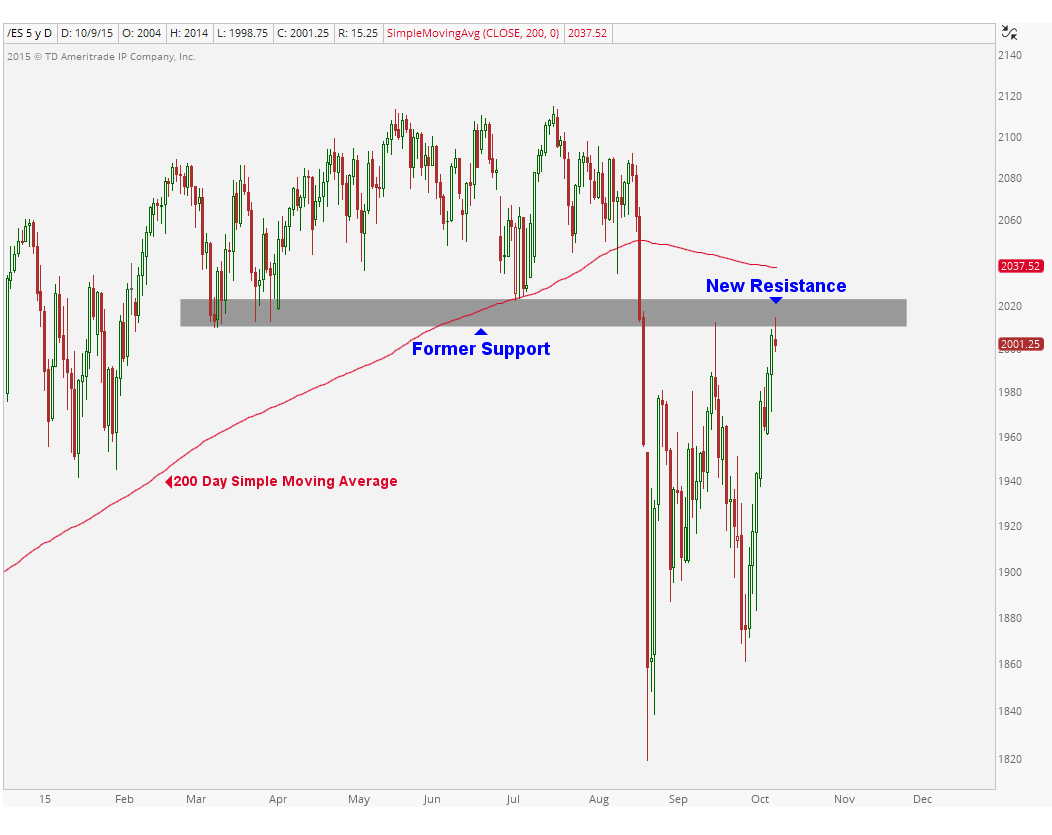
Parets writes:
- I think the overhead supply is currently too close for comfort for me to want to get aggressively long at this point. What was a good risk/reward opportunity on the long side just 10 days ago is no longer the case from where we stand today; far from it in fact. I think the S&P500 Futures are the cleanest example of why I’d rather be taking profits up here and lightening up than putting on new long positions.
- Also look at how prices are trading below a downward sloping 200 day simple moving average. This is not characteristic of an uptrend. It’s actually something we like to look for in downtrends. So we ask ourselves: Do we want to be selling into resistance in a downtrend? My answer is a clear yes.
- We saw a nice bounce over the last 2 weeks, terrific. We’re happy to see it. But I think it’s now behind us and we need to move on. We want to be sellers up here.
- What can change my mind moving forward? I think if we can hang out up here next week and not give back to much of this rally, that would be positive for sure. If we can stay above 1980, that would be awesome. It would give the market an opportunity to digest these gains and absorb some more of the overhead supply that is so obnoxiously clear in the chart above. Time is what is needed here in my opinion.
- What can make things worse? If prices head down and retest the lows since August for a third time, I think that could be disastrous. The more times that a level is tested, the higher the likelihood that it breaks. If we get down there again in the near future, it would increase the chances of a fourth or even fifth test and eventual downside resolution. I actually think this is the higher probability outcome from where we stand today, but I’m keeping an open mind regardless. The market doesn’t care what I think.
- I’m a net seller up here. We’ll keep reevaluating of course, but the risk/reward is no longer skewed in favor of the bulls.
Next week come earnings. Will they matter a lot? We doubt it simply because the rally has very little to do with fundamentals or valuation. It was a massive liquidity-expecting rally off of extremely oversold conditions (DSI of S&P was 7 on Thursday, October 1). We remember a similar rally in October 2007 that ended abruptly when, after talking & walking very dovishly in August & September, Chairman Bernanke surprised the market by being very hawkish in the October 2007 FOMC statement. The market began falling on November 1, 2007 and soon after that came the deluge.
Today we have a Fed insists on talking rate hikes. What if this rally continues into the October 28 FOMC meeting and that emboldens the Fed to either raise or promise to raise in December (as they did in 2013 with the taper)? How will this stock market that has rallied by smoking hopium of QE4 handle the shock of an imminent Fed hike?
3.3 Emerging Markets
EM stock markets & EM currencies tend to go hand in hand. And EM currencies rallied with EM stocks this week.
- Karl Snyder, CMT ?@snyder_karl – EEM currency breakout may have some running room on a price relative basis $CEW $UUP
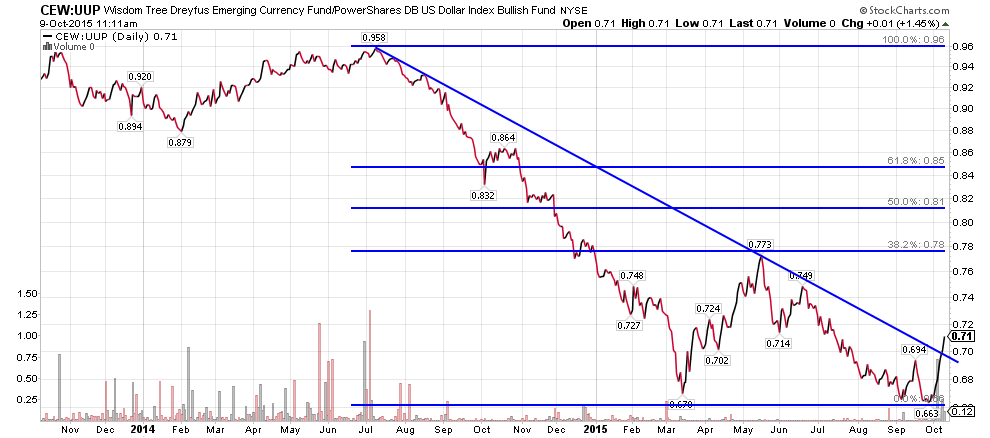
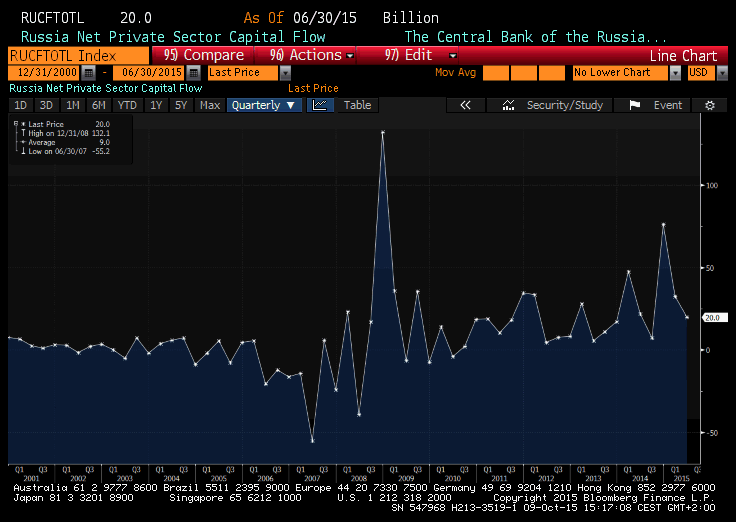
The rally was uniform from severely beaten down markets to relatively outperforming markets:
- Holger Zschaepitz ?@Schuldensuehner – #Russia sees net capital inflow of $5.3bn in 3Q, first net inflow since 2010.
And,
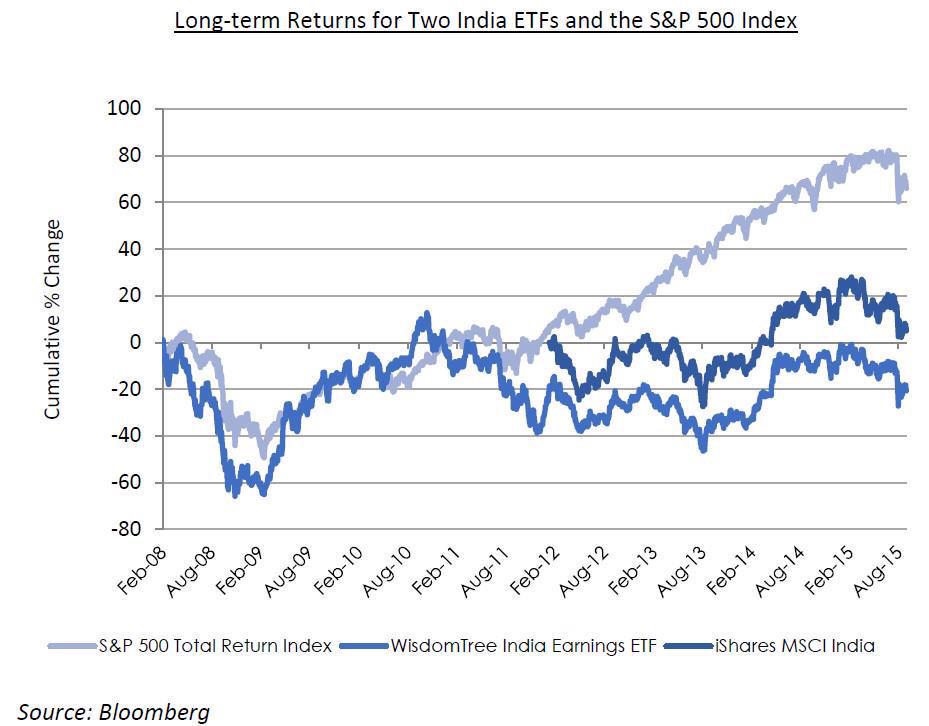
- Lawrence McDonald ?@Convertbond – Buy India vs Sell US Chart from @valuewalk
4. Oil & Gold
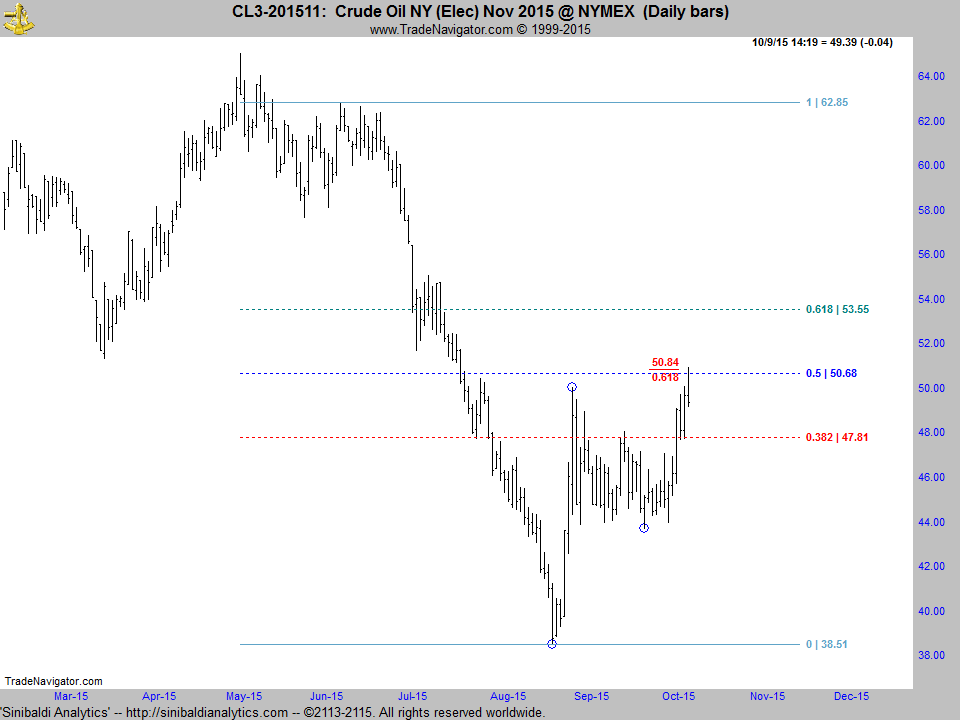
Oil had its 3rd best rally since 2009. And Energy stocks went vertical. Russia shooting missiles into Syria via Iran & Iraq didn’t hurt. These are conditions where no one would want to go short oil over a weekend. Dennis Gartman went long oil with an emphatically bullish call on CNBC FM. Many may argue that the rally is overcooked and should be faded. But few would call this a failed breakout, except:
- Sinibaldi Analytics ?@elliottwavelive – A failed breakout in Crude Oil? #crudeoil #elliottwavelive
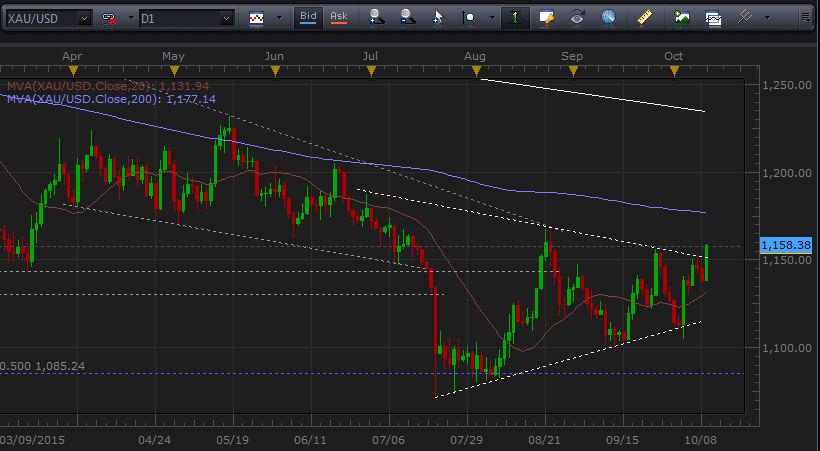
Gold has been very frustrating. Its rally has been weak especially relative to oil except on Friday:
- John Kicklighter ?@JohnKicklighter – Hammer the Dollar enough, and gold will eventually respond it seems. Metal clears its wedge top at 1,150
Silver went up 5% this week and the rally in GDX, the Gold Miner ETF, was real and spectacular.
Send your feedback to editor@macroviewpoints.com Or @MacroViewpoints on Twitter