Summary – A top-down review of interesting calls and comments made last week in Treasuries, monetary policy, economics, stocks, bonds & commodities. TAC is our acronym for Tweets, Articles, & Clips – our basic inputs for this article.
Editor’s Note: In this series of articles, we include important or interesting Tweets, Articles, Video Clips with our comments. This is an article that expresses our personal opinions about comments made on Television, Tweeter, and in Print. It is NOT intended to provide any investment advice of any type whatsoever. No one should base any investing decisions or conclusions based on anything written in or inferred from this article. Macro Viewpoints & its affiliates expressly disclaim all liability in respect to actions taken based on any or all of the information in this article. Investing is a serious matter and all investment decisions should only be taken after a detailed discussion with your investment advisor and should be subject to your objectives, suitability requirements and risk tolerance.
1.”don’t you bet against Us“
That’s what the Man said 7 days ago on Sixty Minutes.Yes, it was couched in diplospeak like “you don’t want to bet against the American economy“. But if you watch his eyes & his serious countenance, you know he meant what we paraphrased in the above title. Because he is the Man who is standing for the U.S. economy against an economic disaster.
Imagine where we would be if the markets were worried about the Fed’s ability or willingness to “overwhelm the economic damage from the Covid Crash“?. The quote is from Tom McClellan’s May 20 article titled Higher High for HY Bond A-D Line.
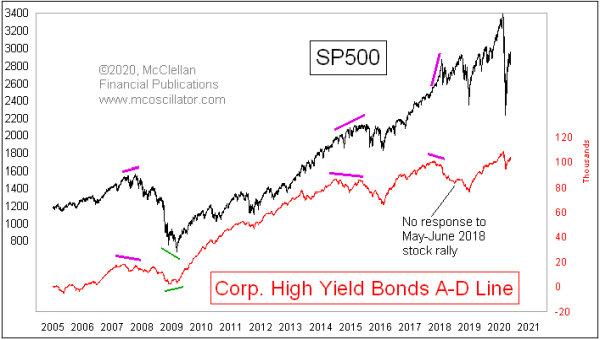
Tom McClellan concluded;
- “The Fed is meeting that threat with a torrent of liquidity, which may not necessarily be the right solution, but it is the one they are going with. And the message from high-yield bonds is that the Fed’s efforts are working.”
This is not mere chartwork. We read this week that companies have raised more debt financing so far in 2020 than the total amount raised in 2019. That is a clear cut positive at least for the medium term.
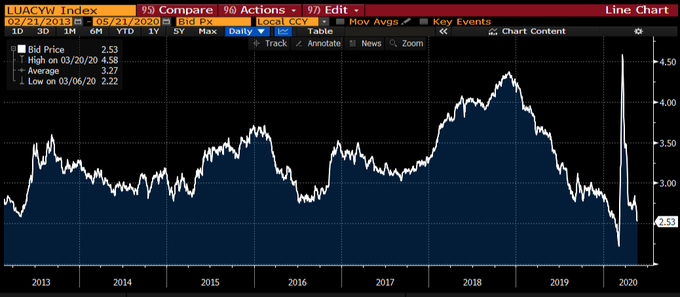
The above chart was about High Yield. What about Investment grade, you ask?
- Lisa Abramowicz@lisaabramowicz1 – – Investment-grade companies are rapidly adding leverage to their books, selling record amounts of debt amid a recession & surging jobless rates. Yet their borrowing costs have fallen to within half a percentage point of the all-time low.
Yes, at some point, they all will have to pay. But the Fed is saying don’t worry about that right now. And stocks follow credit, right?
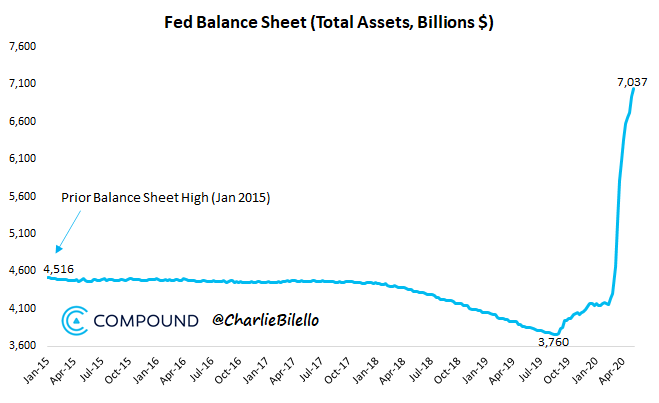
The markets have noted that the Man is not just talking but actually walking faster & ahead of the talk.
- Charlie Bilello@charliebilello – Fed balance sheet moves above $7 trillion for the first time with $2.9 trillion in assets purchased over the last 3 months.
That brings us to the ratio we introduced on May 2, 2020 in Section 3 of that article:
- “So we decided to look at ratios of market caps of big cloud stocks to the Fed’s balance sheet size – MCAP/FBS or MC/FB ratio. Actually it gets easier if we multiply the numerator by 100 to get a more intuitive MC/FB ratio. So as of Friday, May 1, 2020, the MC/FB ratio of Microsoft is 132.4T/6.7T = 20. And the MC/FB ratio of Amazon is 114T/6.7T = 17.“
And we also pointed out a totally counter-intuitive fact at that time:
- “Now go back 1-2 months when the Fed’s BS was only 4 trillion & Microsoft’s market cap was 1.1256T. So at that time, the MC/FB of Microsoft was 28. And Amazon’s MC/FB was 22.”
So what are the MC/FB ratios for Microsoft & Amazon as of Friday? Amazingly they remain at 20 & 17. Because the Fed’s balance sheet has increased by 5.7% & market-caps of both Microsoft & Amazon have also increased by the same percentage. That shows why we describe Chair Powell as walking faster & ahead of his talk.
This Market-cap/Fed BS ratio enables us to maintain some perspective about today’s reality that is screaming a dire warning using traditional measures that ignore Fed’s balance sheet size, meaning ignore Fed’s liquidity torrent:
- SentimenTrader@sentimentrader – The dash towards growth & tech: Russell Growth/Value ratio’s 14 month RSI right now is among the *HIGHEST* readings ever. This only happened: Feb 1980: stocks crashed next month in March 1980 Dec 1999: near end of dot-com bubble July 2015: stocks crashed next month in Aug 2015
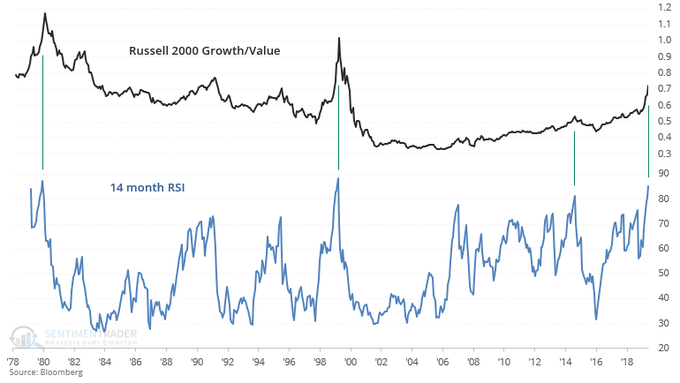
Yes, we were around in 1980 but not as investors. In contrast, we recall Dec 1999 very well. That crazy tech-telecom move ran hot for another 3 months to peak in last week of March 2000. And, as we also recall, the Fed had already signaled a determined campaign of raising rates & removing liquidity to stop that crazy dot.com run.
Aren’t we in a totally different Fed campaign right now? When does the most bearish commentator say the Fed will start reducing its balance sheet? Mid 2021?
We also focus on Microsoft & Amazon for a very basic fundamental reason – this is a terrific environment for these two companies & other cloud companies. Our point is that the Market-cap/Fed-BS ratio works best for companies that investment fundamentals are shining upon. So the only issue for such companies right now is valuation and that is 100% dependent on Fed’s liquidity engine and not on the earnings.
Finally, look how a previous leader in the social-media space is in a position to get big time into shopping-retail courtesy of the damage inflicted by CoronaVirus – small business can now set up a store on Facebook in minutes. Remember Kevin O’Leary has said for months that the small companies he is invested in find Facebook to be the most effective medium for marketing their message.
Now travel 10,000 miles eastward from New York & notice that Facebook has invested more than $5 billion in the Jio platform in India – a mass mobile platform that is linking small retailers with customers. That leverages Facebook’s WhatsApp, already the most dominant messaging/telephone platform in India.
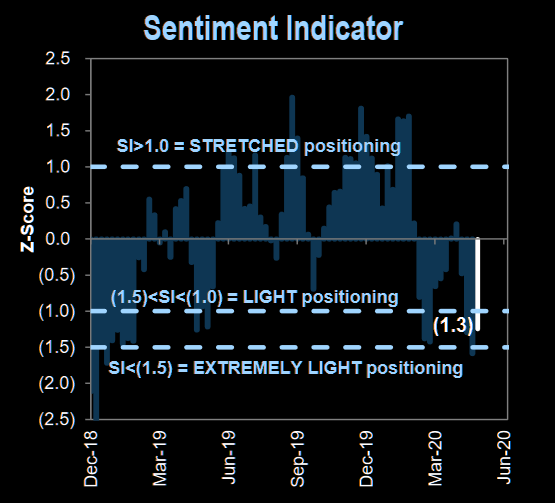
But isn’t this 30%+ S&P rally screaming sell? Aren’t those lucky & brave investors just itching to sell? And who is left to buy after this monstrous & totally counter-intuitive rally?
Read the following message & Goldman chart below, courtesy of The Market Ear:
- “GS Sentiment Indicator measures stock positioning across retail, institutional, and foreign investors versus the past 12 months. Readings below -1.0 or above +1.0 indicate extreme positions that are significant in predicting future returns“
2. Binary?
Haven’t the last four weeks signaled a binary condition? The weeks ended May 1 & May 15 were bad weeks for markets as we pointed out last week. Between those two bad weeks was what we called a “perfect week”, the one that ended May 8. Now we just had a week that was even more perfect than that “perfect” week:
- This week the Dow rallied 3.3% vs. Dow rally of 2.6% on May 8; Russell 2000 up 7.9% vs. Russell 2000 5.6% rally on May 8; Dow Jones transports up 9.1% this week vs. Transports rally of 2.3% on May 8;
As we pointed out last week, the two down weeks were courtesy of hawkish comments by Fed Chair Powell. Now this “perfecter” week was entirely due to a totally positive commitment of liquidity by the same Chair Powell. Why the difference?
The hawkish comments by Chairman Powell were directed towards markets & market participants. That did confirm our belief that Chairman Powell is not all that happy about the phenomenal rally in markets. But the 60 Minutes comments by Chairman Powell were directed towards the American people & to them he broadcast a total commitment to do whatever is needed. He also stated without any equivocation that there is “no limit to what the Fed can do“.
So where does the market go from here? Caroline Boroden used the word “Binary” to describe the market’s direction:
- If the S&P breaks out above the 200-day moving average, then the first target would be 3,720. But if the S&P 500 is unable to break out above its 200-day, then 2,766 would be the first downside target.
- The picture for NDX, Nasdaq 100, looks better given that NDX has broken above its 50-day & 200-day moving averages. So it only has to remain above last week’s low of 8860. Then the first upside target would be 9,660.
Watch Jim Cramer explain Ms. Boroden’s charts & methodology:
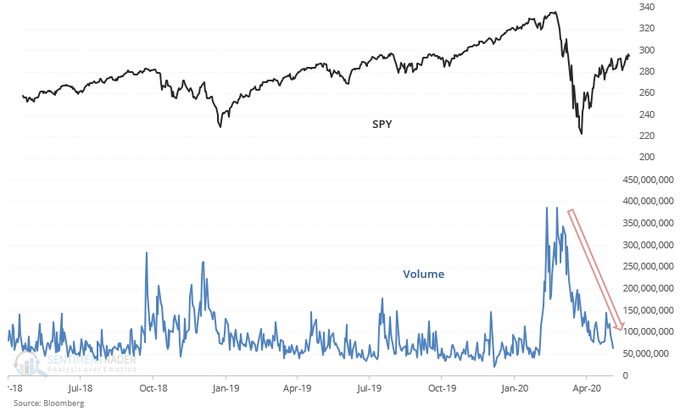
What could be a historical indicator that suggests a decline ahead?
- SentimenTrader@sentimentrader – Volume spiked in March and is now falling. SPY’s volume is now -64% below its 3 month average, while the S&P is under its 200 dma . When this happened over the past 20 years, U.S. stocks ALWAYS pulled back over the next 2 months, sometimes *very sharply*
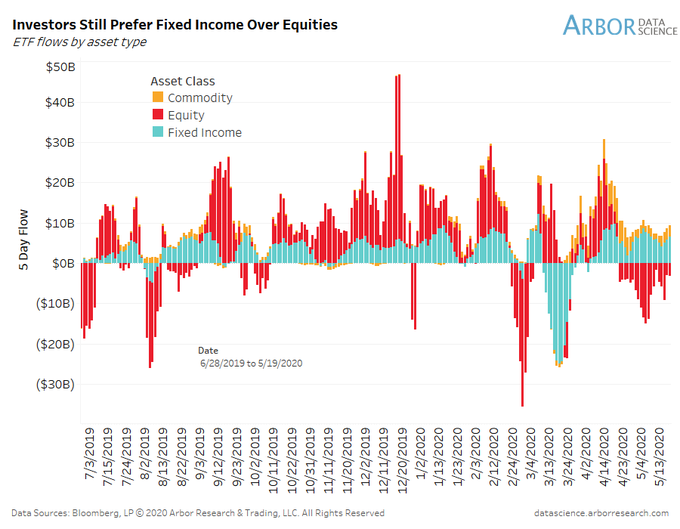
Are the inflows also suggesting such “wariness”?
- Ben Breitholtz@benbreitholtz – What’s wild is ETF flows for equities have been NEGATIVE since late April. On the flip side, all fixed income classes have seen inflows. Smells of wariness. Will flows eventually be matched by prices?!
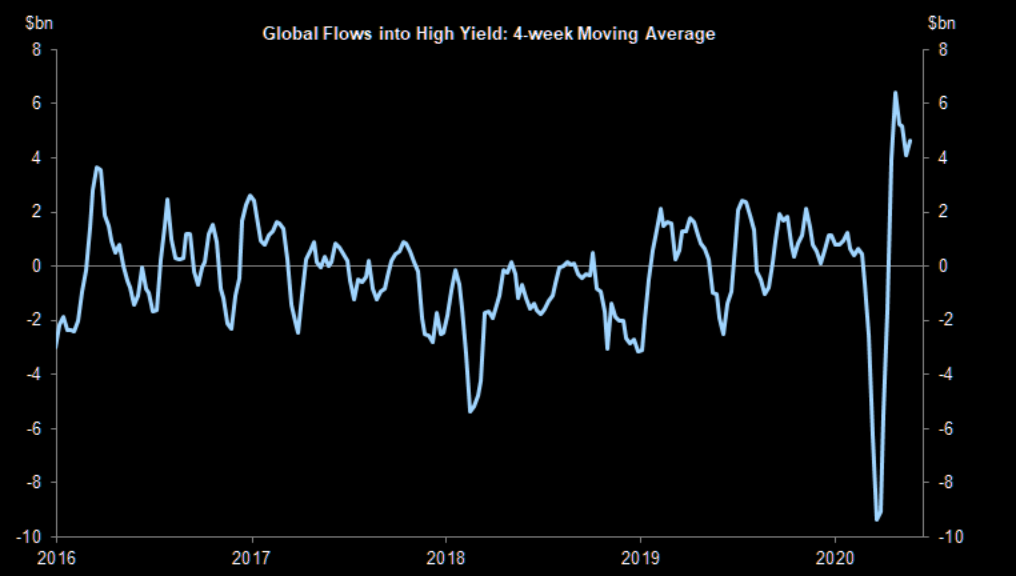
3. Rates & Credit
Indeed, as Market Ear pointed out – “The inflow into HY funds is……..”impressive“” via a chart from Haver:
You know why we call this past week “perfecter” than the week ended May 8?
- HYG was up 3.2% this week vs. up 95 bps on May 8; JNK up 3.3% this week vs. up 1.5% that May 8 week; DPG, leveraged closed-end credit fund, up 6.5% this week (twice HYG) vs. 3% that may 8 week; EMB, emerging markets bond fund, up 3.5% this week vs. up 2% that May 8 week.
What about TLT, the long maturity Treasury ETF? TLT was down 52 bps this week vs. down 1.2% the week ending May 8. And the Treasury curve steepened this week – 30-yr yield up 5.2 bps vs. 5-2 year curve up 2.5% on the week.
And the most amazing part of the Treasury action?
- Jeffrey Gundlach@TruthGundlach – – I have to laugh when financial media talking heads aver that China has “leverage” over the U.S. because China owns about $1 Trillion U.S. Treasuries and might sell in “retaliation”. Heck, the U.S. Treasury “sold” about that amount in April alone!
4. Dog that did not bark?
Yes, the U.S. Dollar fell this week, down 66 bps on UUP & down 62 bps on DXY. So Gold should have flown, right? Instead, Gold tell 1.1% & GDX, Gold Miner ETF, fell 2.5%. Newmont mining actually fell by 7%. But Silver rallied by 3.5%. Is the new leadership by Silver a good omen or a sign of a near-term top?
Of course, neither Oil nor Oil stocks showed any doubts. Brent was up 7.6% while WTI was up 1.3%. Energy ETFs, OIH & XLE were up 10% & 6.9%. Metals & Ags rallied hard with CLF up 14%, FCX up 3.5% & MOS up 14.5%.
A memorial week, indeed!
5. Another heroic woman
Two weeks ago, we featured a woman handling one of the the most complex & stress-filled jobs under actual combat conditions. That was Ms. Aggarwal running, as fighter controller, the world’s biggest dogfight between over 20 supersonic fighters.
This week we feature a very different heroic act by a 15-year old young woman under CoronaVirus lockdown:
- Ivanka Trump@IvankaTrump – – 15 yr old Jyoti Kumari, carried her wounded father to their home village on the back of her bicycle covering +1,200 km over 7 days. This beautiful feat of endurance & love has captured the imagination of the Indian people and the cycling federation!


Her father was injured & stuck in the town of Gurugram, near Delhi because of the CoronaVirus lockdown. So Ms. Jyoti Kumari asked her father to sit on the rear side carrier of her cycle and took him to his native place, covering 1200km (750 miles) in seven days.
This young woman is a true hero & she is now being recognized as one globally. Witness the tweet above from Ivanka Trump hailing her heroic act.
Sorry but we must ask why didn’t CNBC’s Sue Herera or the news team from Bloomberg TV highlight this in their daily news bulletins? They shoot out every negative blurb about India & Indians but somehow they missed this memorial act. Revealing, isn’t it?
Kudos to Ms. Ivanka Trump for noticing it & broadcasting it.
Send your feedback to [email protected] Or @MacroViewpoints on Twitter