Summary – A top-down review of interesting calls and comments made last week in Treasuries, monetary policy, economics, stocks, bonds & commodities. TAC is our acronym for Tweets, Articles, & Clips – our basic inputs for this article.
Editor’s Note: In this series of articles, we include important or interesting Tweets, Articles, Video Clips with our comments. This is an article that expresses our personal opinions about comments made on Television, Tweeter, and in Print. It is NOT intended to provide any investment advice of any type whatsoever. No one should base any investing decisions or conclusions based on anything written in or inferred from this article. Macro Viewpoints & its affiliates expressly disclaim all liability in respect to actions taken based on any or all of the information in this article. Investing is a serious matter and all investment decisions should only be taken after a detailed discussion with your investment advisor and should be subject to your objectives, suitability requirements and risk tolerance.
1.Bullish reason – “divergence” being realized!
We ended our article of last week with:
- “And if that leads to the Ukraine panic lessening in markets, then that would a divergence to laud.”
The “that” in the above quote was our view (expressed last week) of an “emerging divergence” in what was a clean & simple Ukraine story.
The panic re Ukraine did lessen this week & we saw TV coverage shift to other stories. Even the Ukraine focus seemed to shift from escalation to negotiations between Ukraine & Russia. And that was bullish for the stock markets. Look what Anastasia Amoroso of iCapital wrote in her article:
- “So even if the conflict continues, commodity prices are unlikely to spike as they did early in the conflict, and equities could rally in relief.”
And Brian Reynolds said on Thursday, March 17,
- “ … this correction is near the end; we still have headlines to come in Ukraine, headlines in inflation but its likely run its course … “
2.Bigger Bullish Reason – Maestro
Just look at the following 5-day charts of S&P, NDX, TLT & DXY to see for yourselves what happened on Wednesday at around 2;35 pm:
Going from last but not the least, DXY, the U.S. Dollar ETF, fell 76 bps on Wednesday, a vote for easing of financial conditions going forward. And stocks reacted as horses do when the gate is opened at Kentucky Derby. As the top 2 charts above show, stocks had fallen after the release of the FOMC statement at 2pm on Wednesday. But when Maestro Powell began speaking & especially when his “nimble” posture became visible, stocks took off & didn’t stop till the close on Friday.
How terrific was this week?
- Dow up 5.5%, S&P up 6.2%, NDX up 8.4%, RUT up 5.4%, IWC (Micro Caps) up 4.2%, DJT (transports) up 8.3%; EWG (Germany) up 9.1%; EEM up 6.6%; EWY (S. Korea) up 5.2%; Indian ETFs up 5-6% and, Chinese tech ETF KWEB up 29%. And the Dollar was down 92 bps.
Our “terrific” term seems so ho-hum compared to:
- Macro Charts@MacroCharts – – NDX updated: Strongest 4-Day Breadth Thrust in history. On track for 5D–10D Thrusts over the next week. Twitter feedback remains extremely negative (see replies all week). Classic Bull Market behavior.
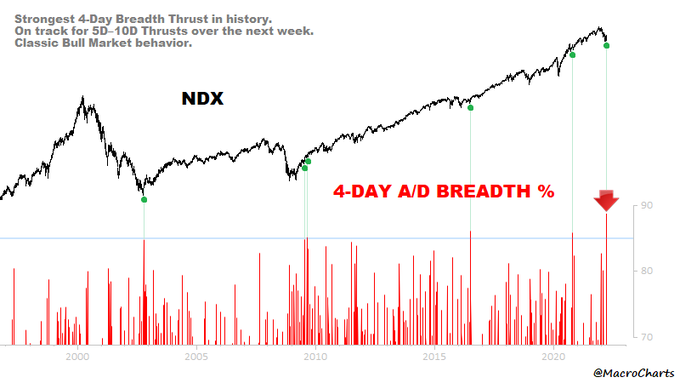
In their prior tweet on Friday, @MacroCharts had stated that such a breadth thrust had “never happened in 2000/2007 bear markets“.
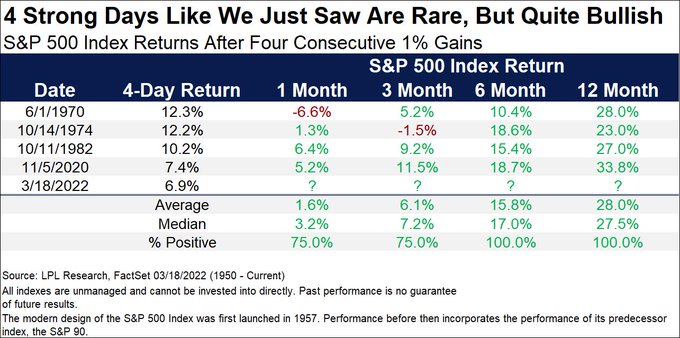
The sample size is small but the track record of what follows seems bullish:
- Ryan Detrick, CMT@RyanDetrick – – History was made this week. For only the 5th time ever, the S&P 500 gained at least 1% for 4 consecutive days. This rare occurrence is also quite bullish, as a year later it has been up more than 20% every single time with an average gain of 28.0%.
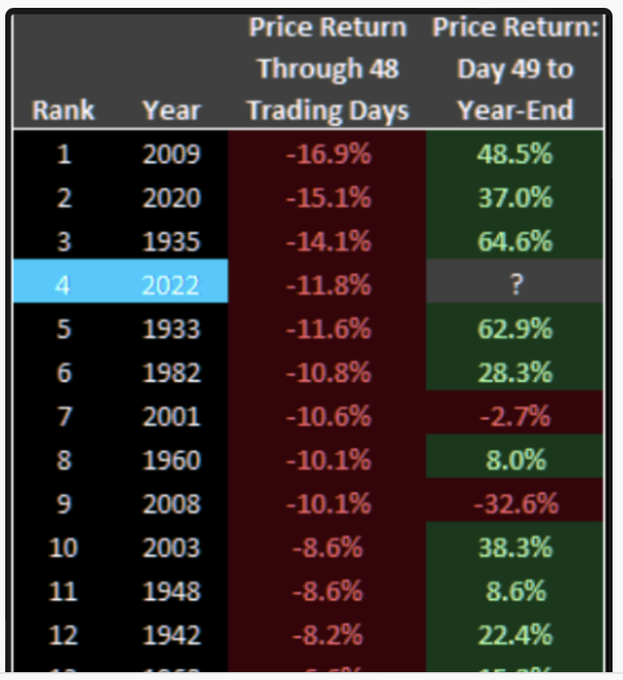
The above is fine but we give greater credit to one who was correctly bullish on Monday, the day when selling was intense & they used a different calendar factor:
- Cousin_Vinny@Couzin_Vinny – – $SPX HT @enriqueabeyta – – 4th WORST start to a calendar year for the S&P 500 ever! -11.8% in the 1st 48 trading days. Here is what happened NEXT the other times… #StockMarket $SPY pbs.twimg.com/media/FN0TUV7U
And another indicator provides the same message:
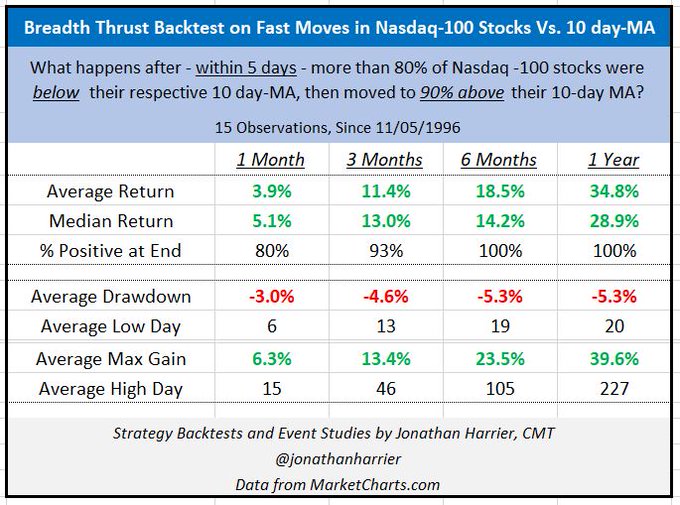
Wouldn’t it be ironic if after the same message from these different thrust indicators, the stock market actually declines next week? Just saying, not predicting!
3. 30-Year Treasury a Buy? Stocks as well?
This might have seemed scandalous to many before Wednesday. In fact, the cognoscenti have been uniform in trashing Treasuries all year & especially the 30-year Treasury bond. It took a brave investor like Scott Minerd to say “rates are topping” on Monday, two days prior to the Maestro’s signal. And that signal proved people like Jeffrey Gundlach correct. Recall that Gundlach had recommended a 25% weighting of the 30-year Treasury bond in the Double Line Roundtable in January. And on Tuesday, the day before the Maestro’s signal, Mike Wilson of Morgan Stanley said that he “agrees with Minerd that rates are topping here” and said “long duration Treasuries are not a bad idea if you are worried about growth“.
In his extensive & definitive conversation with CNBC’s Scott Wapner, Jeffrey Gundlach pointed to the big message from the bond market – “30-year bond rallied today“. He followed up more sacrilegious comments like “long bond saw its peak last year“, “long-end is a reasonably safe place to be“, “investors should own 30-yr bond because they will do well during turnover in economy” etc.
If that is not enough, technician Mark Newton of Fundstrat said the following around 5:25 am on pre-Maestro Wednesday morning to CNBC’s Dominic Chu:
- ” .. yields have moved up a bit too far a bit too quickly in my view & prices of TLT are down to prior lows; so it makes a lot of sense for portfolio managers to consider adding to duration as yields have moved up to over 2% on the 10-year …. I think overhead for yields is going to prove minimal & its going to be right to consider buying dips in recent pullback in bonds .. “
Gundlach also added that it makes sense for investors to replace cash by 2-year Treasury because he thinks the entire Treasury curve will peak around 2.5%.
The Treasury rate curve has stumbled into a “traffic jam” in yields, to use a Santelli term with 3-yr Treasury yield at 2.15%, 5-yr at 2.15%, 7-yr at 2.18% & 10-yr at 2.15% and the 20-year at 2.53% INVERTED vs 30-year at 2.41%. But the direction has been down.
No wonder Gundlach was positive towards Nasdaq stocks in the short run. What sensible investor would not be when 30-year Treasury yields are flattish to down, when VIX is felling from 35 to sub-24 by weekend & when the Maestro has promised to be “nimble”?
But which Nasdaq or growth stocks should one consider for a rally from here? The veteran duo of Larry Williams & Jim Cramer discussed 3 names on Friday’s Mad Money show.
- “Right now, the charts as interpreted by Larry Williams, suggest we’ve got incredibly bullish action in Google, very good bullish action in Amazon and money in the bank action in what we call knockout, Coca-Cola. I would not bet against Larry Williams,” .
We suggest reading the linked article to understand the charts of Larry Williams & why he thinks GOOGL, AMZN & KO should rally from here.
What about DeMark you ask?
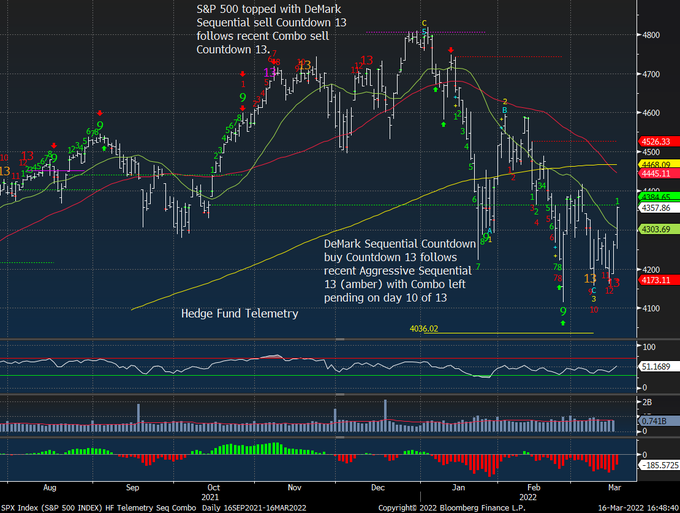
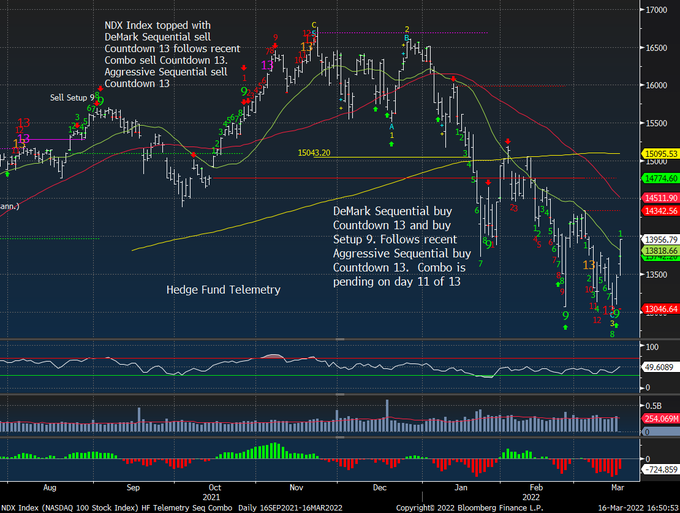
Guess this negated the death-cross in the S&P on Monday?
- Katie Stockton, CMT@StocktonKatie – – The day after the 50-day MA crossed below the 200-day MA, the $SPX registered the first counter-trend “buy” signal from Tom DeMark’s TD Sequential model during its corrective phase – a reason to be skeptical of the timeliness of the so-called “death cross” #fairleadstrategies
But what about corporate credit? Gundlach pointed out that yields in corporate bond market (investment grade) have gone up faster than in Treasuries & balance sheets are better. Specifically he said LQD has duration of 10, higher than that of 10-year Treasury. So “its ok to move into such areas“.
Isn’t that positive for stocks? Brian Reynolds said emphatically yes & explained why to CNBC’s Kelly Evans:
- “I think this is a correction within a long term bull market… credit investors have bought $150 billion of new corporate bonds, this despite all the turmoil in Ukraine & all the worries about the Fed; they keep buying corporate bonds & eventually that money is going into buybacks .. when stocks get above 4400-4500 on S&P, that’s usually a good time for Wall Street buyback desks; ….”
- “look at the Eurodollars futures market – we are already pricing in an easing cycle just as the tightening cycle begins … so it [rates] is pretty much baked into the markets already …”
- “Ukraine, Fed has run its course & if we get about 4400-4500 area on the S&P and hold that for a week or so, start to see the buyback desks activate, then its like what we saw in the prior 11 years before the pandemic – stocks go rocking back up after a sickening correction … “
- “outperformance will be concentrated on the largest buyback names; they have just started to outperform for the first time in months in awhile & I think that outperformance goes at least thru the summer, probably into the fall … “
4. Back to Ukraine
We are not saying that the Ukraine crisis is over. Just that the markets will be less concerned as long as the “war” remains within Ukraine without much fallout outside into Europe. The Chinese response to the pressure from President Biden also seemed calculated to keep the temperature down.
Send your feedback to [email protected] Or @MacroViewpoints on Twitter