Summary – A top-down review of interesting calls and comments made last week in Treasuries, monetary policy, economics, stocks, bonds & commodities. TAC is our acronym for Tweets, Articles, & Clips – our basic inputs for this article.
Editor’s Note: In this series of articles, we include important or interesting Tweets, Articles, Video Clips with our comments. This is an article that expresses our personal opinions about comments made on Television, Tweeter, and in Print. It is NOT intended to provide any investment advice of any type whatsoever. No one should base any investing decisions or conclusions based on anything written in or inferred from this article. Macro Viewpoints & its affiliates expressly disclaim all liability in respect to actions taken based on any or all of the information in this article. Investing is a serious matter and all investment decisions should only be taken after a detailed discussion with your investment advisor and should be subject to your objectives, suitability requirements and risk tolerance.
1.Event Risk – Italy-Europe
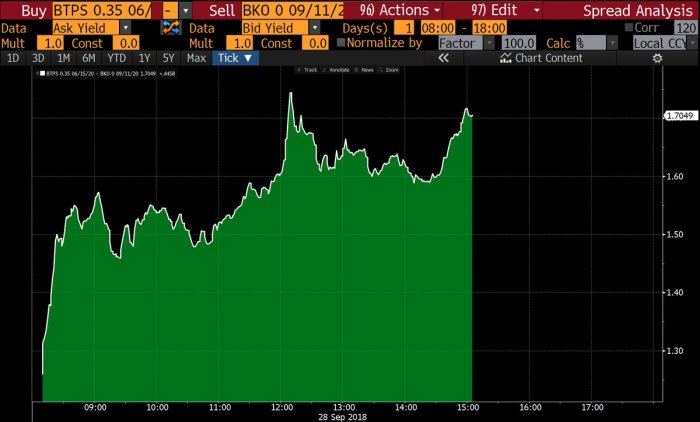
What a difference one day can make when event risk is involved! Not only was the Italian stock market down 4%, but Italian bonds also took a huge hit:
- jeroen bloklandVerified account@jsblokland– The spread between 2-year bond
#yields in#Italy and Germany is up a staggering 0.47% on the day! Total spread now 1.70%.
At least, Italian bonds are still trading, meaning capital is moving. Is there a scenario in which markets create a “stop” in capital?
- Lawrence McDonald @Convertbond – A downgrade by one notch by one or more rating agencies would place further pressure on Italian assets. By more than one notch could lead to negative self-fulfilling debt dynamics; under this scenario, a “sudden stop” in the supply of capital cannot be ruled out. – Goldman
Remember what Geopolitical Futures had written 4 weeks ago?
- “It is not a stretch to say, then, that the next chapter in the EU’s history has begun. … If Italy takes a hard line and its government can survive the resulting faceoff with the EU, it will put Brussels in a difficult position, one that could undermine the very fabric of the EU itself. … In the meantime, Brussels must decide just how tough it means to get with Italy. If the EU gives in, its authority may be weakened. But if it tries to treat Italy the way it did Greece, there might not be much of an EU left to govern. It is those impending negotiations – not Brexit, or any others – that will shape the EU’s immediate future”.
Clearly Italy understands what the austerity approach has done to Greece. They would never accept that. So they plan to generate growth to help with their debt load. But, as Larry McDonald of Bear Traps Report pointed out, – “Italy YoY GDP at 1.15% in the June 30 result. Only one year in the last ten (2010) was growth above 2%, debt to GDP near 140% will do that“
So the banks across EU got hit very hard, “some off as much as 8% today – index down 4.8%“, to quote Larry McDonald. What are the two words that transport Europe’s problems to America? Counterparty & Contagion. No wonder Bank of America, Goldman & other US banks fell by 4-5% this week.
Financials may have been rocked but the S&P was only down by 55 bps or 16 handles on the week and the Nasdaq 100 was up 1.2% on the week. So event risks, at least so far, have been like dogs who finally catch up to the car. What do the dogs do to the car then? That is why the Dow, while down 100 pts pre-market, began climbing around 10:00 am to about 100 points up and closed up 18 points.
2. FOMC meeting & presser
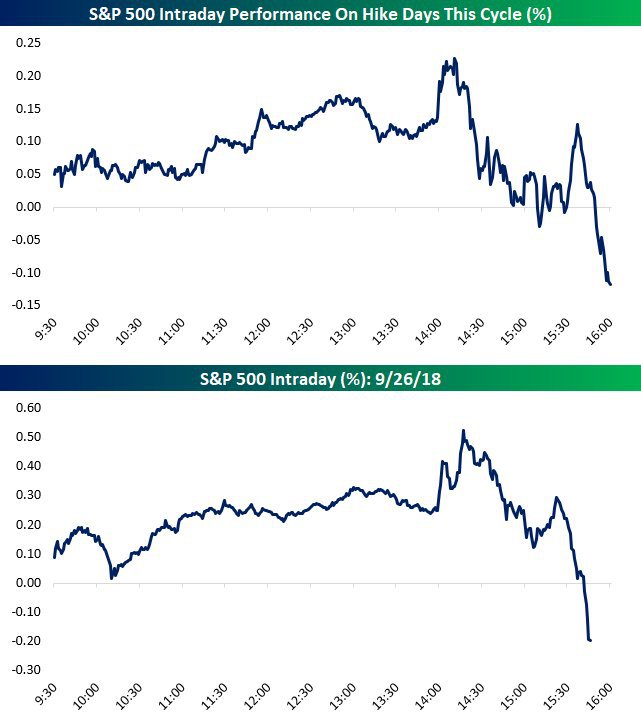
Same old, same old! Not only did the Fed raise 25 bps as expected, their guidance/talk was almost as expected. So why shouldn’t the S&P behave as it has on other rate hike days?
- Bespoke @bespokeinvest The resemblance between the S&P 500’s pattern today (bottom) and other rate hike days in this cycle (top) is absolutely uncanny.
$SPY
 And some of the commentary was also same old:
- Lakshman AchuthanVerified account @businesscycle After years of flooding the global economy with liquidity, the
#Fed is leading a global QE pullback, even with global growth in a cyclical slowdown.#ECRI https://goo.gl/CXYzHR
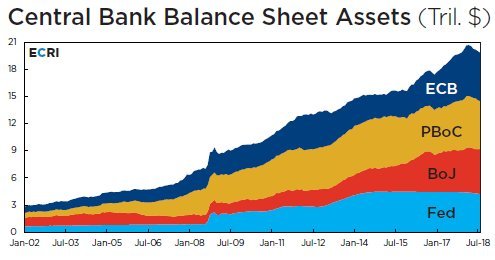 How should US interest rates behave when liquidity is removed in a slowdown?
- Urban Carmel @ukarlewitz –
$TLT reverses on day of rate hike. Yesterday’s and last week’s low (116) is very important (green line)#IBDPartner@IBDinvestors
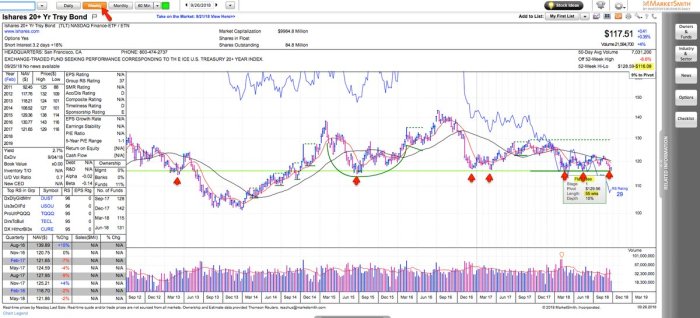 Not only did long rates come down post-Fed, but rates in the 2-5 year sector came down a bit more. But that merely reversed the pre-Fed rise in rates on Monday & Tuesday. So no discernible change week/week. Next week is the NonFarm Payroll report which could move rates.
The one difference was the recession alerts we heard & read from some smart gurus. Of course, they came to the recession possibility from two completely different predictions about interest rate movements. But more on in Section 4 below.
3. US Stocks
Thanks to Ryan Detrick, we actually have bullish comments this week about the near term:
- Ryan Detrick, CMT @RyanDetrick – Not surprisingly, it is quite rare to have a 6-month S&P 500 win streak heading into October, but did you know … October was higher 4 of the 5 times it happened (back to ’28)? Most recently last year.
And,
- Ryan Detrick, CMT @RyanDetrick – Over the past 20 years, no month has been stronger than October.
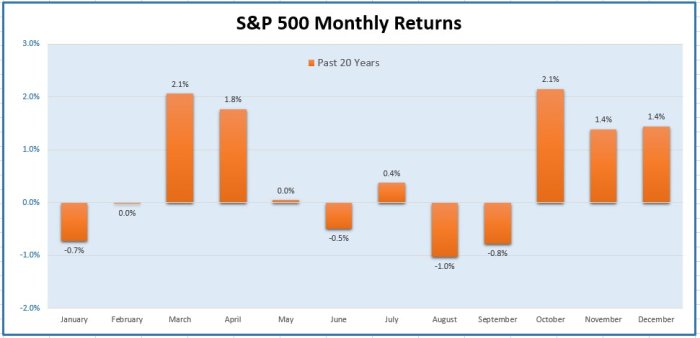 For those who think 20 years is too small a sample:
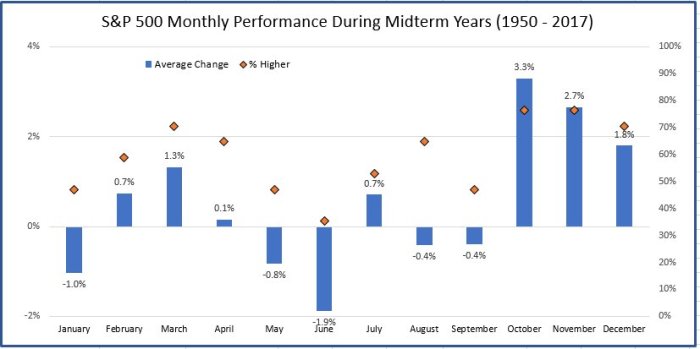
- Ryan Detrick, CMT @RyanDetrick – Since 1950, no month has been stronger for the S&P 500 during a midterm year than October.
Now to a tepid bullish comment from Lawrence McMillan of Option Strategist:
- “In summary, for now we remain bullish in line with the $SPX and $VIX charts. However, we are certainly not ignoring the divergences. … In short, we remain bullish until there is some violation of support on the $SPX chart.”
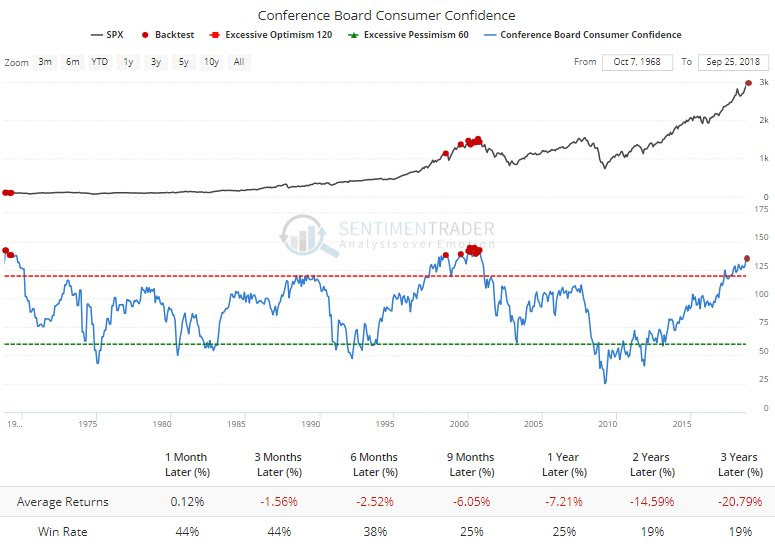
Next a cautionary tweet:
- SentimenTraderVerified account @sentimentrader – For those wondering if buy-and-hold is a good idea after a surge in confidence.
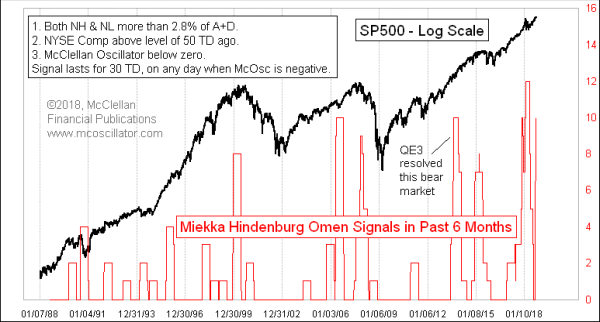
Speaking of Hindenburgs, not just one or two but Ten Hindenburgs to quote Tom McClellan:
- Now we are seeing this count rising up again to a very high level, which is a concern. Perhaps it is a big sign of trouble, or perhaps the transition to the period of positive seasonality in October will act as a stronger force to keep the uptrend going. The warning of trouble gets extra emphasis from the fact that we have a small divergence now between the major averages making a higher high in September while the NYSE Advance-Decline Line has made a divergent lower high. That divergence can be rehabilitated if the breadth data suddenly start getting stronger, but for now the dual message of trouble is worthy of our concern.
That brings us to a determined bull suddenly mentioning 2000 & 2007:
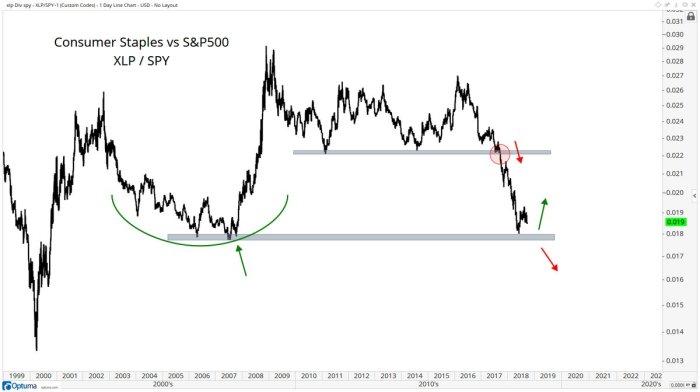
- J.C. Parets @allstarcharts Part of the bear case for US Stocks I think has to be that Staples are finally back down to 2007 relative lows, right before stocks crashed. Nice negative correlation bw Staples relative & S&Ps. But what if we break down and do not hold?
$XLP$SPY Long way to that March 2000 low
But the above is just about one sector. What about a 2007 analog for multiple sectors?
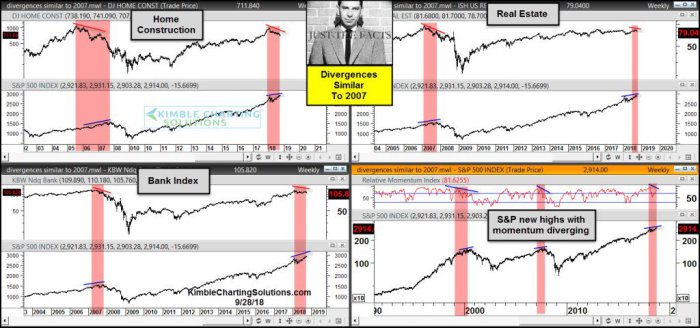
- Chris Kimble @KimbleCharting – Divergences Similar To 2007 Taking Place, Says Joe Friday https://kimblechartingsolutions.com/2018/09/divergences-similar-2007-taking-place-says-joe-friday/ …
- “Before the S&P peaked in 2007, Home Construction, Banks and Real Estate started creating a series of lower highs, diverging with the S&P. Divergences similar to 2007 are taking place of late. The long-term trend for each of these Stock indices reams up at this time! Stock market bulls hope that it’s different this time and that these divergences are just noise.”
But what about Small Caps, the one sector protected from overseas issues?
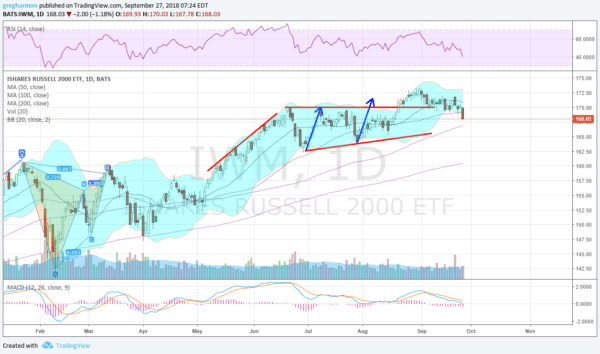
- Greg Harmon, CMTVerified account @harmongreg Dragonfly Capital – Are Small Caps in Trouble http://dragonflycap.com/are-small-caps-in-trouble/ …
$IWM
He writes:
- “The chart below suggests that the path of least resistance in the short run indeed may be to the downside. After a retest of the break out area the Russell 2000 ETF ($IWM) has continued to drop and is now back near the heart of the prior consolidation. This could be a new trend lower. The RSI is falling and now at the lower edge of the bullish zone and the MACD is dropping and about to cross to negative.”
- “There are some extenuating circumstances though to take note of. First, the drop has yet to make a lower low. Until it breaks the July low the trend of higher highs and higher lows continues. Second, those momentum indicators are not yet in bearish ranges. The 100 day SMA below has not been touched since early May and a reset there would be healthy.”
His sensible suggestion – “lets wait until at least Monday and the start of a new month and quarter to decide.”
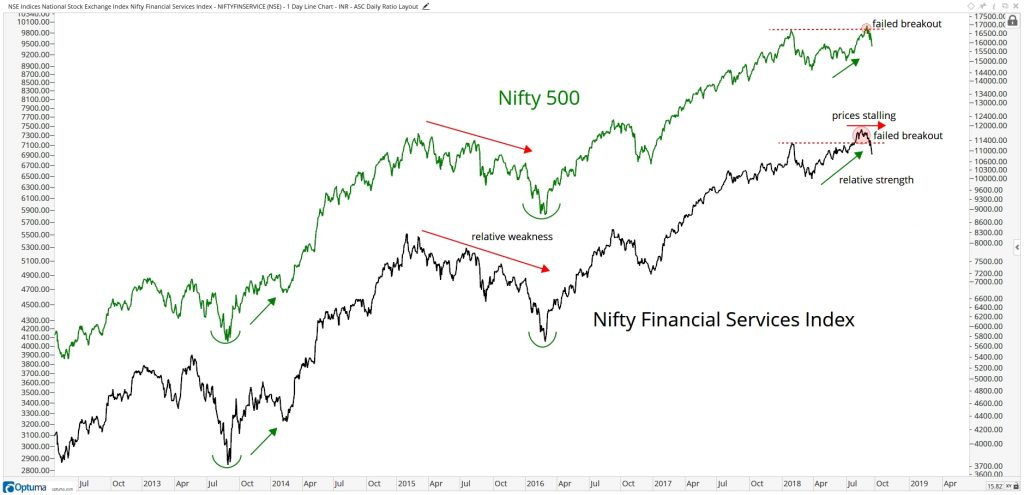
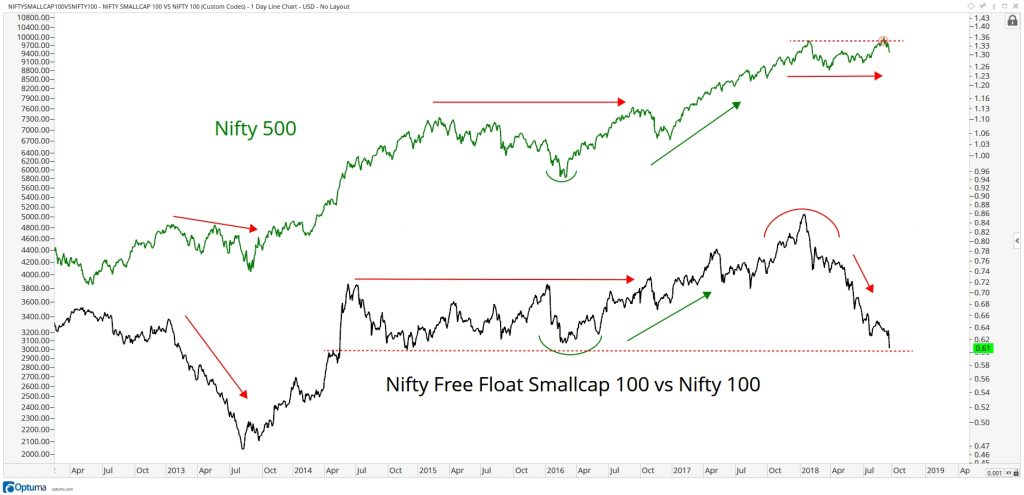
Any comments on EM? An old tenet says a big drop in an asset class doesn’t end until the most resilient component of that class finally breaks down to join others. We had quoted this 4-5 weeks ago and wondered whether the bear market in EM could possibly end without the Indian stock market breaking down & joining others. This week, the Indian stock market went down hard with the broad ETFs down 3-5% on the week. This action made even a fervent bull like J.C. Parets raise warning flags:
- “The major indices extended their losses late last week, with many of them closing at or below our tactical risk management levels on the long side. Despite the sector rotation we’re seeing under the surface, the dominance of large-caps continues to suggest a lack of risk appetite and weakness in the largest sector, Financials, continues to drag the market lower. Until we see stabilization in these two charts, we’re unlikely to see a resumption of the Nifty 500’s structural uptrend.“
4. Recession – Closer vs. Looming
After the Fed raised rates on Wednesday, Jim Rickards, author of “Currency Wars” wrote an article this week titled One Step Closer to Recession:
- “I’ve said repeatedly that the Fed is tightening into weakness. But it’s more than the rate hikes. The Fed is also winding down its balance sheet, and the pace is scheduled to accelerate next year.”
- “Far from printing money, the Fed is destroying base money at a rapid pace. The Fed is basically burning money. They’re doing this by not rolling over maturing Treasury and mortgage securities they hold on their balance sheet. That’s a “double whammy” of tightening.”
- “When a security held by the Fed matures and the issuer pays it off, the money sent to the Fed just disappears. It’s called quantitative tightening, or QT.”
- “The Fed knows a recession will happen sooner rather than later and is desperate to acquire some dry powder (in the form of higher rates and a reduced balance sheet) so it can use it when the time comes.”
- “The problem, of course, is that by pursuing these policies, the Fed will cause the recession it is preparing to cure.”
- “The single most important factor in my analysis is that when the Fed realizes its mistake of tightening into economic weakness, it will have to turn on a dime and shift to an easing policy.”
- “Easing will come first through forward guidance and pauses in the rate hike tempo, then possibly actual rate cuts back to zero and finally reversing their balance sheet reductions by expanding the balance sheet through QE4 if needed.”
Jim Rickards is a markets analyst who uses behavioral economics & complexity theory to analyze markets. Martin Feldstein of Harvard is a classical economist. He is also warning of coming recession, but from a totally different set of perspectives. Contrary to Jim Rickards, Martin Feldstein thinks Fed is too slow to raise interest rates & that will prove to be a problem. Below are excerpts from his article in the Wall Street Journal titled Another Recession is Looming:
- Share prices are high today because long-term interest rates are extremely low. … But long-term rates are beginning to rise and are likely to increase substantially in the near future. Though the 3% yield on 10-year Treasurys is still low, it’s still twice as high as it was two years ago. It will be pushed higher as the Fed raises the short-term rate from today’s 2% to its projected 3.4% in 2020. Rising inflation will further increase the long-term interest rate as investors demand compensation for their loss of purchasing power. And as annual federal spending deficits explode over the coming decade, it will take ever-higher long-term interest rates to get bond buyers to absorb the debt. It wouldn’t be surprising to see the yield on 10-year Treasurys exceed 5%, with the resulting real yield rising from zero today to more than 2%.
- As short- and long-term interest rates normalize, equity prices are also likely to return to historic price-to-earnings ratios. If the P/E ratio of the S&P 500 regresses to its historical average, 40% below today’s level, $10 trillion of household wealth would be wiped out. The past relationship between household wealth and consumer spending suggests such a decline would reduce annual spending by about $400 billion, shrinking gross domestic product by 2%. Add in the effects on business investment, and this spending crunch would push the economy into recession.
- But if one hits in the next few years, the Fed will not have enough room to cut rates, as the fed-funds rate is expected to rise to only 3% by 2020. There also won’t be much room for a major fiscal intervention. Federal deficits are expected to exceed $1 trillion annually in the coming years, and publicly held federal debt is predicted to rise from 75% of GDP to nearly 100% by the decade’s end.
- This means a downturn brought on in the next few years by rising long-term interest rates would likely be deeper and longer than your average recession. Unfortunately, there’s nothing at this point that the Federal Reserve or any other government actor can do to prevent that from happening.
5. Silver
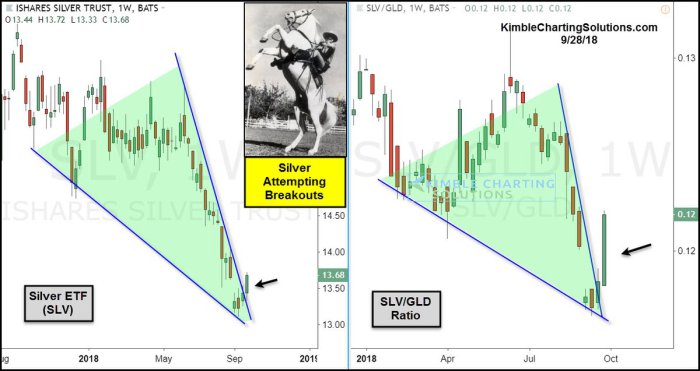
- Chris Kimble @KimbleCharting – Silver breaks out, haven’t seen this in a while! https://kimblechartingsolutions.com/2018/09/silver-breaks-havent-seen/ …
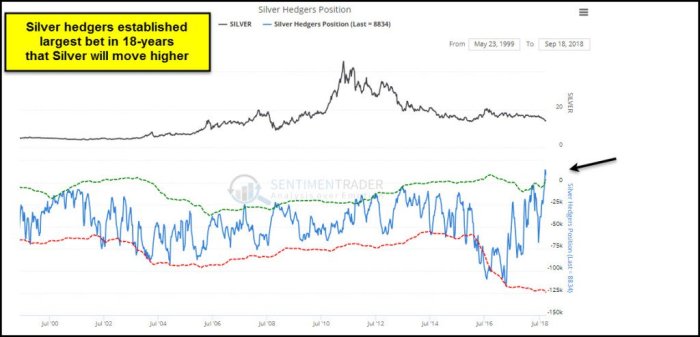 “At this time a very crowded trade is in play, an 18-year extreme. If history is a guide, Silver is currently closer to a short-term low than a high. … The declines in Silver and the SLV/GLD ratio have created potentially bullish falling wedge patterns over the past few months.”
Send your feedback to editor@macroviewpoints.com Or @MacroViewpoints on Twitter
