Summary – A top-down review of interesting calls and comments made last week in Treasuries, monetary policy, economics, stocks, bonds & commodities. TAC is our acronym for Tweets, Articles, & Clips – our basic inputs for this article.
Editor’s Note: In this series of articles, we include important or interesting Tweets, Articles, Video Clips with our comments. This is an article that expresses our personal opinions about comments made on Television, Tweeter, and in Print. It is NOT intended to provide any investment advice of any type whatsoever. No one should base any investing decisions or conclusions based on anything written in or inferred from this article. Macro Viewpoints & its affiliates expressly disclaim all liability in respect to actions taken based on any or all of the information in this article. Investing is a serious matter and all investment decisions should only be taken after a detailed discussion with your investment advisor and should be subject to your objectives, suitability requirements and risk tolerance.
1.”residual hawkishness“
This week pretty much confirmed much of the Fed situation. First, the Fed minutes on Wednesday that appeared to be so different than what we all heard on December FOMC day. So different that one mystery was resolved courtesy of one ex-insider. Look what Danielle DiMartino said on Fox Business:
- “Powell had not previously allowed the Fed minutes to be doctored. It was fairly apparent given yesterday’s minutes release that this time they were doctored.”
That realization was actually a positive because it showed us the new Jay Powell, the Powell who spoke publicly at the Washington Economic Club.
- David Rosenberg – There can be little doubt that Jay Powell (and others are the Fed) have walked back whatever residual hawkishness they had on the books
Jay & company must have felt good after the negative consumer inflation numbers on Friday. Actually, that number crystallizes a long term lower highs-lower lows pattern:
- David Rosenberg – Lower Peak Inflation – Over the past 30 years, since the late 1980s, the cycle lows in core inflation are getting lower, while the highs are also peaking out at lower levels
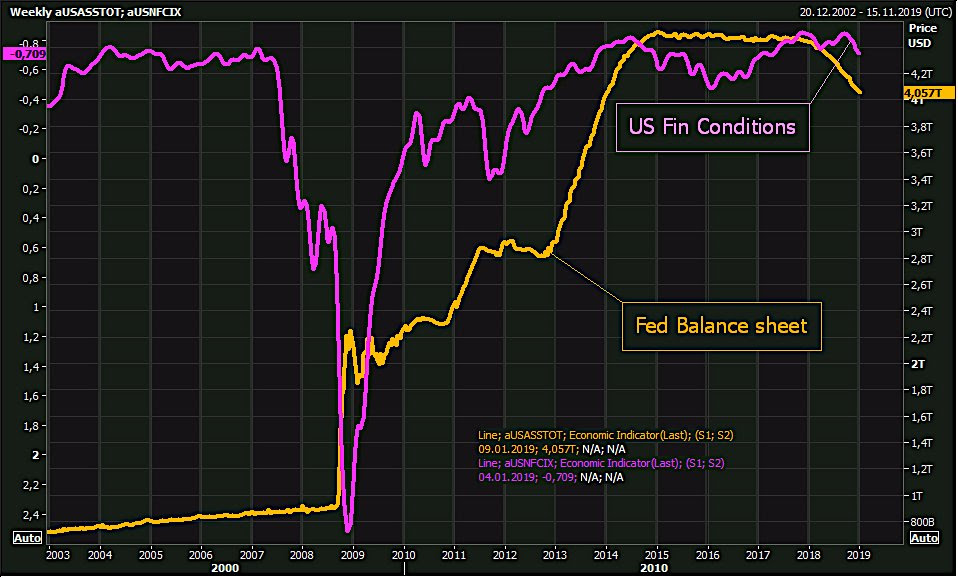
That has to be positive for Bonds, right? But does that address all “residual hawkishness”? No. It does not. Because the Powell Fed is continuing with QT and that is tantamount to raising rates:
- Holger Zschaepitz @Schuldensuehner – If Fed continues quantitative tightening, not only will $200bn in liquidity vaporize every 4mths but de facto tightening will amount to 1 hike a quarter; fin conditions will tighten as if Fed had maintained “gradual” rate tightening pace, Quill Intellígence’ @DiMartinoBooth says.
That makes sense but is there a more quantitative measure of the impact of QT? Yes. Bloomberg reports that Morgan Stanley analysts have built a quantitative model to measure the impact of QT on the stock market.
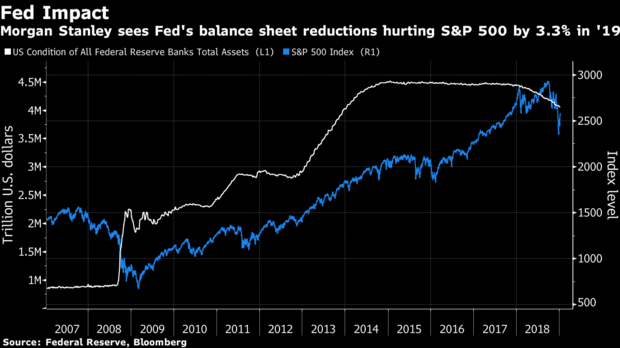
- The S&P 500 has shown a positive relationship to central bank action on mortgage backed securities since 2009, with every $20 billion shift in bond holdings equaling a 0.37 percent change in stock prices, strategists led by Brian Hayes found. Should the Fed continue to its pace of $15 billion in reductions a month in 2019, the gauge would drop 3.3 percent, the model shows. That’s roughly a third of its annualized return in the past five years.
Of course, this only measures the impact of the monthly reduction of $15 billion in mortgages. It does not address the impact of the monthly $35 billion reduction in Treasuries. The Bloomberg article quoted Joe Lavorgna of Natixis on that:
- “Massive Treasury issuance and waning Fed demand for long duration securities raises the possibility of a crowding out of risky assets, … Put another way, investors will need to buy an ever rising share of Treasuries while the largest incremental buyer (the Fed) is stepping away from the fixed income market.”
This is what Gundlach has termed a “suicide policy”. That may be too harsh but there is no doubt this double barrel liquidity squeeze will put an upward pressure on Treasury yields. That is what we saw this week. So, despite the sharp fall in yields on Friday after the negative inflation number, the 30-year yield rose by 6 bps on the week & the 2-3 year Treasury yields rose by 4 bps. This did eliminate the 1yr-7 yr inversion but the 1-5 year curve remained inverted at the end of the week.
But this is only in Treasuries, especially in long maturity Treasuries. Compare the performance of TLT to that of PNF, a leveraged NY Muni Closed End Fund so far in 2019.
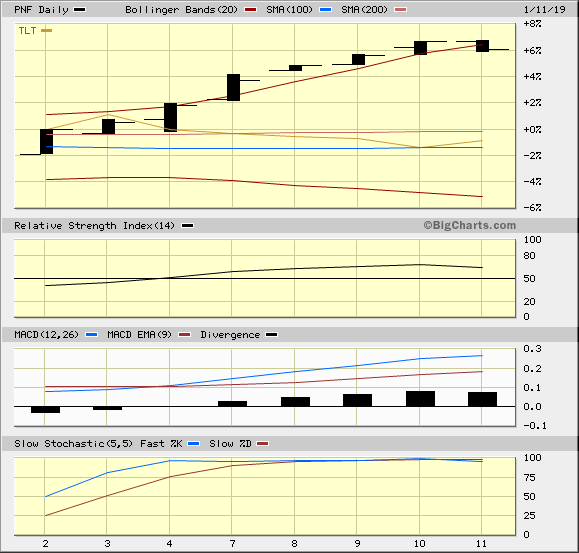
The terrific rally in leveraged Muni Closed End Funds is better seen via a 1-year chart of PNF:
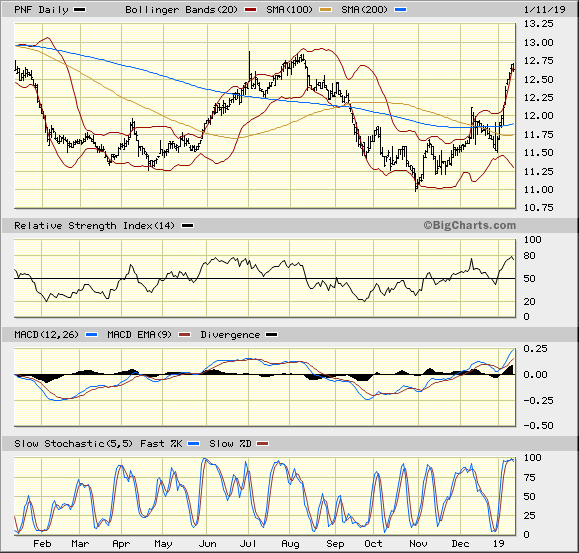 Yes, PNF is up 7.93% so far in January and yields 5.42% (triple tax exempt) after the rally. Nothing new here, folks. Standard operating procedure is to buy leveraged Muni closed end bond funds AS Fed tightening starts getting priced out of the system.
Can we say that about stocks? Yes, subject to one caveat – that Fed has not tightened so much as to cause a recession. That brings us to:
- David Rosenberg @EconguyRosie – Jan 8 – Our cyclical S&P 500 index peak-to-trough drawdown of 22% flashed a two-in-three recession probability. The only times the economy failed to contract in the aftermath was because the Fed eased policy outright.
So the big question is whether the Powell Fed will cut interest rates instead of merely taking a pause while maintaining QT. We all know China is slowing hard. And we saw Germany this week:
- David Rosenberg @EconguyRosie – Jan 10 – Germany in a recession is a pretty big deal. Largest economy in Europe, accounting for one-third of industrial activity, and fourth biggest GDP on the planet. No such thing as global decoupling.
That leaves the big question. Has the Powell Fed retained enough “residual hawkishness” to resist cutting interest rates? If so, will we see the old pattern repeating – a stock rally & increased Treasury issuance forces interest rates back up which in turn weakens the interest rate sensitive sectors of the economy that causes a stock selloff.
But what about arm chair commentators on Fin TV who profess smugly that the Fed should stand firm against markets & focus on the economy.
- Danielle DiMartino @DiMartinoBooth Jan 10 – “The funny dynamic that we have right now—the exposure of household net worth to the stock market has never been this high. It’s a Houston we’ve got a problem situation.” Danielle DiMartino Booth via @YahooiFinance @Qullintel —
And not just households. The exposure of corporations to interest rates is also very high. Guess the arm chair TV talkers don’t understand how leveraged the US economy is. The Powell Fed does understand this even though many on Fin TV don’t.
But understanding this may not be enough. They have a big big obstacle to overcome – the institutional credibility of the Fed. In the interests of maintaining this institutional credibility, the Powell Fed might choose to make haste slowly and follow the data instead of preemptively cutting rates to stop the slowdown.
Don’t we have anything positive to say? We do, in the first part of the next section via indicators with a good track record.
2. US Stocks
First the longer term positive indicators, at least based on past history.
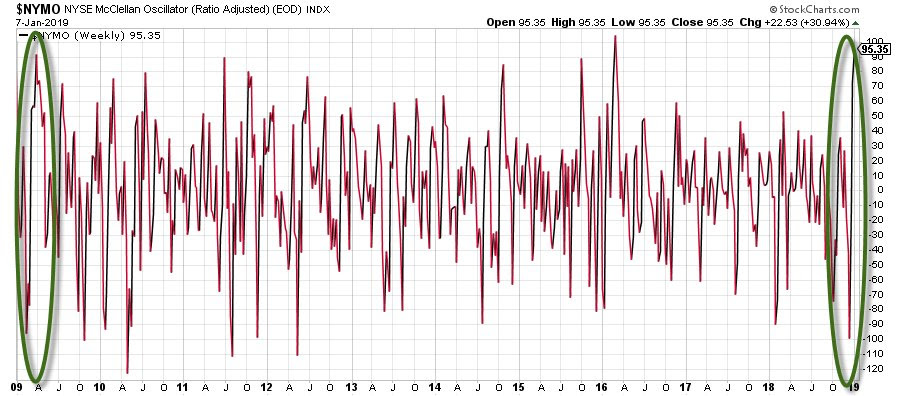
- Ryan Detrick, CMT @RyanDetrick – Jan 8 – The last time the McClellan Oscillator went from -80 (super oversold) to +80 (super overbought) within two weeks? March 2009. It just happened yesterday.
 What a parallel would that be, right? Especially when you add another proven indicator:
- Babak @TN – Jan 8 – a rare Zweig breadth thrust triggered yesterday (first since 2012), historically presages long term gains in US equities via Bloomberg via @sentimentrader
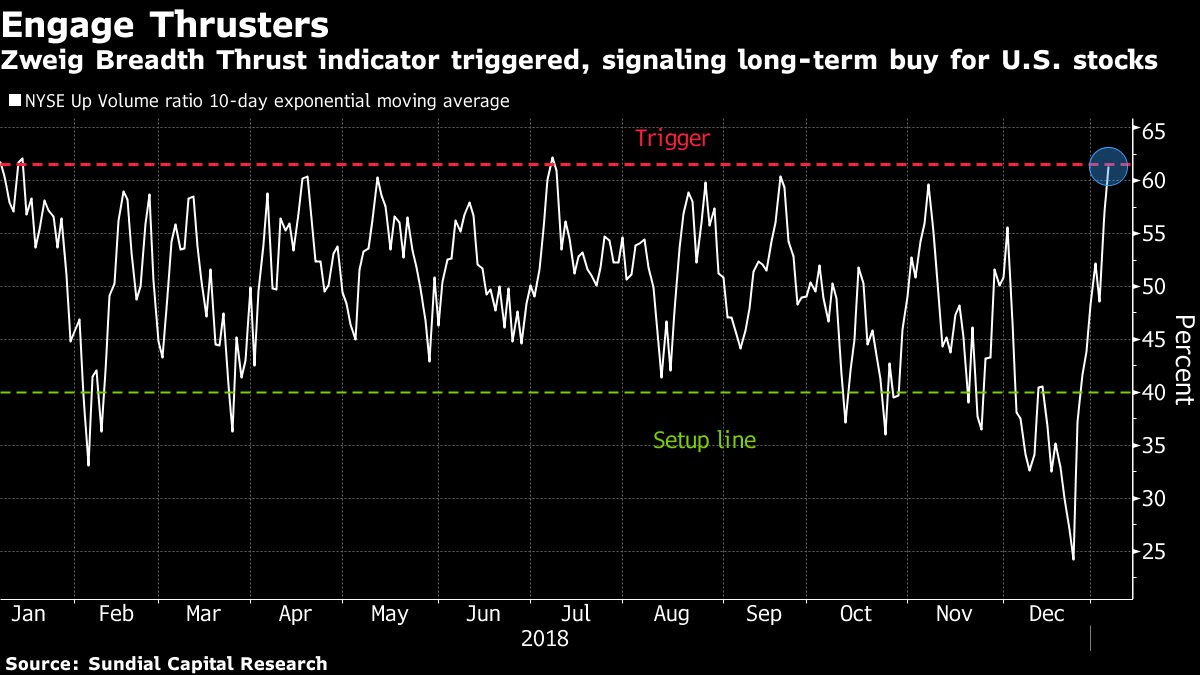
And how rare is this indicator? It has occurred only 11 times in the last 40 years, according to @ukarlewitz .
What else do we have going on the long side, at least for next week? Option Expiration Week. And enough room to get up to a short term peak according to:
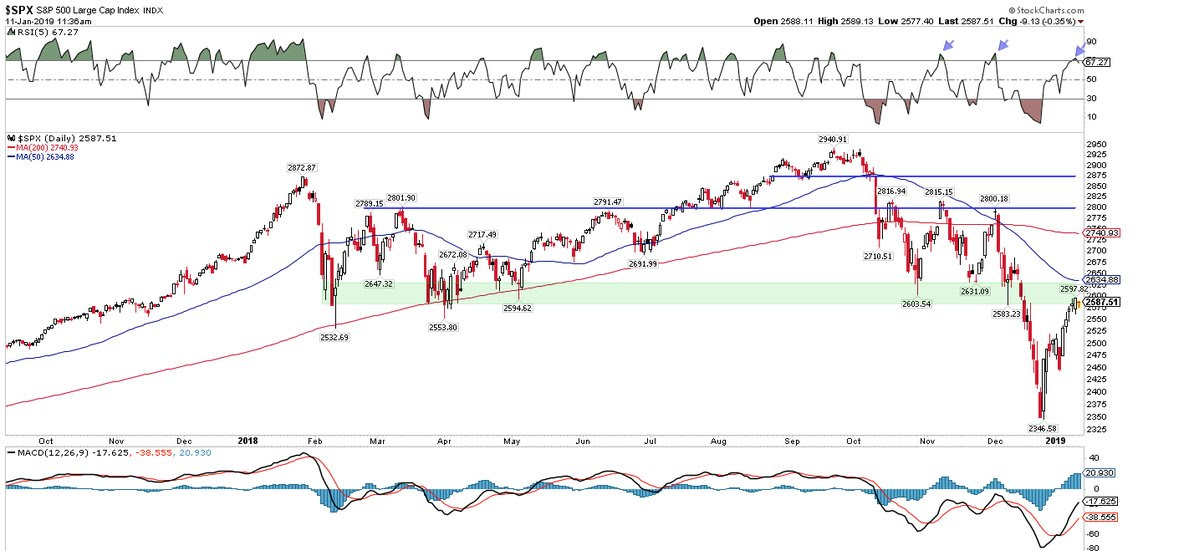
- Mark Newton @MarkNewtonCMT – S&P still premature to peak, & as relayed to clients over last few days, 2640-50 has more importance than 2600- short-term Cycles and Demark exhaustion hit next week, so barring weakness under 2560 on a close, its right to expect a final push $SPX $ES_F #HappyFriday
Others concur:
- Urban Carmel @ukarlewitz – $SPX pausing right where many thought it would. Exiting out of the top of the green zone would be noteworthy.
What did Lawrence McMillan write on Friday?
- “In summary, the short-term rally is still working off the massive oversold condition that existed in late December. It might have more room on the upside, since the put-call ratio buy signals have just taken place. But eventually, there will be problems and the possibility of the resumption of the bear market remains likely as long as the $SPX chart continues to be as bearish as it currently is.”
But is volatility sending a message?
- Jesse Felder @jessefelder – Time to Buy Stock-Market Insurance https://www.wsj.com/articles/
time-to-buy-stock-market- insurance-11547207820 …
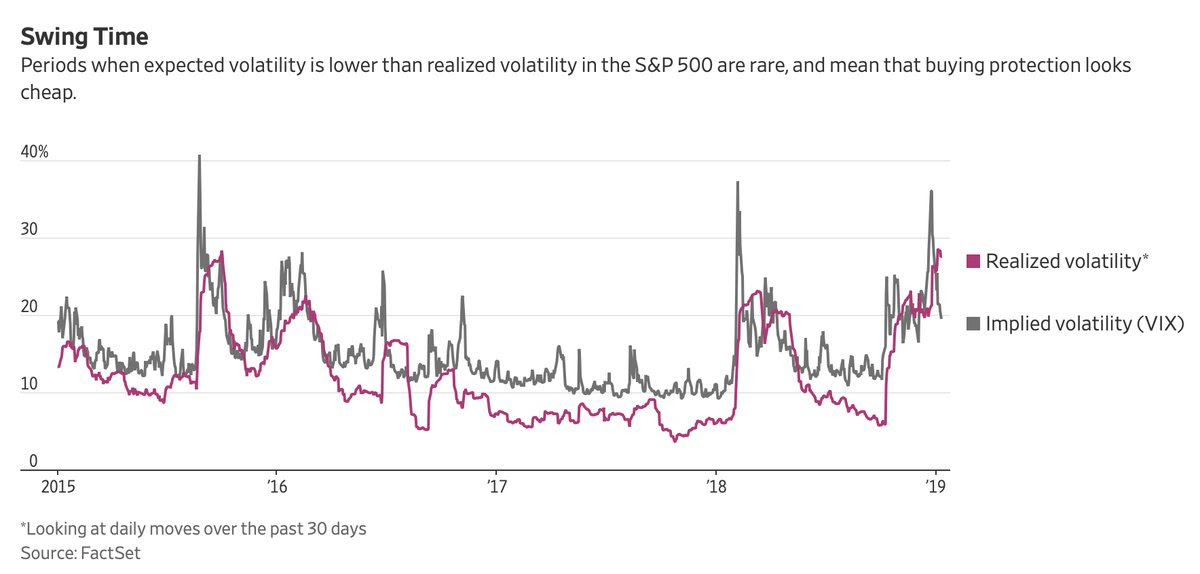
- Bob Lang @aztecs99 – Jan 9 – vix down sharply this week, TRIN at .60, oscillators swelled…hard to keep this going. suspect down coming shortly.
Fundamentally speaking,
- Douglas KassVerified account @DougKass – Jan 9 – …. I anticipate the trading range, as most are aware, will ultimately be broken to the downside in response to a sharp deceleration in the rate of global growth and a meaingful miss to corporate profits.
We won’t have to wait long to find out whether corporate profits exceed or miss already reduced forecasts. How the stock market reacts to profits will tell us more than all of the above stuff.
3. Oil & Gold
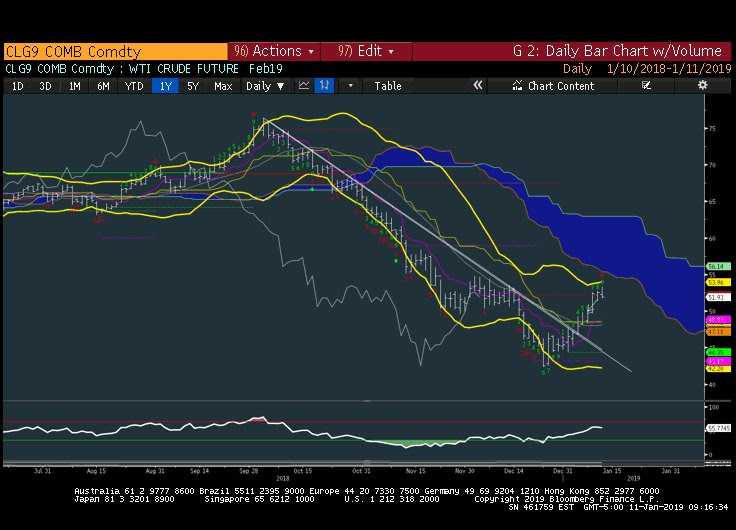
How fast are markets moving right now? Last week, we featured a tweet by Mark Newton that was bullish on oil. Oil rallied by 7% this week and now Mark Newton is changing his tune because of trend exhaustion:
- Mark Newton @MarkNewtonCMT – #CRUDE oil similar to stocks, bullish, but nearing area of Stalling out *& important to watch $TNX $CL_F and $SPX carefully in the upcoming 3-5 days #ENERGY nearing exhaustion after stellar few weeks
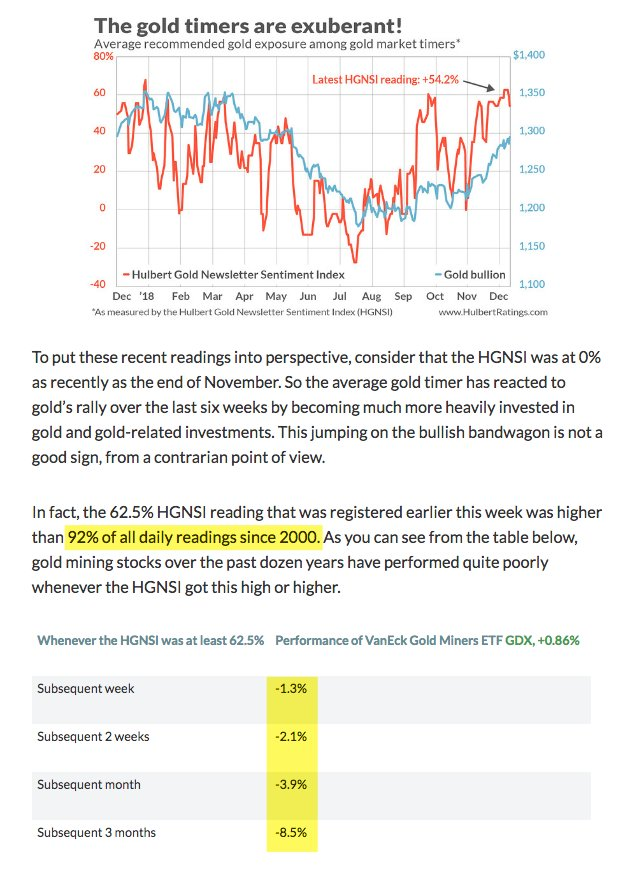
What about Gold, you ask!
- Urban Carmel @ukarlewitz Jan 10 – –$GOLD up 8% in 2 months. Market timers’ bullish sentiment is now in the top 92nd percentile where performance lags $GLD https://www.marketwatch.com/
story/the-bull-trade-in-gold- has-become-uncomfortably- crowded-2019-01-11?mod=mark- hulbert …
Send your feedback to editor@macroviewpoints.com Or @MacroViewpoints on Twitter