Summary – A top-down review of interesting calls and comments made last week in Treasuries, monetary policy, economics, stocks, bonds & commodities. TAC is our acronym for Tweets, Articles, & Clips – our basic inputs for this article.
Editor’s Note: In this series of articles, we include important or interesting Tweets, Articles, Video Clips with our comments. This is an article that expresses our personal opinions about comments made on Television, Tweeter, and in Print. It is NOT intended to provide any investment advice of any type whatsoever. No one should base any investing decisions or conclusions based on anything written in or inferred from this article. Macro Viewpoints & its affiliates expressly disclaim all liability in respect to actions taken based on any or all of the information in this article. Investing is a serious matter and all investment decisions should only be taken after a detailed discussion with your investment advisor and should be subject to your objectives, suitability requirements and risk tolerance.
1.Week that was
The first two days were the worst since 1999 but Friday was a bit up. On the whole, a negative week in most asset classes except Oil.
- VIX up 7.1%; Dow down 59 bps; SPX down 1.5%; RSP (equal-weight S&P) down 1%; NDX down 3.1%; RUT down 3.7%; IWC (micro-cap) down 3.7%; DJT down 2.5%;
Sectors & Stocks:
- BAC up 5.8%; JPM up 1.2%; KRE down 1%; AAPL down 6%; AMZN down 4.2%; GOOGL down 2.9%; MSFT down 2.2%; META down 43 bps; NVDA down 73 bps;
Dollar up with UUP up 1.2% & DXY up 1.1%:
- Gold down 1.1%; Silver down 2.6%; Copper down 2.3%; CLF down 2.9%; FCX down 2.5%; Oil up 3.5%; Brent up 2.2%; Nat Gas 1.5%; OIH down 1.1%; XLE up 1.2%;
International Stocks:
- EWG down 2.2%; EEM down 1.8%; EWZ down 1.1%; EWY down 3.9%; FXI down 3.1%; KWEB down 4%; INDA up 61 bps; INDY up 43 bps; EPI up 1.3%; SMIN up 2.6%;
With all of the above, rates must have gone down, right?
- 30-yr yield up 18.4 bps; 20-yr up 17.5 bps; 10-yr up 18.2 bps; 7-yr up 16.7 bps; 5-yr up 17.2 bps; 3-yr up 16.5 bps; 2-yr up 14.1 bps; 1-yr up 7.1 bps; TLT down 3.6%; EDV down 3.6%; ZROZ down 4.2%; HYG down 1.2%; JNK down 83 bps; EMB down 1%;
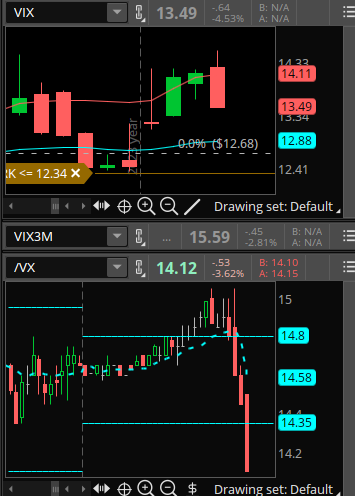
It seemed like a consistent week until Friday hit, with the Non Farm Payroll report and ISI Services report. And after rising the first 3 trading days, VIX fell 5.5% on Friday:
- Jason@3PeaksTrading – Jan 5 9:51am – VIX into new lows flushing harder now and never really got going higher this week, got stopped right at upper bollinger
Other asset classes reacted strongly to the 10:00 am ISM services report:
(TLT) (SPY)
(QQQ) (SMH)
2.Two contradictory Jobs Reports? NFP vs ISM Services?
First the Non Farm Payrolls report came in “strong” at 8:30 am on Friday. BlackRock’s Rick Rieder, who trades $2 trillion plus in bonds & stocks, called it a “solid report but trending lower a little bit” .
In contrast, look what Stephanie Pomboy tweeted a couple of hours later:
But what is the real difference between these two “jobs reports”?
- Liz Ann Sonders@LizAnnSonders – 8:47 am – Fri Jan 5 – December household employment fell by 683k, largest drop since April 2020 … reminder that ‘household survey’ generates unemployment rate, and is different from ‘establishment survey’ which generates headline nonfarm payrolls
In simple terms, the “headline nonfarm payroll” numbers are used by portfolio managers, traders & Hedge Funds. These entities focus on these rosier numbers instead of the “unemployment rate” that mainly matters to unemployed Americans whose voices are hardly heard by those who matter. But wait, where does this big difference in jobs come from?
Every month the Bureau of Labor Statistics ESTIMATES how many jobs would have been created using the number of births & deaths. So a large number of these reported “created jobs” is merely a statistical estimate that can be reduced later as a revision. As Rosenberg points out in the above tweet, 443,000 jobs were wrongly ESTIMATED as CREATED & later revised downwards.
This fiction is known to everybody but ignored until the markets decide to focus on it. And then you see & hear Fin TV talk about economy falling off a cliffette if not a full grown cliff. Last time it was a cliff was in November 2007 when a big bull market in 30-year Treasuries began.
A mini version of this was seen at 10:00 am on Friday morning when the ISM Services number was reported (See TLT chart above).
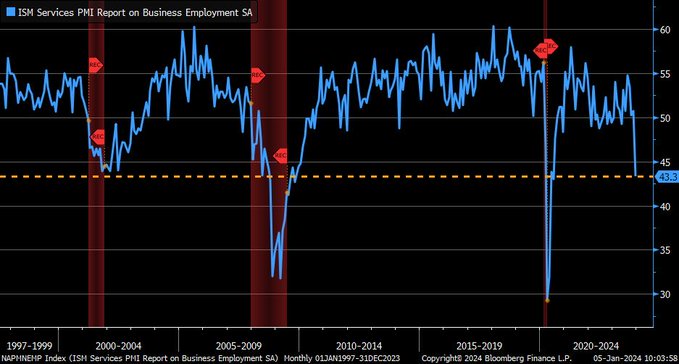
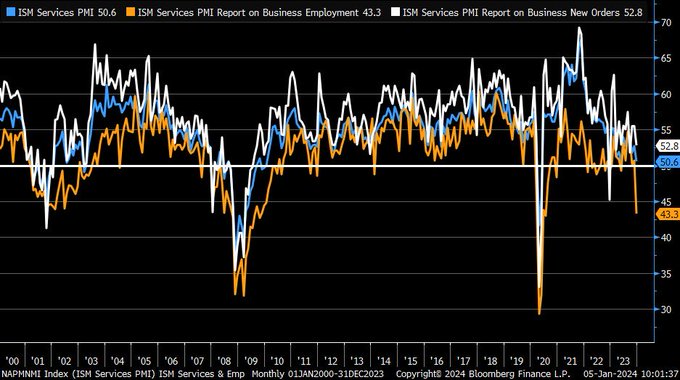
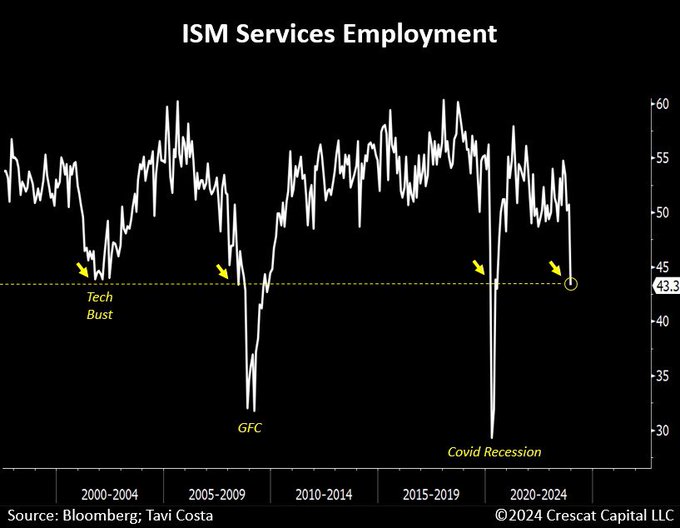
- Bespoke@bespokeinvest – 10:01 am Fri Jan 5– Miss in ISM Services: 50.6 vs 52.5. Employment component shows big drop to 43.3 from 50.7; weakest since mid 2020
For more context,
- Liz Ann Sonders@LizAnnSonders – Fri – For context, here is full history of employment component in ISM Services … current reading of 43.3 was actually never reached in 2001 recession
That’s not all.
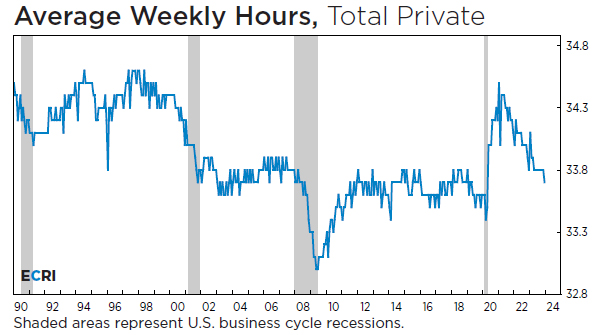
- Economic Cycle Research Institute (ECRI)@businesscycle – Hours worked have dropped to levels last seen in the depths of the Covid crisis. #Jobs #JobsReport
In a clearer message & chart,
- Otavio (Tavi) Costa@TaviCosta 11:23 am – Jan 5 – Very important data was reported today on the ISM Services. The employment index plunged to levels only seen during recessionary periods. Despite the better-than-expected job numbers today, there has never been a time that the unemployment rate crossed its 2-year moving average and a recession didn’t follow. Keep in mind that the more labor markets deteriorate, the more favorable it is for hard assets.
But isn’t this good for stocks?
- Jason@3PeaksTrading – 10:06 am Jan 5 – 2 vs 10 yr Yield curve just flipped big to the upside (bullish stocks)
Frankly, this is nothing compared to what the Fed is seeing.
How might the Fed react if & when they do more than merely see (this is an election year, isn’t it?)? And here is more to see, unfortunately!
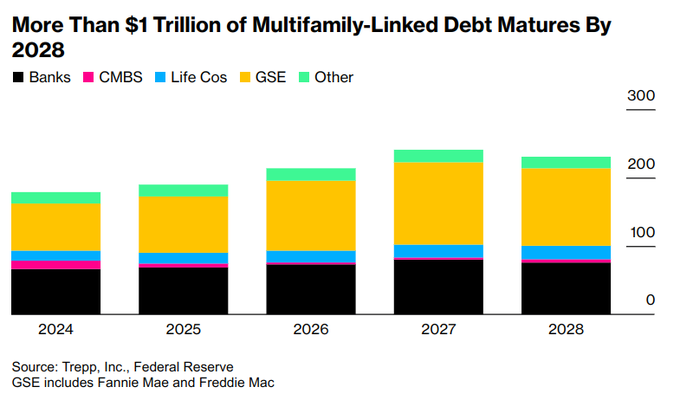
- Markets & Mayhem@Mayhem4Markets – Jan 6– Short Sellers See Distress Emerging in Apartments as Borrowing Costs Surge – Bloomberg
And,
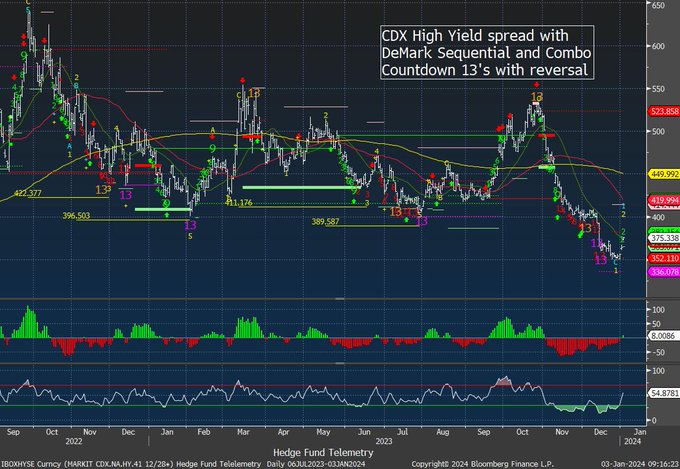
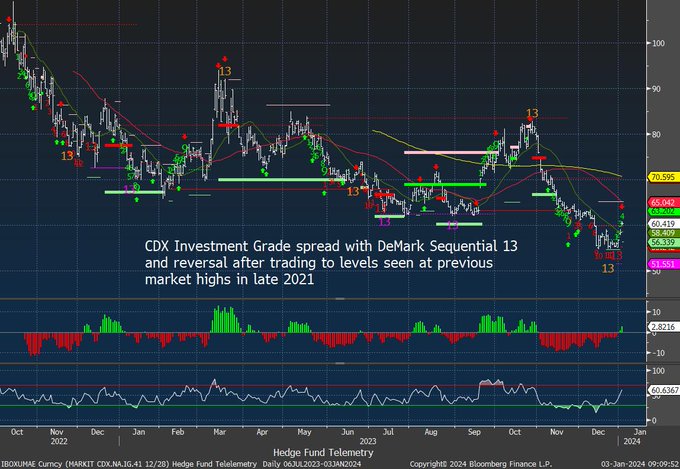
- Thomas Thornton@TommyThornton – A few risk-off indicators I watch CDX Credit Spreads starting to reverse
Surely current holders of Treasuries must be adding, right?
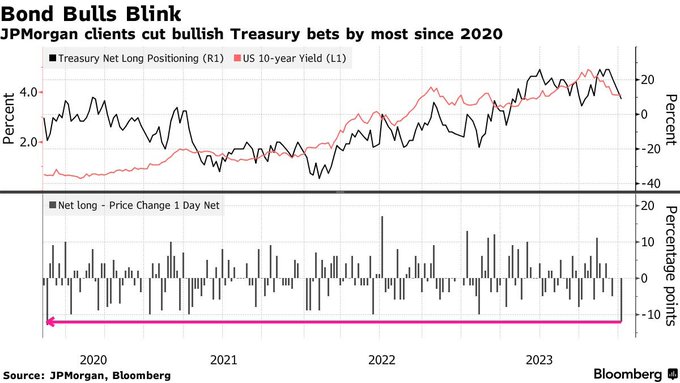
- Daily Chartbook@dailychartbook – “JPMorgan’s latest Treasury client survey showed the biggest net drop in long positions since May 2020.” @EddBolingbroke
Perhaps, these clients have not spoken with Erin Browne of Pimco! Watch & listen to her explain why in Pimco’s 2024 outlook, “bonds emerge as a standout asset class, offering strong prospects, resilience, diversification, and attractive valuations compared with equities“. She adds, “at close to 4%, bonds still offer value to long term fixed income & global assets owners … return that is attractive for long term owners with very low risk relative to equity risk ; “
Will any of the above alter the current consensus?

And what is the associated consensus in the stock market? Broadening of market & money coming out of Big Tech. That seems to be symbolized by what they did to Apple this week! That led BofA’s Savita Subramaniam to write:
- “A rout in big tech plus a broadening of market leadership is becoming consensus. January pain trade = higher TMT/Mega-caps“
Especially if Treasury yields go down or even slow down their current rise. Speaking of Apple, we would like to mention a Tweet that focused on Apple, its fall this week & its RSI. It is a long tweet & a highly detailed one with 3 attachments. Click on the Show more link below to view the entire tweet.
- Trader Z@1TraderZ – – $AAPL RSI Close below 30 Daily timeframe analysis $AAPL doesn’t often close below 30 RSI on a daily TF. In fact only 12 instances over the past 5 years. The 13th time was this past Thursday and Friday! (multiple days of a sub 30 RSI were grouped!) I manually took 5 years… Show more
3. Negative enough to begin thinking positive on Equities?
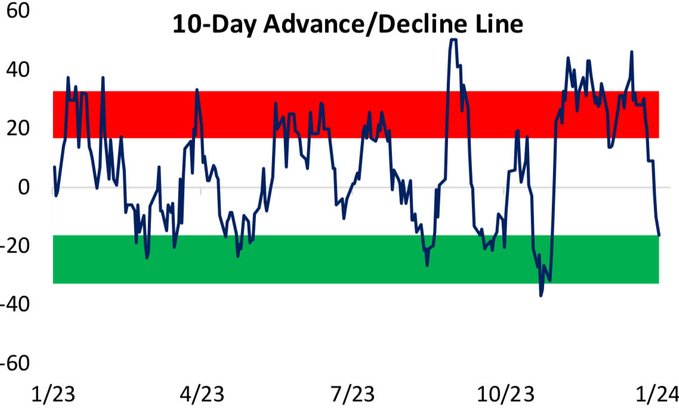
- Bespoke@bespokeinvest – This is the S&P 500 Tech sector’s 10-day advance/decline line that has swiftly moved down to oversold territory this week
What about actual exposure? Could it be bad enough to be good, a la October 25, 23?
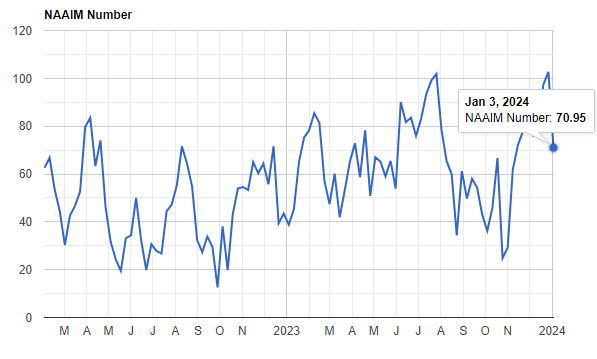
- Blake B. Millard, CFA@BlakeMillardCFA – Jan 5 Friday 12:50 pm – The NAAIM Exposure Index plunged from a +2-year high of 102.7 to 70.9 over the past week. The 31-pt drop is the largest since October 25, the same week as the SPX low. It’s been a rocky week for stocks, and w/o a significant rally today, this will be the 1st down week for the $SPX in the last 10. h/t @dailychartbook
Close to bad enough to think about feeling good about the Russell 2000, the worst performer of the broad indices this past week?
- Helene Meisler@hmeisler – Sat Jan 6– RUT red 6 straight. Hasn’t gone 7 since early September 2022. Went 8 in December 2018, also in September 2015
What about broad put-call & call-put ratios?
- Helene Meisler@hmeisler – Jan 6 – ETF put/call ratio 1.78, highest since 10/25
- Helene Meisler@hmeisler – Jan 6 – ISEE Equity call/put ratio 1.54, lowest since 11/14.
What is one simple answer to those who ask?
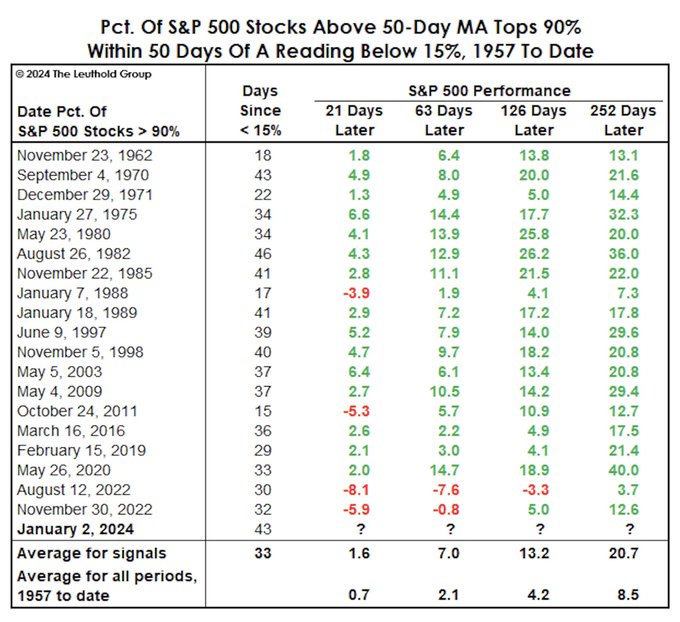
- Seth Golden@SethCL – Jan 6 – Sat – It’s not just that 90% of stocks were trading above their 50-DMA, it’s that it went from LESS than 15% to 90% within 50 days; $SPX 94% probability higher 6 months later and 100% probability higher 12 months later. Between now and then, you simply buy the dip! $SPY $QQQ $DIA
Is there something that has an unblemished record of 6-12 month gains? At least “nearly unblemished“?
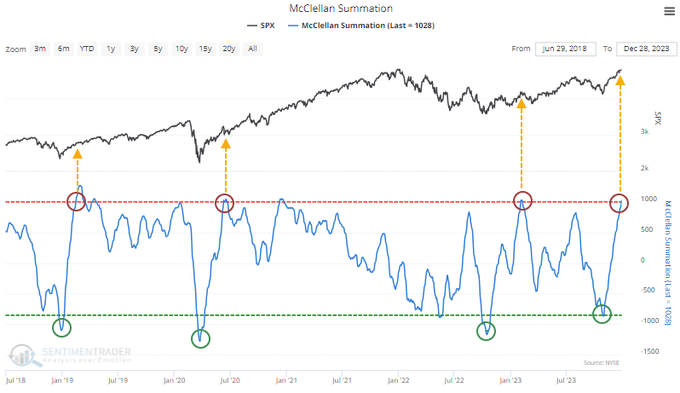
- SentimenTrader@sentimentrader – Jan 3 – Internal momentum has reached escape velocity. The McClellan Summation Indexes for indexes, sectors, and even entire exchanges have reached levels that have never been triggered during ongoing bear markets or before major corrections up to a year later. Over 60+ years of history, they have a nearly unblemished record of 6-12 month gains for stocks.
So sorry but this is playoffs season. Is there someone who can say what happens in the next 1-2 weeks, someone who has been right in the near past?
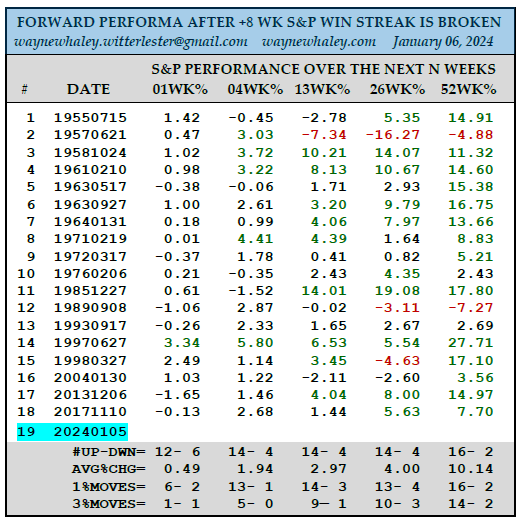
- Wayne Whaley@WayneWhaley1136 – Jan 7 – THE S&P BROKE A 9 WEEK WIN STREAK LAST WEEK. Normally any pullback in a strong advance will scan out as a buy signal. I posted 8 week advances instead of 9, so as to have +10 data points. The Toy aficionados will argue that the first week of the year is not just any week.
Going back to Friday after ISM Services:
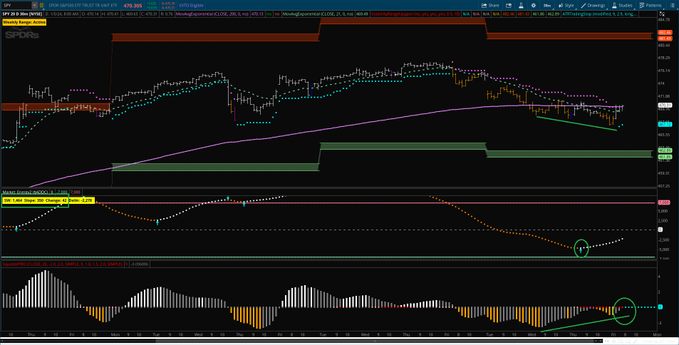
- Trader Z@angrybear168 – 11:17 am Friday Jan 5 – $SPY potential trend day in the making, 30 min bull div + squeeze, summation cycle turned up and strong intraday momentum numbers.
Now we highlight a smart discussion with the worst habit of CNBC webmasters by writing what we heard from Jeff DeGraff which was important but edited out by CNBC in the clip they posted on YouTube:
- “… path we are on seems most similar to 1999 .. the minute Fed cut rates in 1995, tech peaked at that point for 1.5-2 years … so Magnificent 7 may become liabilities once the Fed cuts … as long as Real rates are below 200, enough ammunition ; if they get above 225, then get concerned …”
4. Too positive on S&P to become negative?
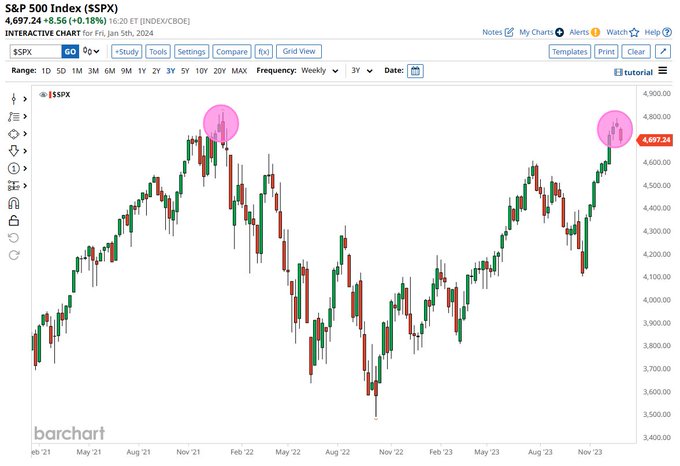
We got to begin with the words “Double Top”, right?
- Barchart@Barchart – Jan 5 – S&P 500 $SPX Potential Double Top on the Weekly 🤔
What about seasonality? Read what Tom McClellan writes in his article Seasonality Shows A January Dip:
- “This version of the DJIA’s Annual Seasonal Pattern (ASP) shows a meaningful January dip, lasting until about January 24. This is different from how the market used to behave. .. “
5. Jinxing is real, it seems!
Two weeks ago, we wrote positively about Baker Mayfield & Jared Goff. They didn’t do well the following week. Last week, we refused to mention them positively. Now both Tampa Bay & Detroit Lions are in the playoffs. So it is what we have suspected for awhile – Jinxing is real.
Send your feedback to editor.macroviewpoints@gmail.com Or @MacroViewpoints on Twitter