Summary – A top-down review of interesting calls and comments made last week in Treasuries, monetary policy, economics, stocks, bonds & commodities. TAC is our acronym for Tweets, Articles, & Clips – our basic inputs for this article.
Editor’s Note: In this series of articles, we include important or interesting Tweets, Articles, Video Clips with our comments. This is an article that expresses our personal opinions about comments made on Television, Tweeter, and in Print. It is NOT intended to provide any investment advice of any type whatsoever. No one should base any investing decisions or conclusions based on anything written in or inferred from this article. Macro Viewpoints & its affiliates expressly disclaim all liability in respect to actions taken based on any or all of the information in this article. Investing is a serious matter and all investment decisions should only be taken after a detailed discussion with your investment advisor and should be subject to your objectives, suitability requirements and risk tolerance.
1.Just “deceleration” or Is June coming in May this year?
That was the word we heard from two big guns on Friday. First was Rick Rieder of BlackRock who said on Bloomberg Surveillance on Friday that “it is starting to decelerate“, “it” presumably meaning new jobs being added. Second was Jan Hatzius of Goldman who said “looks like a controlled deceleration” about inflation, we think.
The reaction below to the Jobs Report followed weaker ISM numbers on Thursday and, above all, a dovish Powell on Wednesday’ FOMC & Presser. And we got
- Ryan Detrick, CMT@RyanDetrick – 2-year yield down 25 basis points the past three days. That is a huge move. As we’ve been saying for over a month now, the swing from 7 cuts to potentially none was too extreme. The opportunity was better inflation data and lower yields. We are seeing it.
And on Friday,
- Oliver Renick@OJRenick – May 3 – Boom — there it is. Citi Economic Surprise Index flips negative, lowest in 15 months, biggest weekly decline since April ’23.
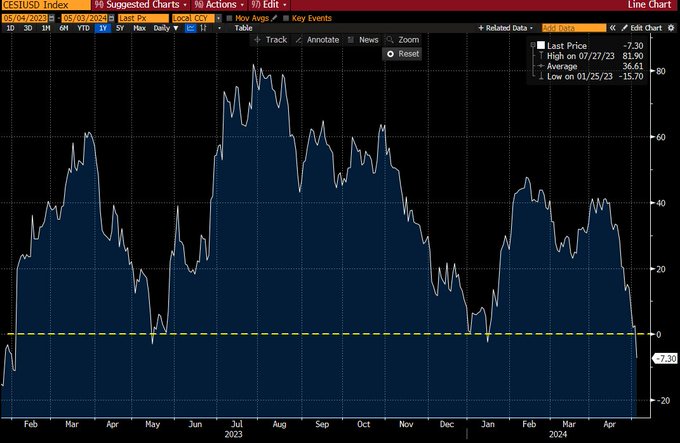
No wonder the arrows in the Treasury market reversed direction this week:
- 30-yr yield down 12 bps on the week; 20-yr down 14 bps; 10-yr down 16.7 bps; 7-yr down 19.9 bps; 5-yr down 20.6 bps; 3-yr down 20 bps; 2-yr down 18.8 bps on the week; 1-yr down 8.3 bps;
Last week we showed the 2024 YTD chart of TNX (10-yr yield) and compared it with the Jan-April charts of TNX in both 2000 & 2008. As we wrote last week 2024 YTD chart of TNX “chart looks angrier & worse in 2024” than in 2000 & 2008. If you look at those charts, you will easily notice that TNX last week was much higher in distance from its 50-10-150 day mvs than its corresponding charts in 2000 & 2004.
That leads to wonder whether the 10-yr yield (TNX) will begin its fall in May this year , a month earlier than it did in June in 2000 & 2008? We will find out together:
Something just as important raised concerns of a major change in direction:
- Chris Kimble@KimbleCharting – U.S. Dollar Could Be Peaking, As RSI Near Record Levels, Says Joe Friday. Breakdown at (1)= Negative for King$ https://bit.ly/4acOuIU $DXY $SPY $GLD
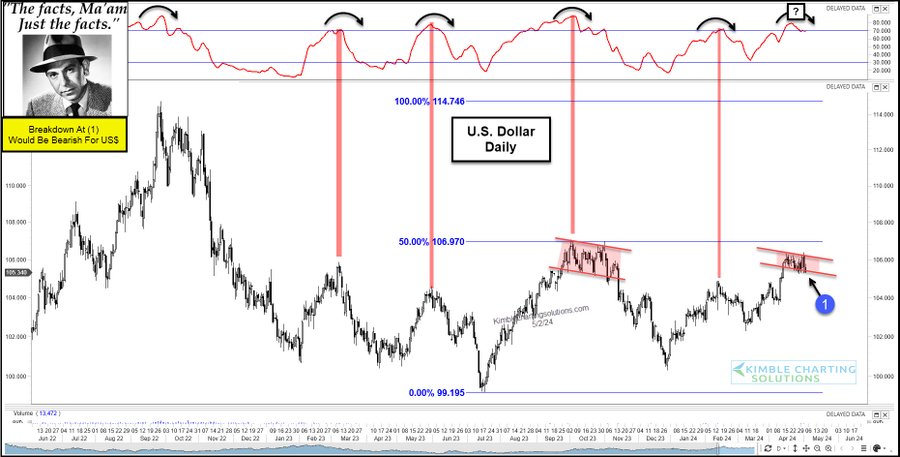
And, to his credit, Jay Pelosky said on Monday, April 29 on Bloomberg Surveillance that the U.S. Dollar is ripe for a sell-off with the longest speculative long position in 5 years. And the U.S. Dollar (DXY) did fall about 90 bps this past week.
What would you expect when US Dollars falls & US Treasury rates move down across the Treasury curve?
- ACWX up 1.7%; EEM up 2.9%; EWZ up 2.5%; EWY up 3%; EWG up 1.4%; INDY up 2.7%; INDA up 73 bps; EPI up 82 bps;
Sure Emerging Markets across the globe beat the paltry 55 bps gain in the S&P 500. But one market stood out tall – FXI up 6%; KWEB up 6.6%; ASHR up 4.2%; CAF up 3.2%;
Perhaps this prompted the call “most important thing .. from a global perspective is a turn in China” from Jeff DeGraff of RenMac:
“China Taking A Positive Turn”– Jeff deGraafhttps://t.co/g0wHe224Gg pic.twitter.com/cPeV2uW5bo
— RenMac: Renaissance Macro Research (@RenMacLLC) May 5, 2024
More direct & impressive was the statement on Monday April 29 from Jay Pelosky on Bloomberg Surveillance:
- “China has the best risk reward of any of the markets out there & none of the upside is priced in; KWEB is a perfect example; their market in China is 2X size of USA & is growing at 15% p.a.; stocks in KWEB are at 40% discount to US equivalents – KWEB could double again and then double again to $100; 2021 high of KWEB was $102…. “;
2. US Stocks
- VIX down 10.4%; Dow up 1.1%; SPX up 55 bps; RSP up 6 bps; COMPX up 1.4%; NDX up 98 bps; SMH up 6.6%; RUT up 1.7%; IWC up 3.6%; DJT up 1.2%; XLU up 3.7%;
- AAPL up 8.5%: AMZN up 3.5%; GOOGL down 2.7%; META up 2.1%; MSFT up 23 bps; NFLX up 3.6%; NVDA up 1%; TSM up 2.6%; BAC down 1.6%; C down 1.6%; GS up 2.7%; KRE up 3.1%; SCHW up 1.4%;
The last two weeks have been up & decisively so. Any targets yet?
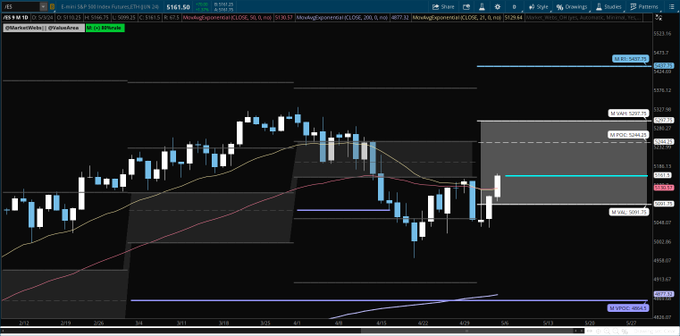
- Trader Z@angrybear168 – May 5 – $ES_F 80% rule in play within monthly value, target would be 5300.
And,
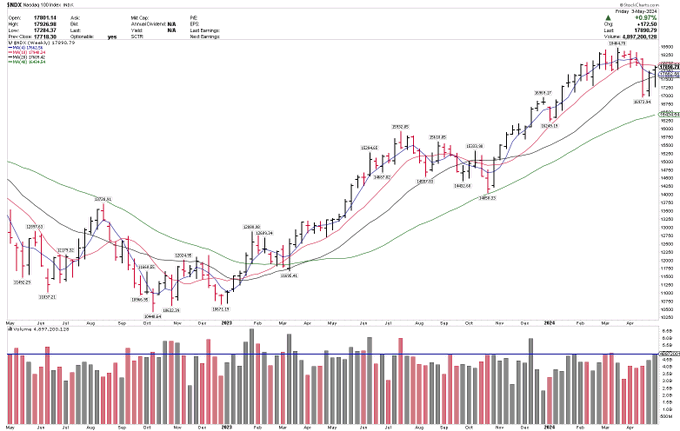
- Larry Tentarelli, Blue Chip Daily@bluechipdaily – May 5 – $NDX highest upside volume week of 2024 and second highest since the October low.
And,
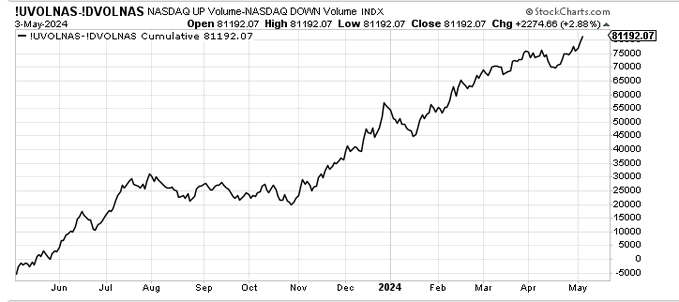
- Helene Meisler@hmeisler – May 5 – Naz cumulative volume (like breadth but with volume) has made a higher high
And well deserved, right?
- Bespoke@bespokeinvest – The five $1+ trillion market cap companies that have reported Q1 earnings so far posted sales of more than $412 billion combined during the quarter. All five beat both EPS and sales estimates. $AAPL $AMZN $GOOGL $META $MSFT

But what about the part of the Nasdaq that has a misnomer of a name beginning with “Semi“?
- Rani Molla@ranimolla – May 2 – Tech companies are making record capital investments thanks to AI https://sherwood.news/tech/ai-spending-amazon-alphabet-microsoft-meta/
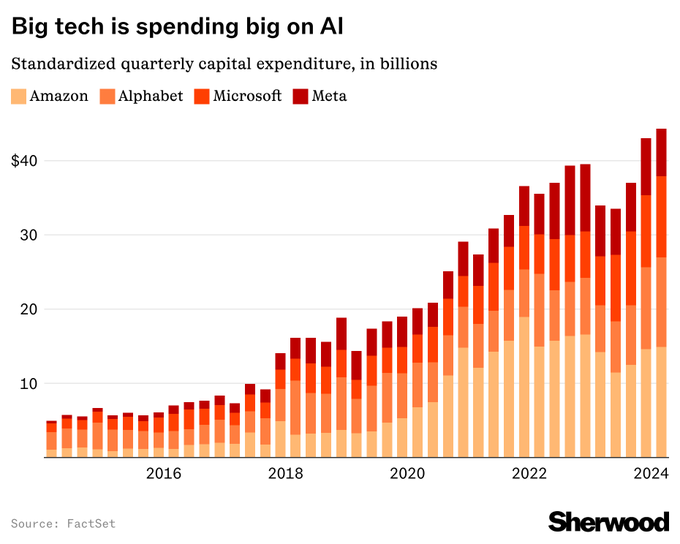
No wonder SMH was up 6.6% last week while NDX was only up 98 bps. Jay Pelosky characterized the 2023-2027 period as a blue sky macro period that will feature an investment buildout.
That brings us, second week in a row, to a historically unlikely winner from tech spending – XLU, the Utilites ETF:
- Bespoke@bespokeinvest – What’s gotten into the Utes? Utilities is the one sector whose cumulative A/D line has broken out to new highs. And it’s soaring:

And,
- Helene Meisler@hmeisler – Utes green 11 of the last 13 days
Generac knows why:
- Bespoke@bespokeinvest – From this week’s Generac call: – “the amount of power that will be drawn from those data centers will triple from the current levels that we’re at today. It’s almost the equivalent of adding 40 million households to the grid.” $GNRC
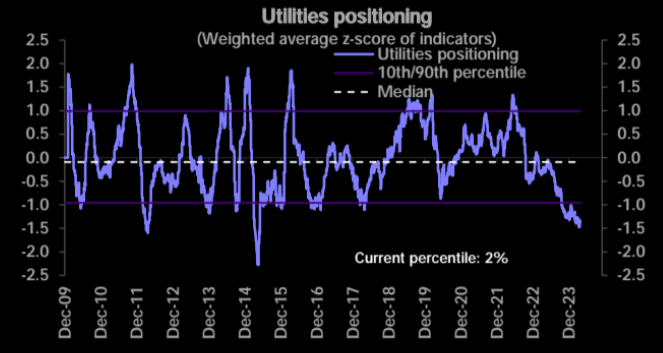
And the positioning:
- Markets & Mayhem@Mayhem4Markets – Positioning in utilities remains VERY low, despite a growing business case to consider a long as power demands in the US are set to double over the next decade. This is one reason we’ve been bullish of $XLU as a part of our investment strategy for 2024 at MacroVisor. 🫡
The thrust signal discussed last week did not come thru by last Tuesday. But another one did:
- SentimenTrader@sentimentrader – A component in the TCTM Washout Model triggered a new alert after the S&P 500 closed below its lower Bollinger Band for five consecutive sessions and subsequently reversed higher.

Finally a conservative view:
4. Economy, Treasuries
Below is a good summary of “deceleration“:
- Markets & Mayhem@Mayhem4Markets – Much weaker than expected non-farm payrolls data – US Nonfarm Payrolls Actual 175k (Forecast 240k, Previous 303k); US Private Payrolls Actual 167k (Forecast 195k, Previous 232k); US Unemployment Rate Actual 3.9% (Forecast 3.8%, Previous 3.8%); US Average Earnings YoY Actual 3.9% (Forecast 4%, Previous 4.1%); US Average Earnings MoM Actual 0.2% (Forecast 0.3%, Previous 0.3%); US Labor Force Participation Actual 62.7% (Forecast 62.7%, Previous 62.7%); US Manufacturing Payrolls Actual 8k (Forecast 5k, Previous 0k)
Addressing Powell’s comment about neither seeing “stag” nor “flation“,
- Otavio (Tavi) Costa@TaviCosta – I suggest J. Powell to consider this indicator for the “stag”, and the recent surge in commodities or gold for the “flation”. Every time unemployment rates have crossed above its 24-month moving average, it marked the beginning of a significant deterioration in labor markets.

What is happening with average, sorry median house prices?
- Game of Trades@GameofTrades_ – ATTENTION: Median home prices are now contracting at levels unseen since 1964

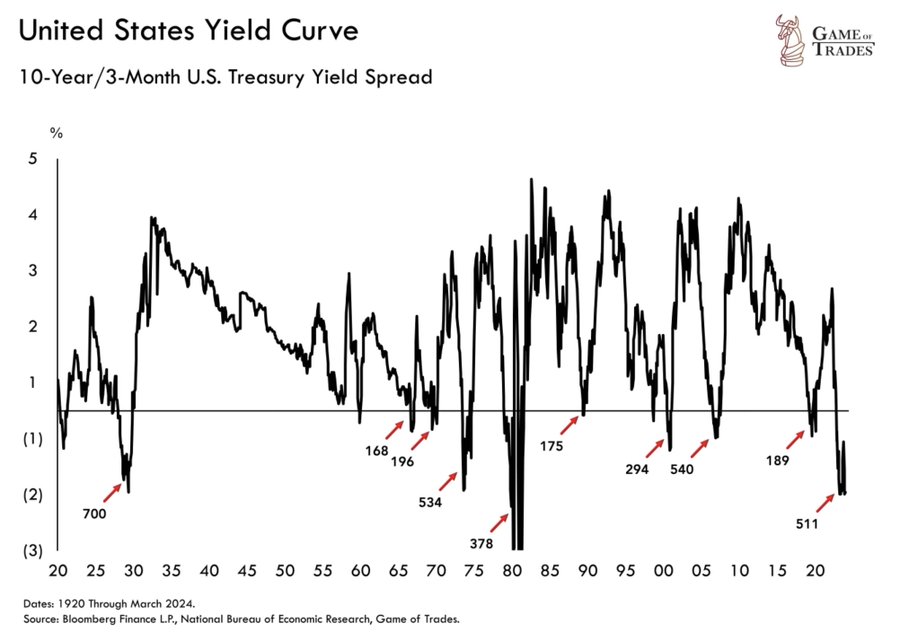
The above can’t be bullish for yield curve concerns, right? Speaking of yield curve inversions:
- Game of Trades@GameofTrades_ The yield curve has been inverted for +500 days. This has only happened 3 times since 1920: 1. 2008 2. 1929 3. 1974. … All 3 saw more than 50% market declines. We expect a final rally to occur before recessionary concerns finally kick in later in 2024
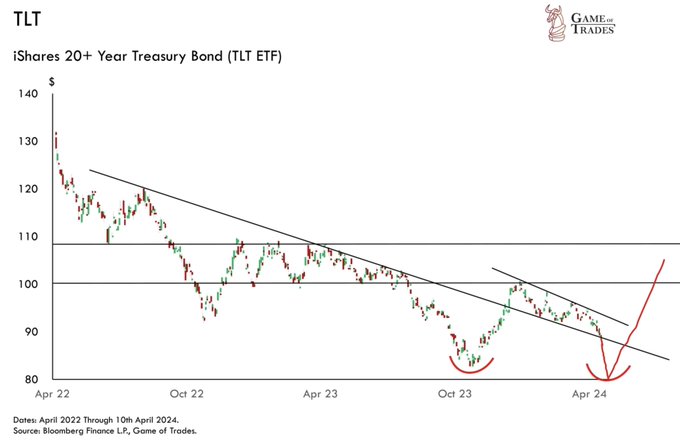
With all this negativity, is this the time to buy TLT?
- Game of Trades@GameofTrades_ – May 3 – 18-We’re preparing for the possibility of a double bottom in TLT before a significant rally. Targeting a potential 30% upside as we navigate this longer-term downtrend. Get our regular market updates and new trade alerts at: https://bit.ly/GameofTrades
5. Commodities
Semis are doing great but the second part of the Jay Pelosky thesis, the one based on commodities, fared poorly last week. And that too with the Dollar down & interest rates down.
- Gold down 1.8%; GDX down 3.4%; Silver down 1.8%; SLV down 2.4%; Copper down 24 bps; CLF down 1.3%; FCX up 52 bps; Oil down 6.8%; Brent down 7.2%; OIH down 3.5%; XLE down 3.4%;
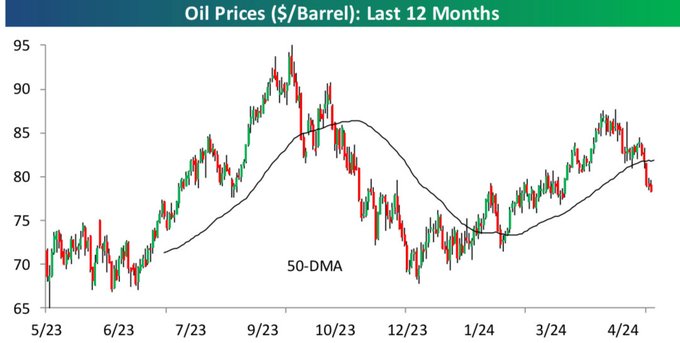
Oil was the worst hit:
- Bespoke@bespokeinvest – Oil prices broke hard below the 50-DMA to end last week, causing a breakdown of the uptrend channel that had been in place all year as well.
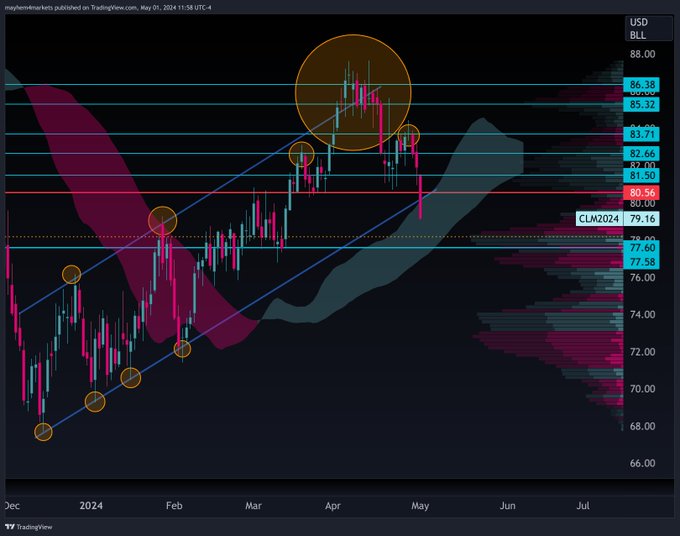
What’s a target level?
- Markets & Mayhem@Mayhem4Markets – At this rate $CL_F may be headed to around $77.60 before it finds support. Let’s see how it plays out. Looking a bit like a head and shoulders breakdown after that enormous unexpected inventory build.
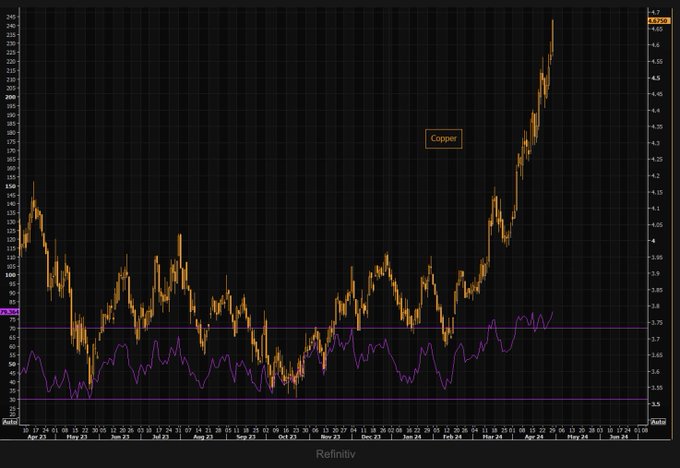
But what about Copper, one of the two legs (with Semis) of Pelosky’s investment thesis?
- Imran Lakha | Options Insight@options_insight – Copper move got a parabolic. Implied vol and call skew went ballistic and looked very extreme. We flagged hedging opportunity to subs this morning in our Macro Options Daily note.
Is it simply a case of Commodities selling off from their recent up moves in tandem with Semis rallying from their recent down move? Or is a hark back to a 2008 level liquidation of sorts to go along with Treasury rates melting down? Action in commodities is the most negative note sounded by the markets this past week. Hopefully, it is merely transient!
Having quoted Jay Pelosky a few times above, we recommend watching & listening to him in the clip below (from minute 52:27)
Send your feedback to editor.macroviewpoints@gmail.com Or @MacroViewpoints on Twitter