Summary – A top-down review of interesting calls and comments made last week in Treasuries, monetary policy, economics, stocks, bonds & commodities. TAC is our acronym for Tweets, Articles, & Clips – our basic inputs for this article.
Editor’s Note: In this series of articles, we include important or interesting Tweets, Articles, Video Clips with our comments. This is an article that expresses our personal opinions about comments made on Television, Tweeter, and in Print. It is NOT intended to provide any investment advice of any type whatsoever. No one should base any investing decisions or conclusions based on anything written in or inferred from this article. Macro Viewpoints & its affiliates expressly disclaim all liability in respect to actions taken based on any or all of the information in this article. Investing is a serious matter and all investment decisions should only be taken after a detailed discussion with your investment advisor and should be subject to your objectives, suitability requirements and risk tolerance.
1. Friday or Thursday & Friday?
Friday turned out to be a confusing day with post-NFP moves being reversed and some re-reversed. Two of the really confusing ones were the Dollar and Interest Rates. Just look at the intra-day action.
The chart on the left is the Dollar Index DXY and the one on the right is the 5-year Treasury yield. The Dollar dropped hard after the NFP number came in at 151,000, quite weaker than the 180,000 expectation. Then DXY reversed hard and closed near its high of the day. The 5-year yield also dropped very quickly & reversed & touched the high of the day just after 10:00 am and then dropped back to close between the low & high yield. What is going on? Why was the Dollar reversal maintained while the 5-year reversal re-reversed somewhat?
We think a better picture emerges with a 2-day look. When you look at the 2-day charts below, remember the stunningly weak 47-handle PMI was released on Thursday at 10:00 am.
DXY fell hard after the PMI on Thursday at 10 am and then fell harder on Friday after the NFP number. Was the total drop from Thursday PMI to Friday post-NFP just too much? Is that why DXY reversed but still closed on Friday below the pre-PMI level of Thursday?
TLT on the other hand rallied hard after Thursday’s PMI, rallied more post-NFP and then reversed. It gained back some of Friday morning’s reversal on Friday afternoon but closed just around the pre-PMI level. Indecisive.
SPY fell hard after the PMI release on Thursday; got back almost of the post-PMI loss by Thursday’s close. Then SPY opened higher on Friday to reverse some of the rally and then closed up but not at the morning highs.
The cleanest & most decisive chart is of GLD on the top right. We see that GLD spiked on the PMI number on Thursday; kept almost of that rally on Thursday afternoon; opened higher on Friday post-NFP. Then it reversed some of that rally but then got it all back to close at highs of Friday.
We have no idea what all of the above means but we can take a guess. Thursday’s 47-handle PMI number was deemed contracting. That also meant forget September rate hike. So Dollar fell, Gold spiked, yields fell hard & stocks fell. Makes sense.
Then came Friday’s 151,000 NFP number, a number CNBC’s Steve Liesman called “on the cusp” for Fed-tightening. In any case, this 151,000 number suggests muddling economy but not a contracting one. And a muddling economy with decent 100K+ job growth might allow the Fed on the rate hike path in later months if not in September. Under this scenario, it is reasonable to let S&P bounce back; for the Dollar to keep its balance and for interest rates to not go down hard.
So why did Gold act different? Because a) it was oversold and b) a not so certain rate hike provides an excuse for a rally from the severely. Or because the 30-2 & 30-5 yield curves bear-steepened 4 & 3 bps on Friday? And because leveraged UTG & DPG outperformed HYG on Friday by 1% & 50 bps resp. That is consistent with the 2-year yield closing flat on Friday. Meaning this is not about Fed raising rates in September but about a nuevo goldilocks like environment with decent non-inflationary job growth & a negligent Fed. That would be consistent with Gundlach’s repeated statements that the 30-year T-bond wants the Fed to tighten. Conversely an easing of Fed determination should lead to a steepening of the curve.
But enough of our meanderings and onward to real gurus.
2. September Rate Hike probability
The best arguments about the Fed’s future actions and why they wouldn’t tighten in September were made on Monday, August 29 by Andy Brenner of National Alliance Securities in his discussion with Rick Santelli.
- “Fisher’s statement was very cavalier; I think what he was trying to say is that the Fed is going to leave every meeting on the table & he didn’t really mean to say that he expected two interest rate raises this year; we don’t really see the Fed going in September; global economy just doesn’t look good; we think the Fed is more data-independent and fearful of global markets than data-dependent; I just don’t see them moving in September”
Then on Wednesday, August 31, Matthew Hornback, Head of Interest Rate Strategy at Morgan Stanley, said buy 5-year Treasury notes on BTV:
- “Last time Treasury yields were sitting at this level, the yields in Japan were 100 bps higher; we are in low-yield environment; we see investors abroad reaching for yield almost everywhere we look & we think 5-year USTs sitting right here at 1.2%; we think there is plenty of room for these yields to fall as move forward into the end of the year“
On the other hand, Bill Gross bet on a September rate hike in his conversation with Tom Keene of Bloomberg Radio after the NFP release:
- “September is on; not a 100% but close to 100%; She looks at jobs, jobs, jobs; GDP is not at the top of her list; Why? Fedspeak. September is one and done for the year”
What did the Treasury curve say this week? 2-year yield fell by 4.7 bps; 3-year yield fell by 3.6 bps; 5-year yield fell by 3 bps & the 30-year yield fell by 1 bps for the week. Seems the Treasury curve doesn’t concur with Signor Gross, at least not yet. And what do charts say?
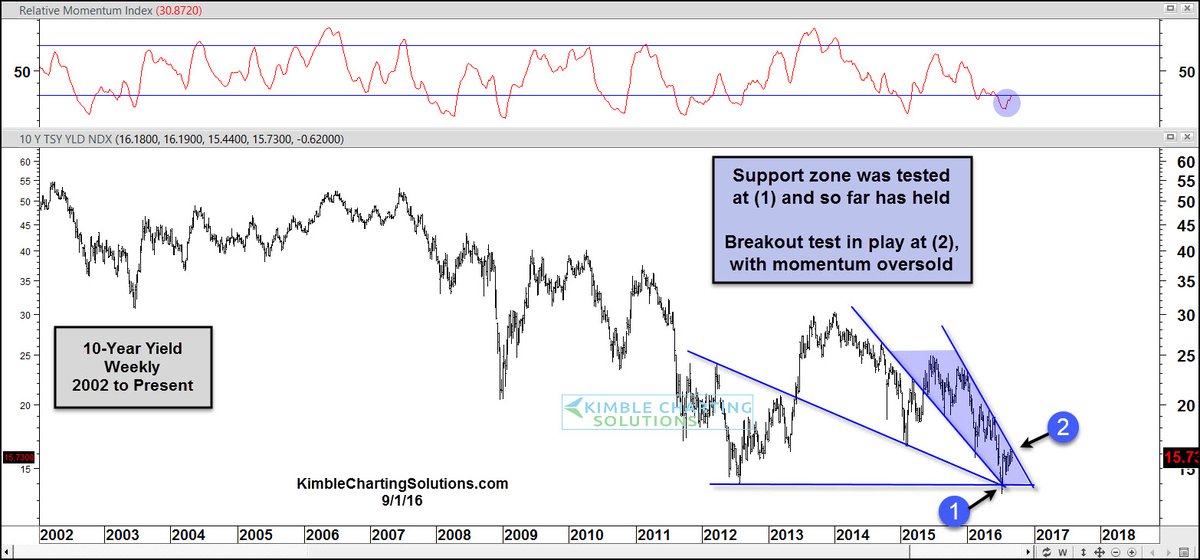
- Chris Kimble
@KimbleCharting – Testing breakout level, of downtrend in yields$TLT$TBF$TBT
You know there might be another reason why the longer duration yields spiked on Friday. Because the German 30-year yield spiked up by 5.7 bps on Friday to close up 10 bps on the week. Why? we have no idea. But if German yields spike, can Treasury yields fall? We don’t think so. Did the Bund action have anything to do with European banks rallying hard on Friday? If Barclays, Deutsche, RBS all rally hard, then shouldn’t Bund yields rise? Makes sense to us.
3. Stocks
A dormant Fed, stable Dollar and low US rates should be terrific for EM stocks, right? Of course, that’s why EEM & EM indices handily outperformed US stocks with Brazil up 4% and India appearing to break out with a 3.5% rally on the week.
But what about the S&P 500? Lawrence McMillan of Option Strategist stays on his course:
- “In summary, we are in a similar state to where we’ve been for a month or more: there are sell signals from breadth and put-call ratios, but those signals have not been confirmed by a breakdown in $SPX or a breakout in $VIX. As a result, the outlook is short-term bullish as long as $SPX remains above 2160“
What about the series of down days in the S&P?
- Ryan Detrick, CMT
@RyanDetrick – The S&P 500 is down 6 of the past 7 days. It is down only 0.73% during those 7 days. That is the smallest loss in that scenario in 16 years.
What doesn’t go down should go up then? Mr. Detrick did not say. But that could be possibility if the idea of a Fed on hold takes root and data comes in lukewarm. What would be more counter-intuitive than a rally to close out the quarter and crash volatility to yet another record?
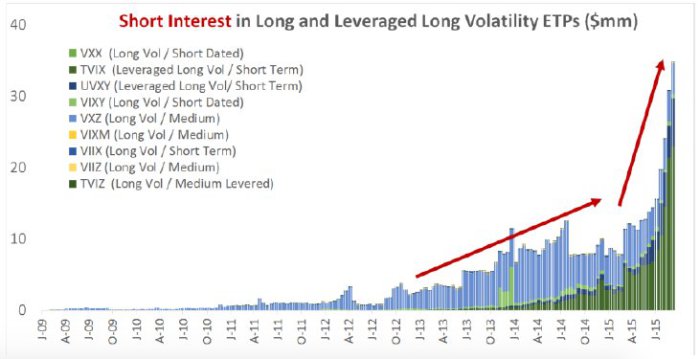
- Jesse Felder
@jessefelder NEW POST: The ‘Short Vol’ Trade Has Gotten Completely Out Of Hand https://www.thefelderreport.com/2016/08/26/the-short-vol-trade-has-gotten-completely-out-of-hand/ …
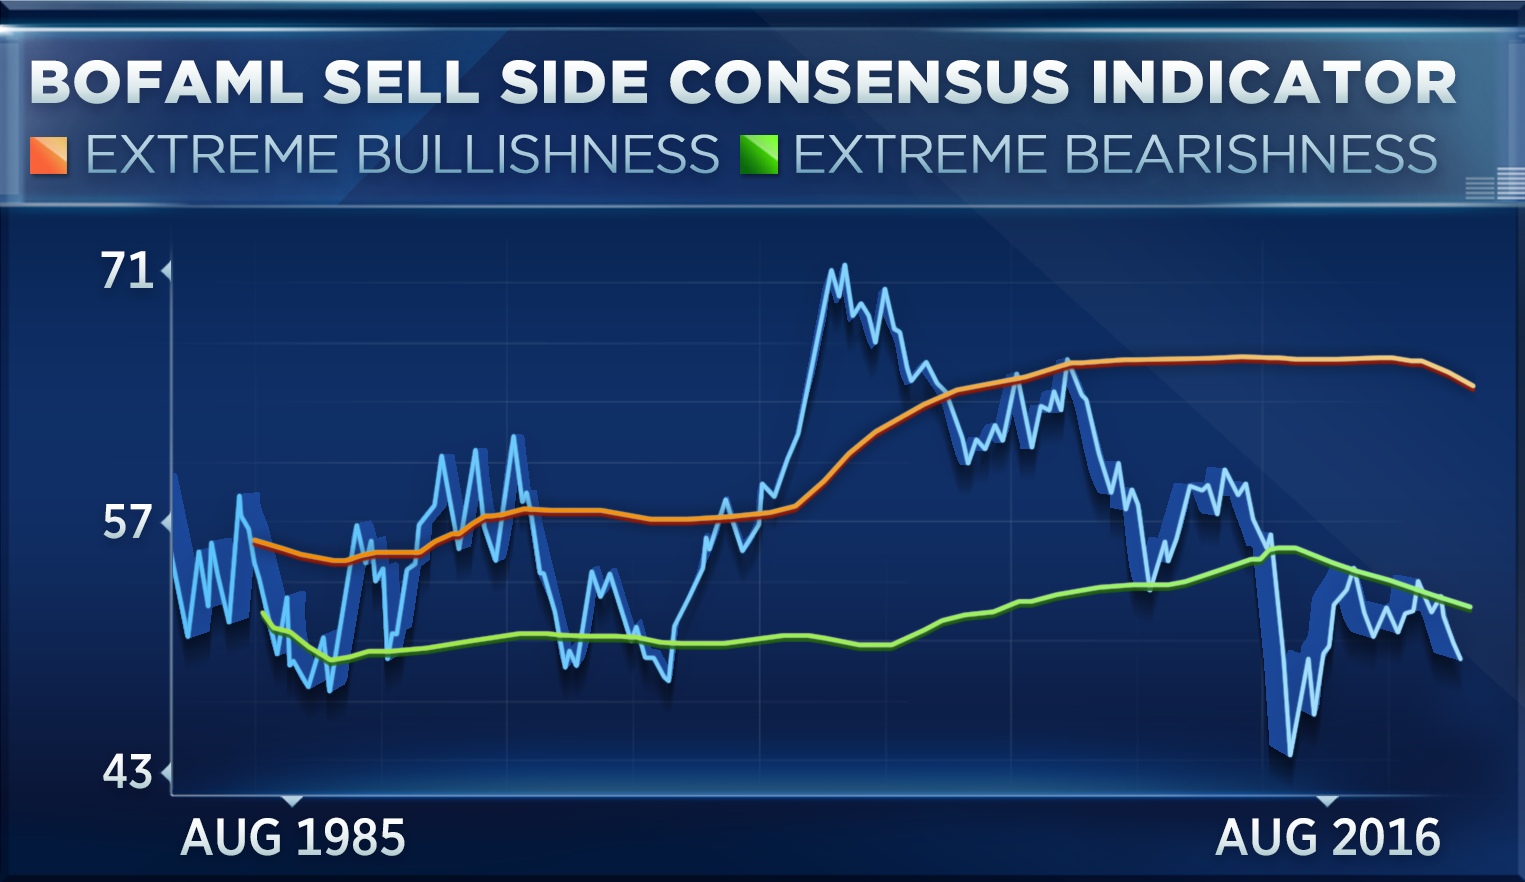
- At this point, the indicator it at its lowest level in more than three years, meaning that it “remains firmly in ‘Buy’ territory after triggering a contrarian Buy signal in April,” according to a Thursday report produced by BofAML’s equity and quant strategy team. (Incidentally, since the May 2 report stating that the indicator slipped into buy territory, the S&P is up nearly 6 percent.) The report goes on to state that when the indicator, which dates to 1985, “has been this low or lower, total returns over the subsequent 12 months have been positive 100 percent of the time, with median 12-month returns of +27 percent.” At this point, the indicator “implies a 12-month price return of 20 percent, and a 12-month value of 2,604″; for a 22 percent return after the S&P’s 2 percent dividend yield is added in“
4. Gold, Silver & Miners