Summary – A top-down review of interesting calls and comments made last week in Treasuries, monetary policy, economics, stocks, bonds & commodities. TAC is our acronym for Tweets, Articles, & Clips – our basic inputs for this article.
Editor’s Note: In this series of articles, we include important or interesting Tweets, Articles, Video Clips with our comments. This is an article that expresses our personal opinions about comments made on Television, Tweeter, and in Print. It is NOT intended to provide any investment advice of any type whatsoever. No one should base any investing decisions or conclusions based on anything written in or inferred from this article. Macro Viewpoints & its affiliates expressly disclaim all liability in respect to actions taken based on any or all of the information in this article. Investing is a serious matter and all investment decisions should only be taken after a detailed discussion with your investment advisor and should be subject to your objectives, suitability requirements and risk tolerance.
1.FOMC – an Apple-like disappointment Or an Amazon-like disappointment?
Empirical experience shows that markets deliver their true reaction to the FOMC statement/presser the next morning and not in the truncated afternoon after the FOMC. This has now become more pronounced because the Fed Chair’s presser tends to go on into 3:15 – 3:30 pm in the afternoon, leaving little time or opportunity for markets to decipher what the Chairman says & react to it.
But strategists don’t take such time. They shoot their opinions right out. Look what a fixed income strategist said on Wednesday afternoon:
- Guy LeBas@lebas_janney – The biggest take away from today’s presser is clearly Powell’s “forcefully, proactively, and aggressively” mandate. If that doesn’t cut off left tail risk from risk asset valuations, nothing will.
Think for a minute & you will see that the FOMC statement & the Fed Chair’s presser are similar to release of earnings & the earnings conference call from a company. What does an earnings release & a conference call do? Either the numbers beat, meet or fall short of expectations. And the call can provide positive guidance, negative guidance or neither.
The Fed statement & presser are kinda the same – they, in essence, either guide towards increased or decreased liquidity into markets or give a steady state message. But understanding what the Fed is saying & doing is a bit more complex. Company CFOs want to make their message clear while the Fed Chair is usually trying to be more obscure. That is another reason why the markets tend to wait until the next morning to deliver their verdict.
But how can we decipher whether the markets perceive the Fed as adding, maintaining or reducing liquidity, not verbally or theoretically but in fact & practically? Our method is clear – we compare the performance of a leveraged closed end fund to an unleveraged ETF from the same asset class, like comparing, for example, post-Fed performance of leveraged DPG vs. unleveraged HYG in high yield credit. Using this asset class makes even more sense now that Chairman Powell has announced he will buy high yield credit.
So let us look at the performance of DPG vs. HYG this past week:
Look at the stark difference between the first 3 days & the last 2 post-Fed days. If you like, focus on the post-Fed Thursday & Friday:
No wonder they say a picture is worth more than lots of words. Thanks to FOMC & Chair Powell, leveraged DPG fell by 8% relative to unleveraged HYG in two days. How clear cut is this message that the Fed deeply disappointed high yield credit?
As a matter of practice, we note down prices of key indices & ETFs about 10 minutes before the FOMC release and then use that to measure the Fed’s impact from the FOMC to end of the week. This week, all markets reiterated the signal of the DPG-HYG spread. A summary of performance from ten minutes prior to FOMC to Friday’s close is below:
- VIX up 18%; Dow down 3.8%; SPX down 3.8% (both vs. down 21 bps for entire week); Russell 2000 down 7.7% (vs. up 2.2% for week); EEM down 5.7% (vs. minus 1% for week); Citibank down 9.5% (vs. up 5.9% for week); HYG down 1.5% (vs. up 35 bps for week); JNK down 1.4% (vs. up 34 bps for week); OIH, the Oil Services ETF, down 7.6% (vs. up 16% on the week).
All markets spoke up clearly & loudly – the Fed’s liquidity apparatus disappointed. A loud OPUD – over promise & under deliver – verdict.
In contrast, every opinionator we heard on Wednesday afternoon on FinTV was as taken in by Powell’s rhetoric as Janney’s Guy LeBas was. Look even Jeffrey Gundlach was fooled until late Friday:
- Jeffrey Gundlach@TruthGundlach – I am told the Fed has not actually bought any Corporate Bonds via the shell company set up to circumvent the restrictions of the Federal Reserve Act of 1913. Must be the most effective jawboning success in Fed history if that is true.
Mr. Gundlach is wrong or simply shortsighted. Risk markets showed on Thursday & Friday that empty jawboning might succeed for a bit but it backfires big time. America is not Europe and our markets are not slave to our institutions.
Remember we pointed out how the relative performance of DPG over HYG had turned on Thursday, March 19, 2020. After that, the risk markets went on an explosive rally from the next week to this Wednesday, April 29. That rally had nothing to do with economic data or earnings. It was purely based on the market’s conviction that the Fed would add massive amounts of liquidity until earnings & the economy are able to stand on their own feet.
We don’t want to be unfair to the FOMC or Chairman Powell. The rally over the past 6 weeks or so has been so great that, perhaps, they did not want to add more fuel to it. Perhaps that is why they began dragging their feet a couple of weeks ago in adding liquidity to credit & other sectors. The pace of their QE purchases have slowed down materially & so has the pace of growth of the Fed’s balance sheet.
So the big question is whether Chairman Powell & the Fed merely suffered an Apple-like sell off due to overly optimistic expectations or whether they were deliberately trying to signal a Bezos like “take a chair” message – meaning they are playing a long game & the markets need to get used to a slower pace of liquidity injections & balance sheet growth.
We hope the Fed disappointment was the Apple kind & not the Amazon kind. Because Amazon did beat on revenue expectations while the Fed has not beaten on any expectations lately except talk. This Fed cannot afford to badly disappoint markets, at least not until America re-opens and US GDP & incomes bounce back.
2. Stocks
Last week we did feel that a big rally was likely to close out April. Our factors were falling VVIX & VIX, large number of bears, large shorts in the Russell 2000 & month end. Well, we got a great rally into the close of April, a rally that got a overly verbose guy from CNBC Half Time team to exult – “what’s happening with small caps is absolutely breathtaking” after Wednesday’s close. This guy has been negative on the rally during the past couple of weeks & finally got crazy excited on Wednesday’s close.
In contrast, Jim Cramer wondered aloud on his show on Wednesday evening whether a fund, a short fund, had blown up during Wednesday. A valid question because Wednesday’s stock buying was incredible in virtually all sectors. We don’t know if any short entity blew up but it was clear that the buying of Russell 2000 small cap ETF was exhausted by Wednesday evening.
So what are the facts? And who was right on Wednesday, the verbose opinionator on CNBC Closing Bell or Jim Cramer? Look what Morgan Stanley & Goldman prime brokerages reported, courtesy of The Market Ear:
- MS’ PB Content team: “Wednesday was the largest day of net buying we’ve seen in over 5 weeks as the S&P rallied +2.7%…the covering of single-names by L/S funds was in line with some of the largest days we have seen YTD.”
- GS Prime writes they saw the largest short covering in USD terms in more than 4 years (+4.1 SDs move) on Wednesday, driven by both individual names as well as macro plays (approx 50/50 split) on the other hand they point out that “April is still on track to be the largest net selling month on the GS Prime book in ~3.5 years (since Aug ’16)”
No wonder the stock markets sold off big on Thursday & Friday. The big short positions were extinguished; the trend following fast money had finally gotten long and, according to Cramer Fav Helene Meisler, “Investors Intelligence Bulls now 46.6. Highest since late Feb.” And add to that the biggest factor of them all – the market’s intense disappointment with the Fed’s lack of action.
Those who think we make too much of Fed & its liquidity should recall what the Man has said a number of times – “Earnings don’t move the market, its the Federal Reserve…focus on the movement of liquidity“. And when did we hear Druckenmiller say this first? In 2000, the last time NDX was as loved.
We fervently hope that Chairman Powell remembers that. If not, Larry Kudlow should gently remind him of that. The big difference between 2000 & 2020 has been that in 2000, Chairman Greenspan was determined to raise rates until tech-telecom rally blew up while, at least so far in 2020, Chairman Powell has said he will add liquidity & not raise rates for the foreseeable future.
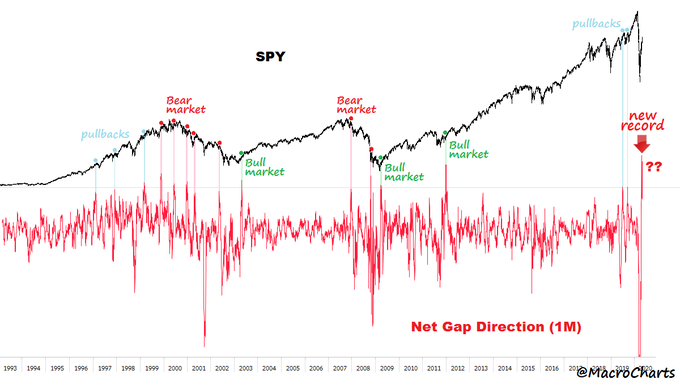
So what happens in May? We don’t have an edge here & the history of huge up & down months gives us pause.
- Macro Charts@MacroCharts – – Stocks gapped DOWN the most ever in March. Stocks gapped UP the most ever in April. In 30 years of $SPY, this extreme Vol was *mostly* in transitions between Bull<>Bear markets. Mean reversion is brutal and markets are merciless – be ready for everything in May. $ES_F $SPX
To us, it depends on whether Chairman Powell feels bold enough to emulate a bit of Greenspan-2000 or remain the antithesis of that.
We do see a couple of encouraging signs at least for early next week. First is that the trend channel of the Russell 2000 ETF from March lows still seems intact. Secondly the tweets from a couple of smart folks on Friday afternoon:
- Helene Meisler@hmeisler – Put/Call ratio 115.
The above, unfortunately, is not an accurate timing device. On the other hand, look what some one who was smart enough to short after Wednesday’s close did on Friday afternoon:
- Douglas Kass@DougKass – Back to market neutral (we stand right on my “fair market value” for S&P) as I just sold half of my large $SPY put positions. @realmoney
- Douglas Kass@DougKass – Out of $SPY short at $281.90 @realmoney Still own large SPY puts.
Finally those who like interesting indicators like DJORI should read the article by Tom McClellan titled Dow Stocks’ Behavior Says More Uptrend Ahead. He explains that his indicator “involves calculating a McClellan Price Oscillator for each of the 30 Dow stocks, and then evaluating whether each one is rising or falling. The DJORI then reflects the percentage of the 30 Dow stocks which have a rising Price Oscillator“. So what is his DJORI telling him now?
- Seeing the DJORI get up to a 100 reading conveys a promise that there is more advance yet to come. Important price tops for the overall market typically only come after a divergent lower high appears.
- We do not have one of those yet. The DJORI has been bumping up against the 100 level like a helium balloon bumping against the ceiling. No divergence is apparent yet, and so the implication is that there is not a proper top condition yet to end this rebound rally.
3. 2020-Cloud Stocks vs. 2000-Tech Stocks
Many keep pointing out the similarities between stock performance between these two stock baskets. Some have even included interest rates in their comparisons. We ourselves have used some of these. But we wonder whether a critical variable is missing in these comparisons. That variable is Fed’s liquidity, even something as simple as size of Fed’s balance sheet.
Just look at Microsoft. The “crazy” 2000 PE of 60 was when no one ever talked about the Fed’s balance sheet. How could we compare that with today’s PE with a 6.7 trillion balance sheet? And that is a highly relevant variable. Haven’t we all seen charts that show how strong the correlation was in the past 10 years between S&P and the Fed’s balance sheet?
So we decided to look at ratios of market caps of big cloud stocks to the Fed’s balance sheet size – MCAP/FBS or MC/FB ratio. Actually it gets easier if we multiply the numerator by 100 to get a more intuitive MC/FB ratio. So as of Friday, May 1, 2020, the MC/FB ratio of Microsoft is 132.4T/6.7T = 20. And the MC/FB ratio of Amazon is 114T/6.7T = 17.
Now go back 1-2 months when the Fed’s BS was only 4 trillion & Microsoft’s market cap was 1.1256T. So at that time, the MC/FB of Microsoft was 28. And Amazon’s MC/FB was 22.
How amazing, how realistic but how un-intuitive is this? Un-intuitive because it shows that, over the last month & despite the torrid rally in their stock prices, both Microsoft & Amazon have become CHEAPER relative to Fed than they were on April 2 at much lower prices & PE ratios. Because their MC/FB ratios have dropped from 28 to 20 for Microsoft and from 22 to 17 for Amazon. Also by this measure, today’s MC/FB ratios of Microsoft, Amazon & all cloud stocks would be much much cheaper than in 2000.
Note also that when the Fed is in a restrictive or balance sheet contracting mode, the MC/FB ratios of all stocks would go up higher & make these stocks very expensive & more likely to fall. When the Fed is in an expansionary mode, this MC/FB measure of value would make stocks cheaper & more likely to go up.
So think about it. Doesn’t our MC-FB measure easily fit Druckenmiller’s dictum that “Earnings don’t move the market, its the Federal Reserve…focus on the movement of liquidity”?
You add this concept & you can see how ridiculous it is to compare today’s MSFT & AMZN et al in today’s 6.7 trillion Fed’s balance sheet environment to the 2000 versions of tech stocks.
But even without all that & only relative to interest rates, what do we find?
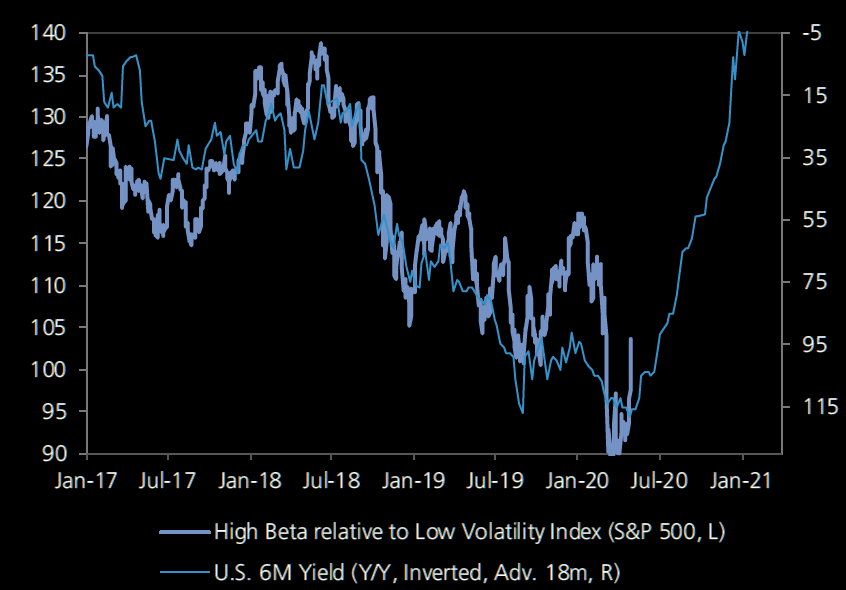
- Market Ear – Interest rates / yield curve would argue for a continued rally in high beta
Remember our comparison of last week to the outsourcing movement in 2002?
- Remember how outsourcing, both in manufacturing & in tech services, was almost unheard of in the 1990s. US Corporations liked the idea in theory but no one wanted to risk it. And there was no reason to change their business model so drastically. Things were fine as they were. Then came the brutal squeeze on profit margins in 2002. Stocks of big companies (GE, MSFT …) went into a nasty bear market from October 2000 into end of 2002.
- That virtually forced big US companies to begin outsourcing manufacturing to China & tech services to India, leading to cherished productivity gains & robust profit margins in America and a bull market in China, India & emerging markets.
We thought last week that model would help us understand how CoronaVirus might lead to a move to digital work by US companies.
What did we find this week? Microsoft saying 2 years work in 2 months:
- Microsoft via Market Ear – “…we have seen 2 years’ worth of digital transformation in 2 months. From remote teamwork and learning to sales and customer service to critical cloud infrastructure and security, we are working alongside customers every day to help them stay open for business in a world of remote everything.” … There’s no turning back, for example, in telemedicine, right? If you look at even what has happened in this first phase with AI bots powering telemedicine triage. That’s going to change, I think, what health care outcomes look like. Same thing in education.”
What about GOOGL, you ask?
- GOOGL via Market Ear- “Ultimately, we’ll see a long-term acceleration of movement from businesses to digital services, including increased online work, education, medicine, shopping and entertainment. These changes will be significant and lasting.” … “…the highest level of opportunities across everywhere, we see businesses thinking deeper about the shift to digital. And that’s true across marketing, cloud, in every place we see that trend…People who may have been hesitant to shift their budgets do — are looking through moments like this and trying to get all that working better. Cloud is an obvious area. Every company has been thinking about digital transformation, but they are asking the questions deeper. For example, if you have data centers, there are fixed costs through something like this. And you learn going through a moment like that, and you’re thinking about the opportunity harder.”
In this environment, a Jeff Bezos saying “take a seat” to Amazon shareholders is a good thing, a thing that should make the stock more attractive to investors assuming the Fed remains expansionary. And how do we measure this? Via our MCFB measure.
The very big question is how long will this Fed keep its balance sheet expansionary? At least until 2022 & perhaps even into 2023, in our estimation.
4. An article worth a read
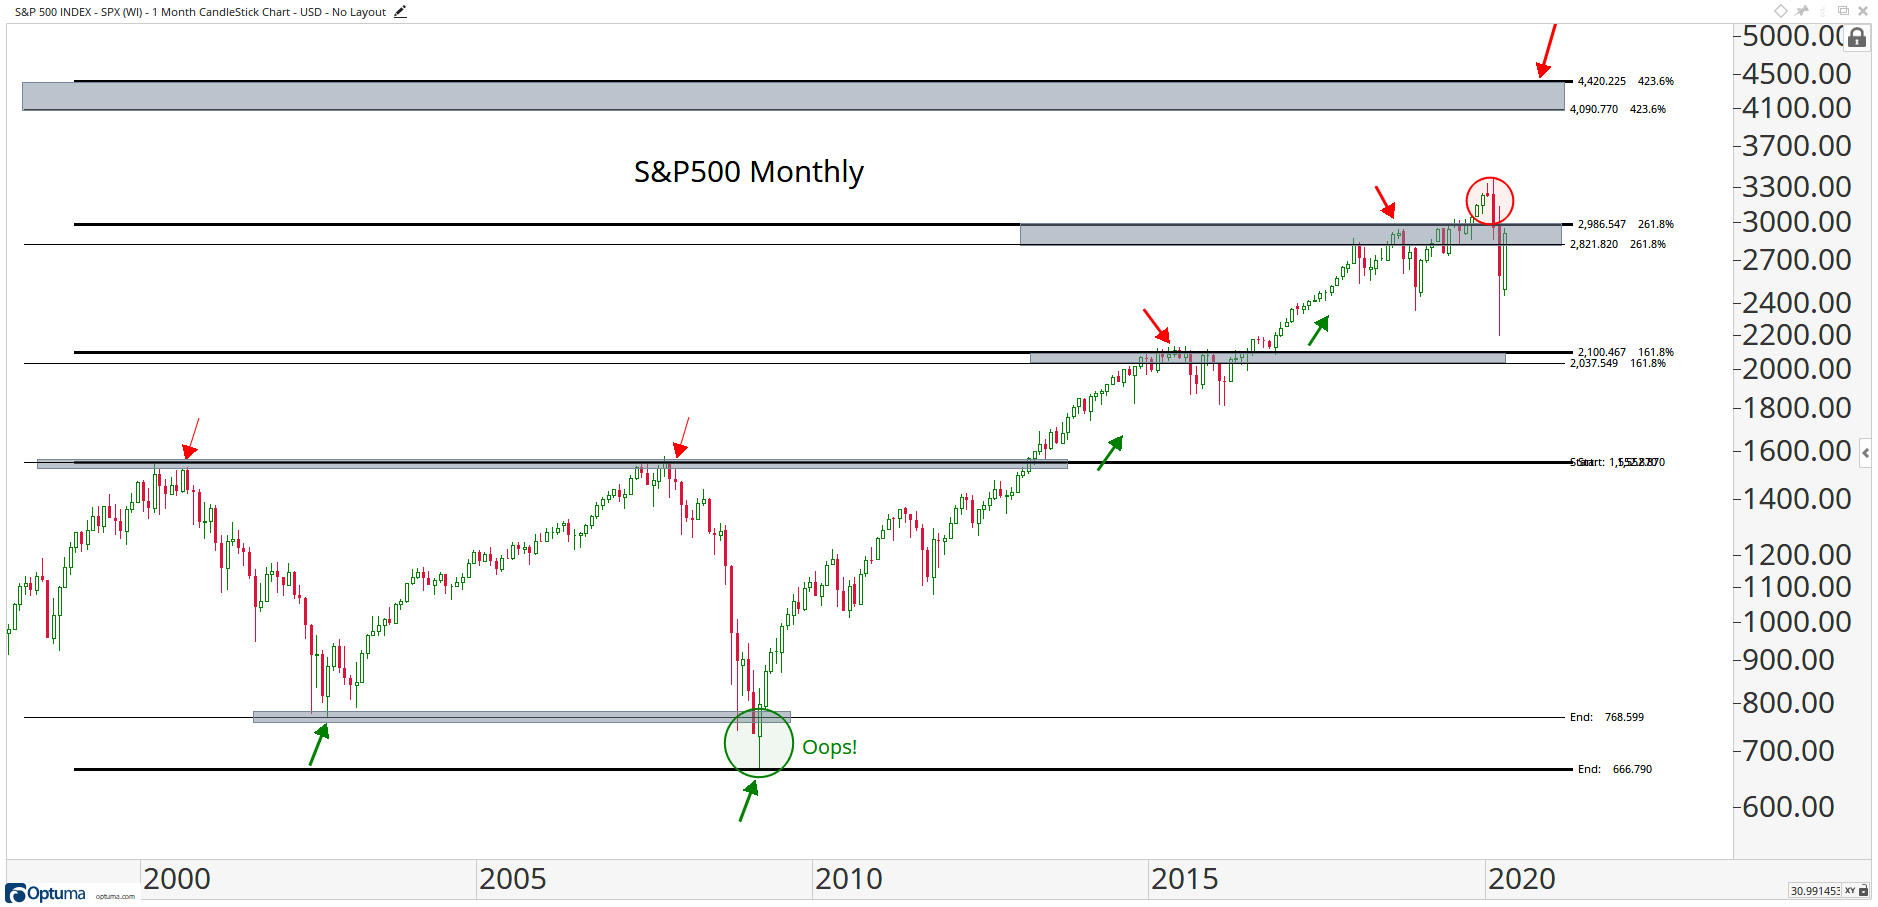
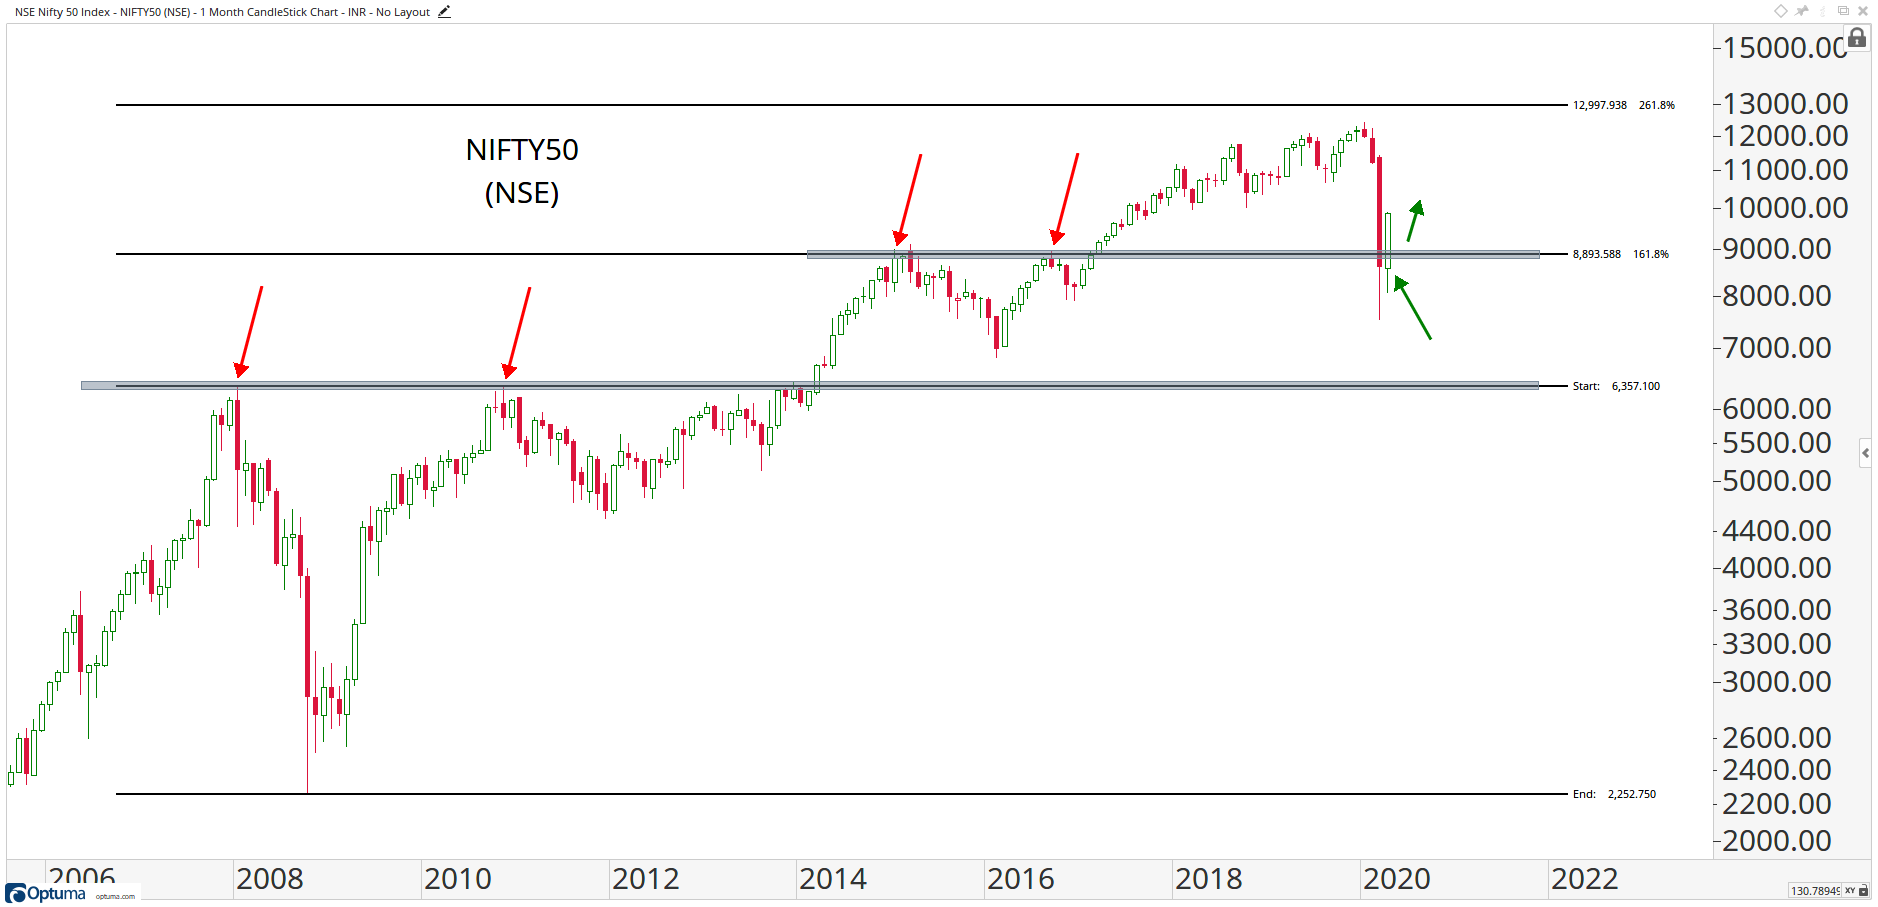
We urge all to read the May 1 article by J.C.Parets titled Monthly Candlestick Review: Crash Edition. Whether you agree with his conclusions or not, it will help you think better & more rigorously. Below are a few excerpts:
- The S&P500 is back to this major overhead supply area that has been trouble since the beginning of 2018. We can argue that this is when this massive consolidation first started. Last year could have just been a false start and the real breakout is still coming. … I think this is probably the higher probability outcome vs this being a major 2+ year topping out process ending this massive structural uptrend:
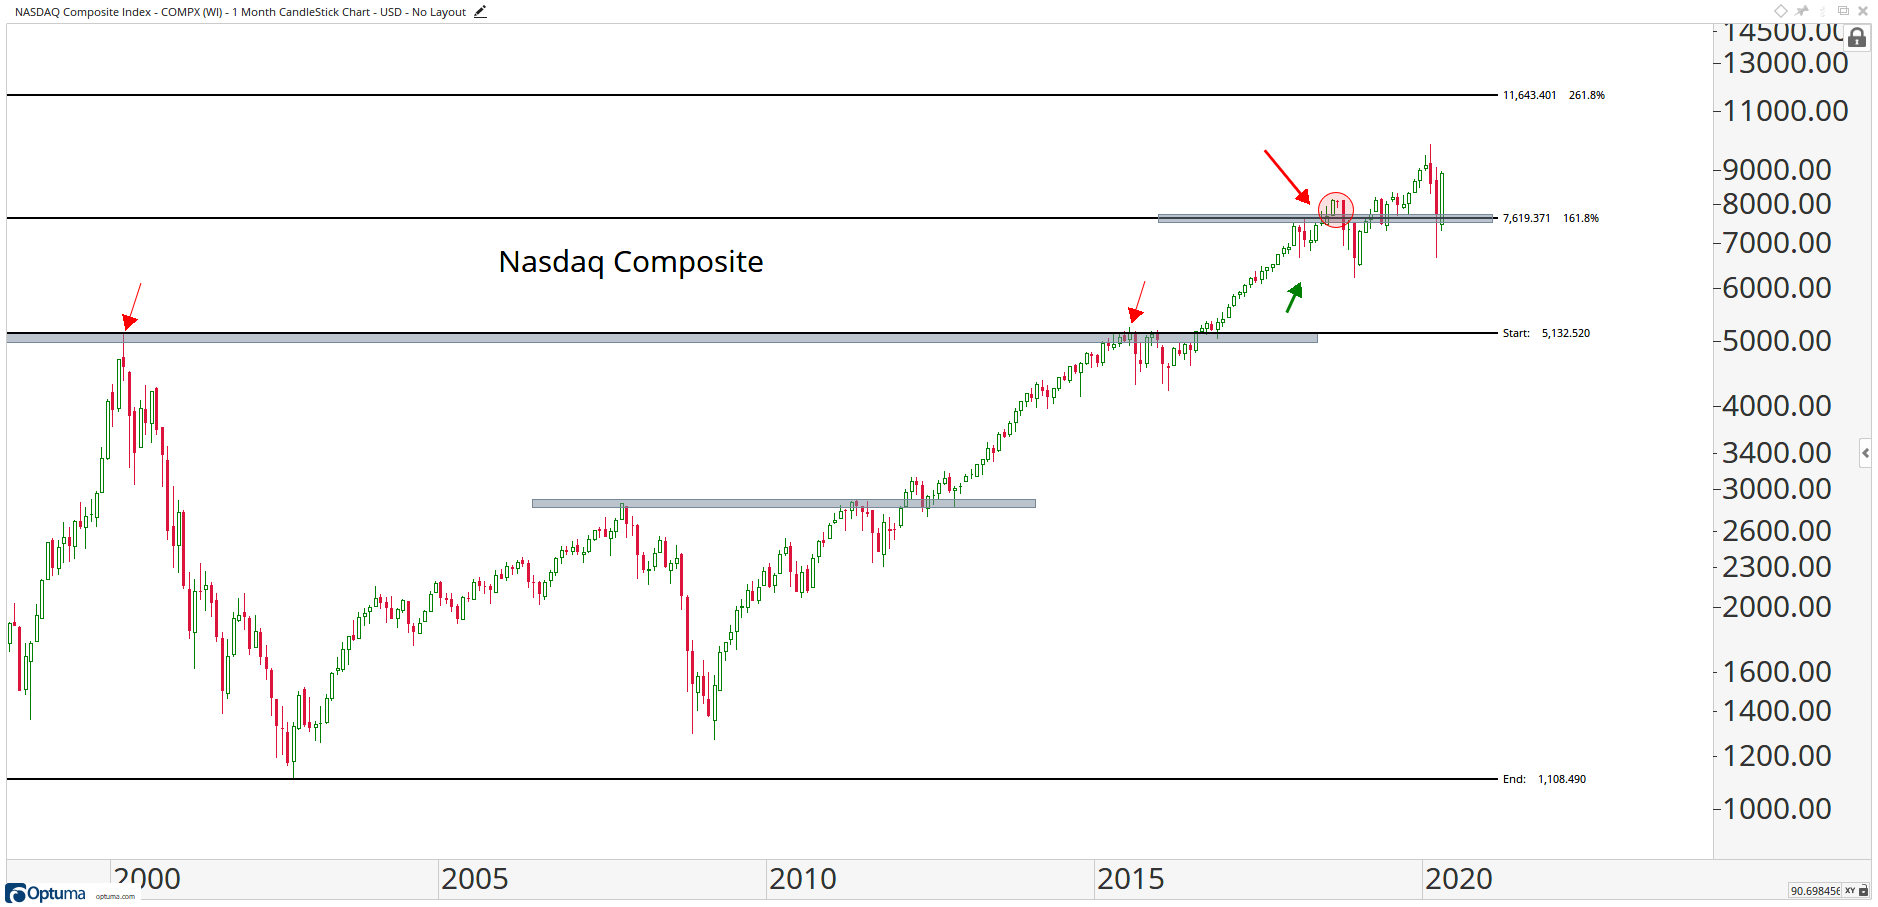
- As usual the Nasdaq is in beast mode on a relative basis. Nothing in the world, equities-wise, looks like the Nasdaq. Trust me, we look at a lot of charts. They do not look like this:
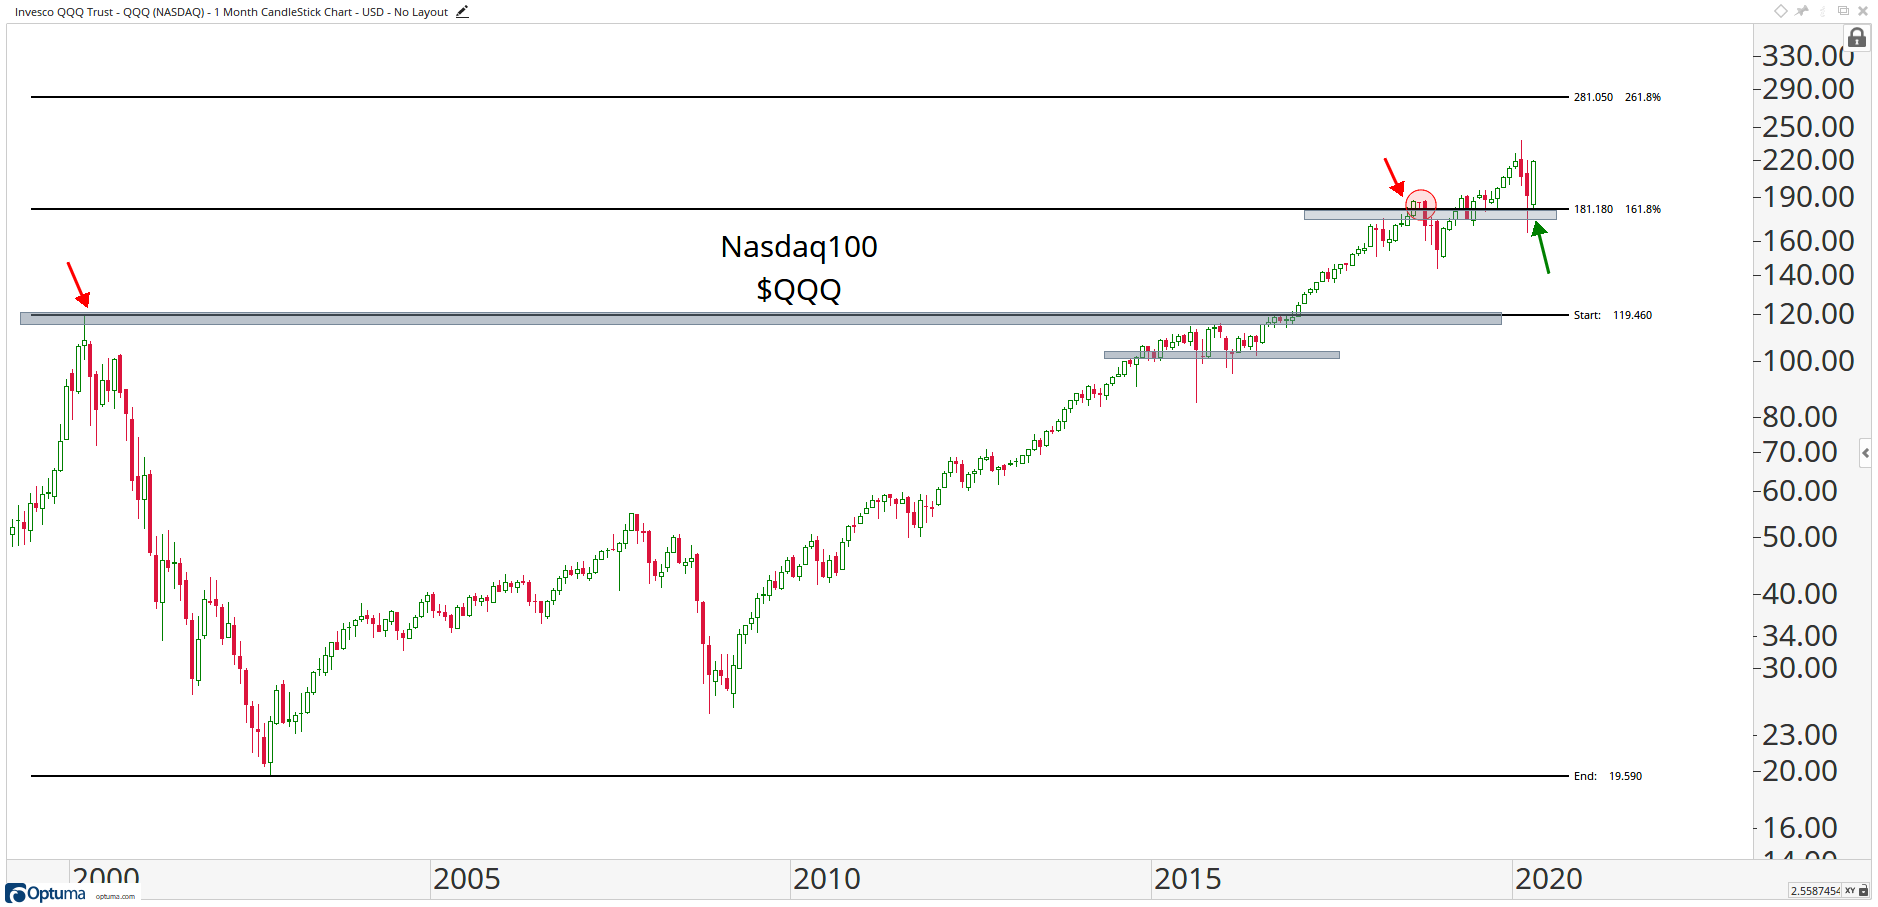
- It’s the Nasdaq 100 holding above 181 that has been a big one for me. We’ve identified this level time and time again. If we’re above that, the world is not ending. In fact, the Nasdaq100 went out just 16 cents from new all-time monthly closing highs. According to my calculator, $QQQ missed an all-time high this month by just 0.073%. … The relative strength out of the Nasdaq is just tremendous. There’s no other way to put it.
- The strength in India has to be recognized. We do a lot of work on Indian Stock Markets. If we’re above those 2015-2016 highs, near 8900, how are we not buyers of this market?
5. China
The anti-China statements from President Trump did add to the damage inflicted on the stock market, especially on Thursday evening & Friday pre-market. Asian markets are very sensitive to another US-China trade war & this time the comments dealt with the ultimate explosive issue – China’s ability to sell & repatriate its investments in US Treasuries & US ability to stop that.
Larry “MW”* Kudlow stepped in on Friday morning to absolutely rule it out. But it remains a powerful weapon in the US arsenal against China, but ONLY as a defensive weapon. Meaning China has to act first or be believed to be on the verge of acting to deliver a blow to the US financial system by a blitzkrieg type action to liquidate its Treasuries. That would be a kamikaze type of semi-suicidal move by China & President Trump has the legal authority to freeze Chinese accounts & positions to protect US markets.
However, the anger at China is real & deep. Every one in America knows that the CoronaVirus was born in China & China allowed it to spread to the world including America. And, instead of opening up its labs to global investigators, Chinese leadership is acting in its traditional “fear & tremblingly obey” dictat to the world.
So speaking against China & asking for damages is a powerful political tool for President Trump & Republicans. In this, they will be supported by the center of the Democrat party. In fact, we don’t think any one running for office will speak one word in defense of China ahead of November elections.
But as Geopolitical Futures wrote on Friday,
- “There are certainly powerful political incentives for the White House to act against China … expect any retaliatory moves by the U.S. to be measures it already wanted or intended to implement anyway. Maybe it just needed political cover to push through.”
What is really needed, in our opinion, is to build an Anti-Pandemic deep cover task force (like Mayor Bloomberg’s post-9/11 anti-terrorism task force within the NY Police department) to infiltrate & collect early warning signs of the next pandemic that may be brewing in far corners of the world. More on that in our adjacent article –Welcome Back Mayor Bloomberg – 9/11 vs. CoronaVirus – Al-Qaida vs. China.
6. Planets lining up!
They literally did early this morning, according to Raj Mundhe, a friend, a reader & a successful financial advisor, and the gentleman who sent us the photograph below of Mars, Saturn & Jupiter (from left to right):

Send your feedback to [email protected] Or @MacroViewpoints on Twitter