Summary – A top-down review of interesting calls and comments made last week in Treasuries, monetary policy, economics, stocks, bonds & commodities. TAC is our acronym for Tweets, Articles, & Clips – our basic inputs for this article.
Editor’s Note: In this series of articles, we include important or interesting Tweets, Articles, Video Clips with our comments. This is an article that expresses our personal opinions about comments made on Television, Tweeter, and in Print. It is NOT intended to provide any investment advice of any type whatsoever. No one should base any investing decisions or conclusions based on anything written in or inferred from this article. Macro Viewpoints & its affiliates expressly disclaim all liability in respect to actions taken based on any or all of the information in this article. Investing is a serious matter and all investment decisions should only be taken after a detailed discussion with your investment advisor and should be subject to your objectives, suitability requirements and risk tolerance.
1.Goldern Silence & “powerful seasonal patterns“
It was such a nice week, wasn’t it? Pleased just about everybody except, of course, the mal-intentioned:
- Dow up 2%; SPX up 2.6% with equal-weighted RSP up 3.3%; NDX up 3.4%; RUT up 3.6%; DJT up 4.5%; TLT up 2.3%; EDV up 2.6%; Gold up 1.1%; Brent up 2.2%; Copper up 2.6%; Dollar also cooperated by falling 1.3%%
Diverse sectors like Financials, Materials & MMAAN were nicely up:
- BAC up 3.6%; C up 3.9%; GS up 10.1%; Microsoft up 1.3%; META up 2.6%; Apple up 2.6%; Amazon up 7.4%; Netflix up 16.1%; CLF up 4.4%; FCX up 6.6% & MOS up 5.1%;
And EM also joined the party:
- EEM up 2.7%; EWZ up 46 bps; EWY up 2.8%; Indian ETFs up 2%; KWEB up 2.5%; FXI up 80 bps;
A joyous week for almost all! But what was the trigger? Yes, we had outlined charts & positioning stuff last week. But that was present the week before as well. To our simple way of thinking, it was the absence of the two biggest negatives. Recall what had stamped out previous attempts to rally. The Fed talkers had always come out and stomped all over stocks. Their partner had been strong inflation data.
But this past week was a black-out week for the Fed. So after the speech by Waller on Thursday July 14 afternoon, the mouths & mikes of the Fed talkers were silenced. And the bad inflation data was behind us at least for a couple of weeks. So we wondered last week whether, with the two biggest enemies of stock rallies on the sidelines, stocks might raise their heads up without lot of fear?
OK, but what now? There is no shortage of experts who said all week that this was a rally to sell, if not now then absolutely at 4,200 & probably even at 4,100. They could be right. But we are in a good mood & so we thought we would begin with positive thoughts – from a couple who, while not in the league of Mr. Fields, are W.C. nonetheless.
We refer of course to Williams & Cramer. We heard from them on Tuesday, July 19 after the 754 point rally in the Dow. To quote Jim Cramer:
- On June 17, the Williams panic indicator flashed a buy signal – something that has happened 18 times in the last 90 years & almost every time you had a bounce … so we have got capitulation; right now Williams thinks we have got time on our side; a fabulous historical pattern of time on our side … years that end in 2 – what technicians call the decennial pattern … historically those years started off weak and finishing strong … there is also a 20-year cycle going back to 1880; we have been through this cycle 6 times before and in each of these cycles we got a bull market; … if the 20-yr cycle holds, Williams says we could have a nice run over the next few years … Larry points out you are 5 for 5 if you bet on this cycle since the 1880s – bottom line – Wall street has finally thrown in the towel & some powerful seasonal patterns are finally on the side of the bulls …
Watch the clip below, at least for the charts of the patterns:
Last week we had featured a chart from The Market Ear about the lack of participation by Systematics. That may change next week:
That would be on top of the monies that have come in already. J.C. Parets pointed out in his email on Thursday July 21 that,
- The median exposure among active managers is up to 45% from just 1.25%. The only week with a bigger increase was in October of 2013 when the median exposure rose from 50% to 100%.
Since a picture is better than words,
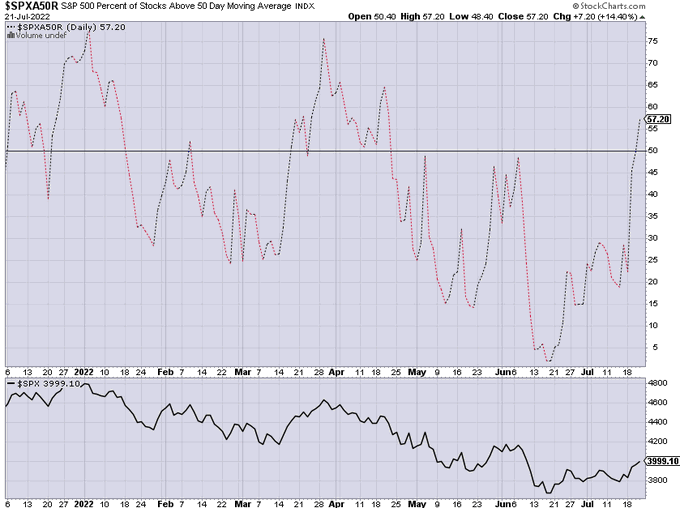
- Jason@3PeaksTrading – – Update: % of $SPX stocks above their 50 day MA now at 57.2%, the highest since mid April after bottoming last month near a record low 2%.
And VIX fell 5% on the week to close at 23.03. And VIX also fell below its 200-day moving average, as Lawrence McMillan of Option Strategist pointed out:
- “Breadth exploded on the positive side over the past week, and both breadth oscillators are on buy signals and are in overbought territory. There was a “90% up day” on July 19th. It is a good thing for these breadth oscillators to get overbought when $SPX is in the early stages of a bullish move. “
- “… A potential major change of trend is possible, as $VIX has fallen below its 200-day moving average. That removes the $VIX trend sell signal, but it is not a buy signal.”
But the same fact suggests a big warning to some:
- Bob Lang@aztecs99 – July 23 – big WARNING sign from the VIX here with a close under this 200 ma.
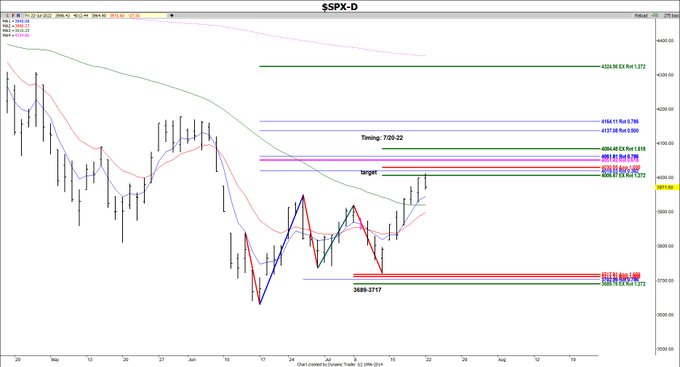
Whether a warning or not, we do seem to have reached an interesting juncture:
- Carolyn Boroden@QueenOfFibs – – $SPX met target 1 today into timing resistance
Chris Verrone of Strategas was negative on July 21, especially on the Semis. He was joined on July 22 by Jonathan Krinsky of BTIG who said, among other points,
- “… we are probably 70%-80% through the rally in the Nasdaq … as we start getting into August, we think correlations are going to rise again & that’s going to lead to that final drop in the S&P that we are looking for …. “
The above are opinions in contrast to one fact – the ending of this past week’s Golden Silence. It will be replaced by a global megaphone via Powell’s presser on Wednesday, July 27th.
2. Interest Rates – “all data has been crummy”
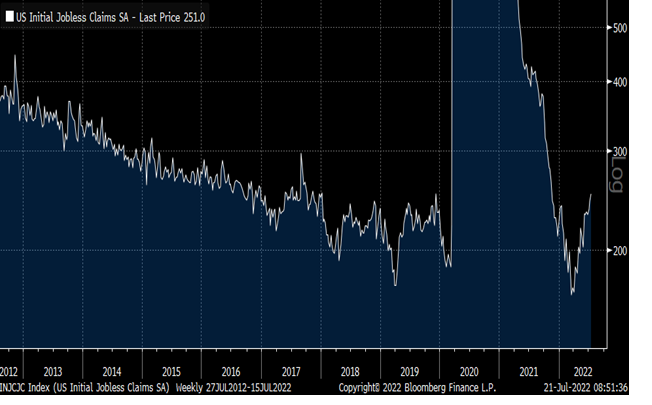
Last week it felt to some that everyone was talking about Treasuries, an overbought sign. And that is how Treasuries acted from Monday to Wednesday. Then came Thursday, the day Santelli said “all data has been crummy“. Not just crummy but momentously so, even without talking about what the ECB did. And the data created a turn in Rich Bernstein’s skepticism about a slowdown:
- Richard Bernstein Advisors@RBAdvisors – – #Jobless claims (LEADING Indicator) are clearly slowing as they did in 2019 after #Fed tightening. Not a hair-on-fire event but needs to be monitored closely.
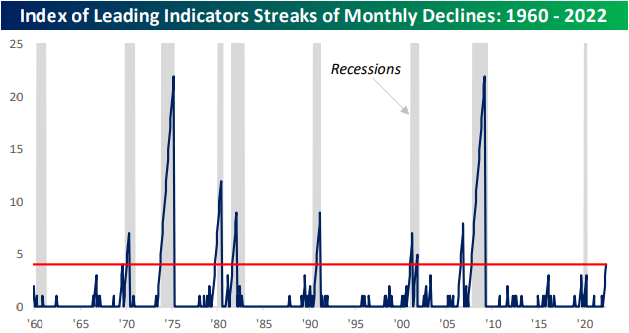
Then came the Leading Indicators Index. And it brought the R-word closer not to Rich Bernstein but to Bespoke:
- Bespoke@bespokeinvest – – June was the fourth straight month of declines for the leading index. Every prior streak of that duration came either during or right before a recession. Read further on this topic and more in tonight’s Closer: bespokepremium.com/interactive/po
Then came the L-word from the man who knows more about that Lehman than anyone else:
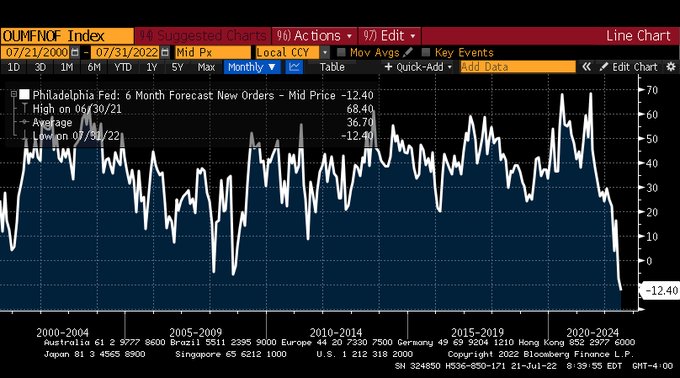
- Lawrence McDonald@Convertbond – – Lehman Territory – Philly Fed 6m outlook – new orders are lowest on record – worse than 2008. The Fed and their pawns still calling for 200-250bps more take hikes, $1T of QT into this mess. We sit down with @RaoulGMI on @RealVision to discuss soon.
That sent Treasury yields streaking down in double digits with the 10-year breaking the 3% barrier with a 13 bps down move to 2.90%.
That brought us to Friday with another double digit down day for Treasury yields thanks to the preliminary ISM figure.
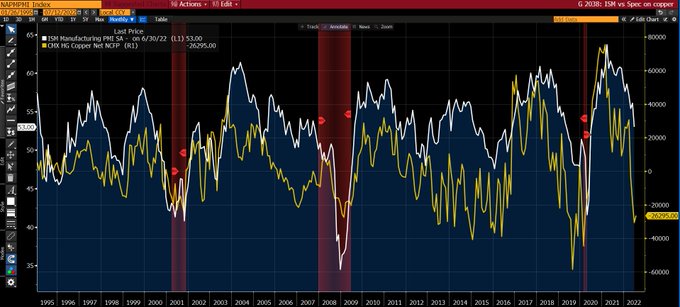
- Lawrence McDonald@Convertbond – – US Economists – on Recession 1. “A 2024 event at the earliest” 2. “Possibly 2023, 2nd half.” 3. “Ok early 2023, but shallow” 4. “ISM says 2022 is in the cards now” 5. “I should have just listened to copper”
That erased the rise in Treasury yields from Monday to Wednesday to close the week emphatically down:
- 30-yr yield down 11 bps; 20-yr yield down 11 bps; 10-yr yield down 17 bps; 7-yr down 18 bps; 5-yr down 18.5 bps; 3-yr down 20 bps; 2-yr down 14 bps; 1-yr down 7 bps; TLT up 2.3% to 119.00; EDV up 2.6%
Is that it for TLT? Not according to Chartmaster Worth of CNBC:
But his might be too modest a target if the big driver for lower yields materializes.
3. Europe & Global Recession
USA & Europe together have 60% of Global GDP. What happens to Global GDP and the global economy when both USA & Europe are in simultaneous recession? But that is so hypothetical, isn’t it?
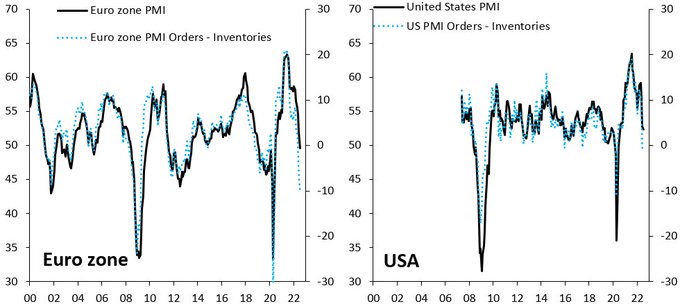
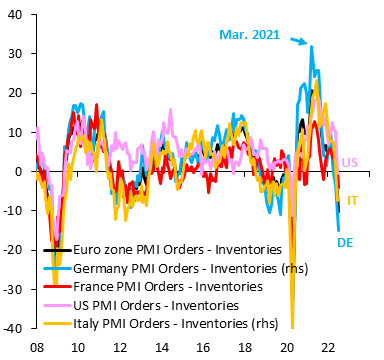
- Robin Brooks@RobinBrooksIIF – – Global recession is coming. Euro zone manufacturing data are nosediving, with the forward-looking orders – inventories metric in the manufacturing PMI nearing 2008 levels (lhs). Data for the US are heading in the same direction (rhs). The global economy is going into recession…
But what about the rest of the world, like EM?
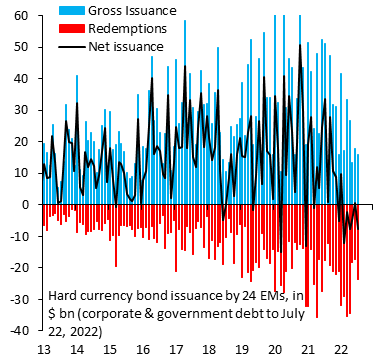
- Robin Brooks@RobinBrooksIIF – – Global recession is coming. Hard currency debt issuance by EM corporates and governments is negative in net terms (black), with gross issuance (blue) falling increasingly behind amortization (red). Tighter financial conditions are transmitting DM recession to EM. With @econchart
So far this is just plain economics. And we all saw this back in 2012-2013, right? That was because the southern European countries (PIIGS) were in trouble & Germany was rock solid. That was not hard to fix. They just made Draghi the Chairman of ECB and he declared he would buy every single PIIGS bond that was in trouble. Germany backed him and the crisis was over.
They can do the same thing now, right? But wait, Draghi just resigned as Prime Minister of Italy & Italy has announced new elections for September 25, two months from now. And it is not the same Germany either. It is not led by the powerful determined Merkel who was the acknowledged leader of Europe. This time it is Germany that is in severe trouble, not the southern PIIGS. It is a Germany that may not be able to provide both lights & heat to its citizens this winter.
Yes, the ECB did raise interest rates by 50 bps this past Thursday. That was a day of relief. Then came Friday and German interest rates fell as if in a catastrophe. The German 2-year fell on Friday by 26 bps, from 65 bps on Thursday to 41 bps at Friday’s close. It was this disaster that drove the Treasury yields into a waterfall decline.
That is what happens when a central bank tightens rates into a falling economy.
- Robin Brooks@RobinBrooksIIF – – One day after the 50 bps hike from the ECB, German manufacturing data are cratering. The forward-looking orders – inventories component in the manufacturing PMI (blue) is well on the way down to the lows of the global financial crisis in 2008. Euro zone is going into recession…
Is there any way to stop the rout in Europe? Yes – Get Ursula to resign & make Mario Draghi the head of EU with the carte blanche to do whatever he thinks is best for Europe.
4. Powell on Deck
The Golden Silence ends on Wednesday with Powell’s presser after the FOMC statement. This may be the most important presser of his tenure. What is at stake is the policy, direction and style set by Bernanke Fed after the 2008 financial crisis – the conviction that wealth creation is the key to the growth of U.S. Economy with its subsequent trickle down via consumer spending & spending influenced employment.
In contrast, what has Powell done so far this year?
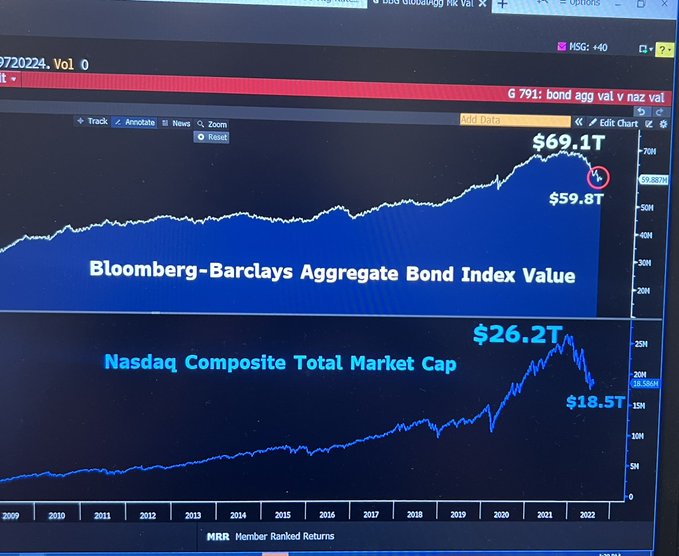
What is the total loss on all assets, Larry Asks? $25T $30T? $35T? Both Bernanke & Powell cannot be right, can they?
But all this is probably irrelevant to what the FOMC will do next week – raise rates by 75 bps. Markets know this & expect it. But Chairman Powell has been a maestro in his pressers. So what if Powell actually appears to hint about a data-dependent policy going forward? If not in September but at least by November?
We saw how rewarding Fed’s silence was this past week. How rewarding might Fed’s newly embraced data-dependency prove next week & even the week after? No harm done if the inflation data keeps coming in hot, because the Fed is already set for at least a 50 bps increase in September. But if the payroll data disappoint & the inflation data even hint at receding, then the hint of data-dependency of the Fed would prove to be the sensible path, right?
We do believe that the U.S. stock market is holding its breath with this hope. If the Fed hints at data-dependency, the stock market might do what Larry Williams, per Cramer, says it has done historically. If the Fed proves as dumb as the ECB was last week, then first 3,400 & then 3,000 might be in the cards before the November election.
We believe that Chairman Powell was disturbed by what happened to interest rates after the ECB raised rates this past Thursday. We doubt if they want a repeat performance in American credit markets. On the other hand, the Fed is ultimately all about its public standing!
Send your feedback to [email protected] Or @MacroViewpoints on Twitter