Summary – A top-down review of interesting calls and comments made last week in Treasuries, monetary policy, economics, stocks, bonds & commodities. TACs is our acronym for Tweets, Articles, & Clips –our basic inputs for this article.
Editor’s Note: In this series of articles, we include important or interesting Tweets, Articles, Video Clips with our comments. This is an article that expresses our personal opinions about comments made on Television, Tweeter, and in Print. It is NOT intended to provide any investment advice of any type whatsoever. No one should base any investing decisions or conclusions based on anything written in or inferred from this article. Macro Viewpoints & its affiliates expressly disclaim all liability in respect to actions taken based on any or all of the information in this article. Investing is a serious matter and all investment decisions should only be taken after a detailed discussion with your investment advisor and should be subject to your objectives, suitability requirements and risk tolerance.
1. Ripping.
That’s the only word David Rosenberg could use to describe the stunning NFP number of 295,000 jobs. This number was expected to disappoint with the awful February weather, Thursday’s sharp rise in jobless claims and the rise in layoffs reported by Challenger. And Dr. Greenspan had described the economic data as “not strong” last week and characterized the economy as lacking “effective demand” & beset with weak productivity. No wonder, the 295,000 number stunned the markets. Almost everyone was caught offsides – U.S. Dollar shot up, Euro cratered, Gold fell by $32 and rates shot up. The chase for yield stopped and people ran away from yield.
And Friday’s action was very different than what we saw in 2013.
2. Steepening vs. Flattening
The inexorable trend of 2014 was flattening of the Treasury curve, a trend that continued into February 2015. But this Friday was decidedly different. Recall the stunning 321,000 NFP number on December 5, 2014. The yield curve flattened like a pancake that day with the 30-yr yield up only 1.1 bps but 3-year & 5-year yields spiking up by 12 & 9.4 bps resp. That was consistent with what we saw all through 2014 – strong data or hawkish statements from Chair Yellen caused the curve to flatten. It was as if the treasury market was warning that raising rates could be a big mistake.
But this Friday was different. The entire curve rose in yield with the 10-30 year sector rising a bit more than the 3-5 year sector. The bond market was saying that perhaps the economy is on the right track and the Fed could be falling behind. That means the Fed may have to tighten more for longer. That terrified markets which had been lulled into complacency by the “lower for longer” mantra. Naturally, U.S. stocks got hammered with Utilities down 3% and Gold was taken to the woodshed.
3. It’s all about the Fed.
Make no mistake. This action has little to do with the 295K number and has everything to do with what it could mean for the Fed. Compare this Friday to the huge 288,000 payroll number on Friday, May 2, 2014. It had very little impact because the taper was on and there was no chance of the Fed tightening any time soon.
This Friday’s number caused such damage because it suddenly created the prospect of a longer for higher tightening campaign. Think back to May 22, 2013 when Chairman Bernanke first dropped the taper bomb. Two weeks later, on June 7, 2013, the payroll number came in at 175K, about 10K higher than the consensus. That solidified the taper fears and the yield curve bear-steepened by rising 9 bps to 8 bps. To us, that is what this Friday seemed like.
The real action took place one month later on Friday, July 5, 2013 with the 195,000 NFP number. The 30-year yield shot up by 20 bps, the 10-year yield by 22.4 bps and the 5-year yield by 18 bps. That July 2013 number was what crystallized taper fears in the treasury market. We know what happened for the rest of the year.
That leads us to wonder what will happen in April if the next payroll number comes in stronger than expected? Will that finally render the Fed totally irrelevant? The markets could be in for a stormy ride if they feel what Chair Yellen says doesn’t matter because sooner or later the Fed will have to tighten hard. If the markets begin thinking that way, they could raise rates faster and much higher than where the Fed wants go. And we could be back in the 2013 scenario where the bond market ran so far ahead of Bernanke that rates fell when Bernanke actually began the taper. Last year, the Treasury curve bull-flattened regardless of what the Fed said or did. Could it bear-steepen in 2015 regardless of what Chair Yellen says or does?
At least, we now know that global relative value or dollar strength were only secondary or supporting factors for the Treasury rally in 2014 and the first 6 weeks of 2015. Those factors are still operative today with the UST-Bund 10-year spread at 25-year highs. But Treasuries have sold off very hard showing that the Treasury market cares only for the Fed-U.S. Economy duo.
4. Oversold Markets?
The US 10-year yield has risen by 55 bps in just 30 days with 25 bps of that coming just this week. TLT, the long Treasury ETF, is down 11% & the Zero-coupon ETF, EDV, is down 15% in the past 30 days. This is a severely oversold market. This makes next week very interesting. A severely oversold market that does not bounce is sending a very nasty signal.
In contrast, S&P 500 is merely down 2.5% from its high. Will this be a case of a market that goes down the least bounces the fastest & most or will it follow the rest of the asset classes lower? Art Cashin spoke on Friday of “palpable fear” among CEOs about sales lost because of the strength in the U.S. Dollar. No wonder Stanley Druckenmiller spoke of feeling better about investments in Europe and Japan. Most now assume the Euro goes to parity with the U.S. Dollar. Some point lower:
- Holger Zschaepitz @Schuldensuehner-10yr Treasury/Bund spread at 186bp, highest on record, suggests #Euro to drop to 85 US cent.
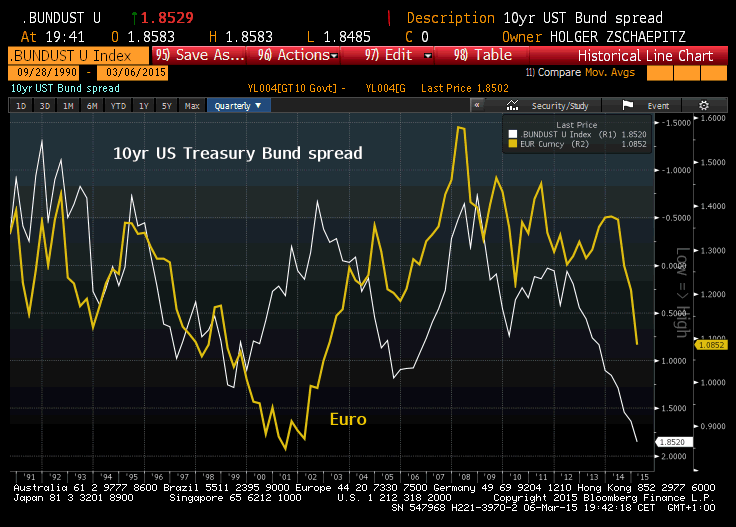
Where would you rather be? In an market where the Central Bank is talking & walking QE & where the currency has already fallen 30% and about to fall another 10-20% Or in a stock market where the Central Bank could be raising rates faster for longer and where valuations seem full with downward earning revisions? Obvious? Then consider the similar question – in which bond market would you put your money – one with high yields & a rising currency or one with negative yields & falling currency? So far, the verdict seems to be the non-logical latter.
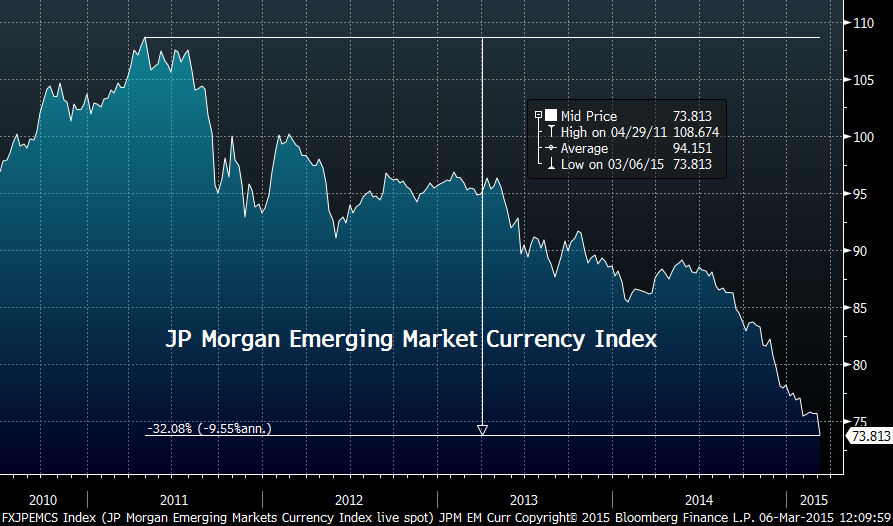
And what about Emerging markets, you ask:
- Charlie Bilello, CMT @MktOutperform – JP Morgan Emerging Market Currency Index at new lows, down 32% from 2011 peak…
Speaking of severely oversold markets, GLD is down 11% from its February high and the gold miner ETFs GDX & GDXJ are down 19% & 22% resp. Do these have any chance of bouncing without a correction in the U.S. Dollar? On that topic, Andy Nyquist (@andrewnyquist) wrote on Friday, “… I do see a Euro bounce coming soon …”. because an ugly daily chart looks different on a monthly basis? 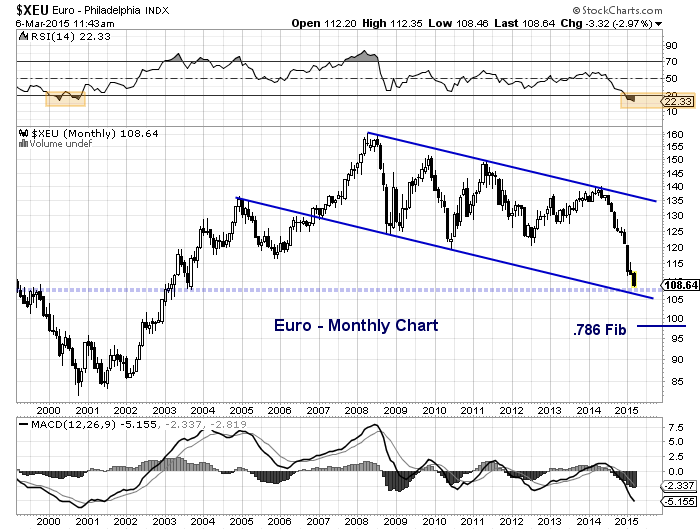
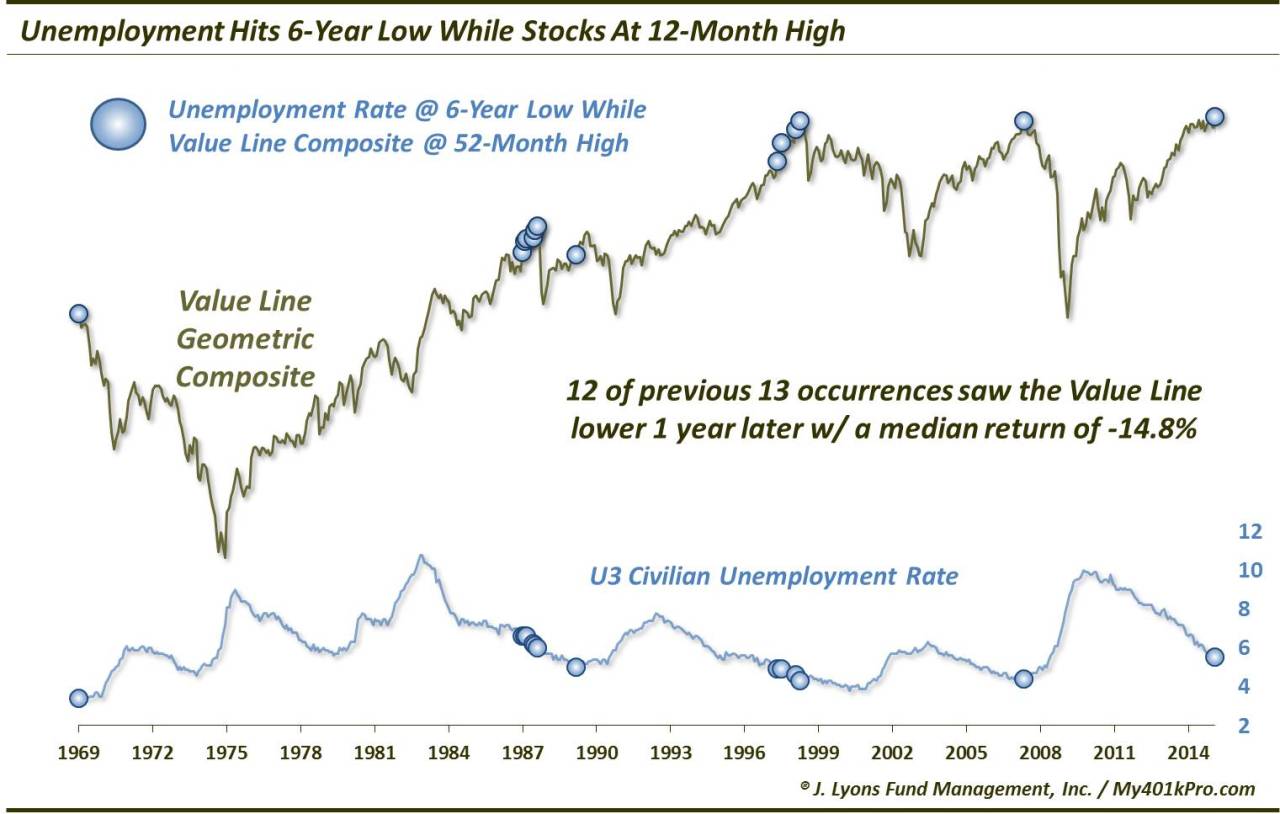
5. Statistical precedent
In a “just saying” sort of way, Dana Lyons of J. Lyons Fund Management wrote on Friday:
- “Since 1969, when the U.S. U3 unemployment rate has hit a 6-year low while the stock market (as measured by the broad, equally-weighted Value Line Geometric Composite) is at a 12-month high, the market has been lower 1 year later 12 out of 13 times by a median -14.8%.” .
- Chad Gassaway, CMT @WildcatTrader – Since 2014 the SPX closed down greater than -1% when the prior close was within 1% of an ATH, 7 of 9 had a lower close over following week.
6. Mark Cuban
Mr. Cuban is probably the ideal individual to speak about the 2000 tech bubble. He took Broadcast.com public and sold it to Yahoo. Many have done similar things. But Mr. Cuban sold all his Yahoo stock near the top. Since them he has been successful in almost everything he has touched including Dallas Mavericks. So when he speaks about a potential bubble, we listen. Unless you were on a sabbatical, you heard his call about a worse bubble in non-public tech valuations. Of course, he was ridiculed by people who are deeply invested in the trade financially or verbally. Below is a chart that seems to suggest what Cuban said this week.
- Holger Zschaepitz @Schuldensuehner – Mark Cuban warns the tech bubble is worse than dotcom bubble: There’s no liquidity. http://cnb.cx/1Nm64LN .
Speaking of the 2000 era, below is a chart that would speak volumes if it repeats.
- Larry Kudlow retweeted Mark J. Perry @Mark_J_Perry CHART: Payroll Gain Over the Last 12 Months Through Feb. (+3.3M) is Largest Annual US Job Gain Since 2000
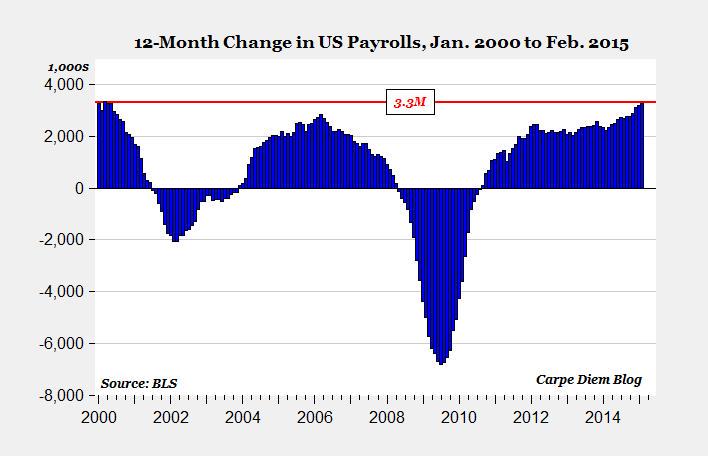
What if the above chart repeats and next couple of months job gains turn out to be a peak especially if the peak occurs due to Fed tightening? There is no question in our mind that Chair Yellen is acutely aware of this possibility. Also there is no question in our mind that Chair Yellen will have no choice if the bond market runs way ahead of her & forces her to tighten just as it forced Greenspan to tighten more in 2000 that he wanted to. That is why we are so worried about what the bond market did on Friday. Hopefully, next week treasuries will rally in price, yield will fall and all will be right in the ibvesting world. But we are not sanguine that is the way to bet.
7. Interesting Laws.
To end on a lighter note, below are a couple of interesting laws from our esteemed lawmakers:
- It is against the law to “frown” at a police officer. (New Jersey)
- It is illegal for a woman to call a man for a date. (Dyersburg, Tennessee)
- It’s illegal for a woman to drive a car up Main Street unless her husband is walking in front of the car waving a red flag. (Waynesboro, VA)
Send your feedback to editor@macroviewpoints.com OR @MacroViewpoints on Twitter.