Summary – A top-down review of interesting calls and comments made last week in Treasuries, monetary policy, economics, stocks, bonds & commodities. TACs is our acronym for Tweets, Articles, & Clips –our basic inputs for this article.
Editor’s Note: In this series of articles, we include important or interesting Tweets, Articles, Video Clips with our comments. This is an article that expresses our personal opinions about comments made on Television, Tweeter, and in Print. It is NOT intended to provide any investment advice of any type whatsoever. No one should base any investing decisions or conclusions based on anything written in or inferred from this article. Macro Viewpoints & its affiliates expressly disclaim all liability in respect to actions taken based on any or all of the information in this article. Investing is a serious matter and all investment decisions should only be taken after a detailed discussion with your investment advisor and should be subject to your objectives, suitability requirements and risk tolerance.
1. Sam Zell vs. Fed
Last week, Sam Zell said on CNBC Squawk Box- “There’s a significant and growing disparity between the stock market and the economy“. This week NY Fed chief Dudley essentially took the side of the markets and pronounced the Fed as market-dependent rather than data-dependent. Dudley merely stated as fact what all of us have suspected for awhile – the Fed will shirk from tightening if the markets react adversely to it. This simply stated simple reality trumped all the concerns & warnings from luminaries like Julian Robertson, Larry Fink and Mohammed El-Erian. US stocks went up 1.7%-2%, Dollar was up 1.9%, Gold went up, Oil went up 5%. The only asset class that sold off was long end of Treasury curve.
Isn’t this what happened during the QE phase? Meaning stimulus will remain in markets, enough stimulus to make risk attractive again? What is a sure sign of excess stimulus? Negative real yields, right?
- Monday – David Schawel @DavidSchawel – 5 yr real yield getting more and more negative

Another sign of excess stimulus is steepening of the yield curve, right?
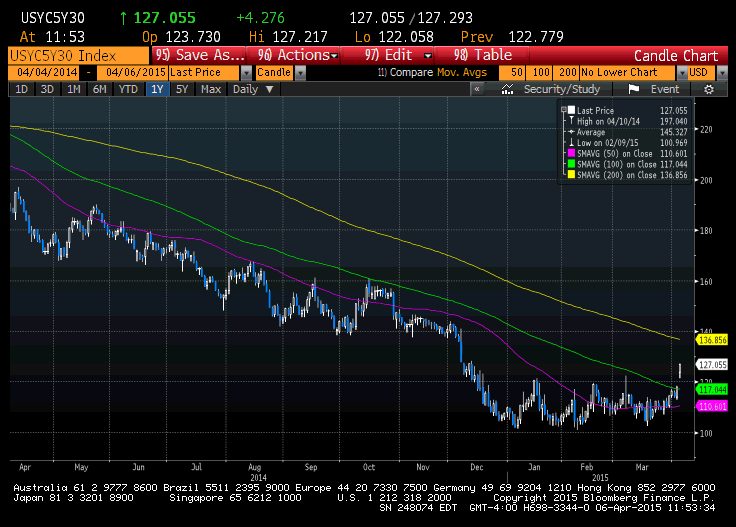
- Monday – Mark Dow @mark_dow – Here’s 5s30s. Kind of a big deal
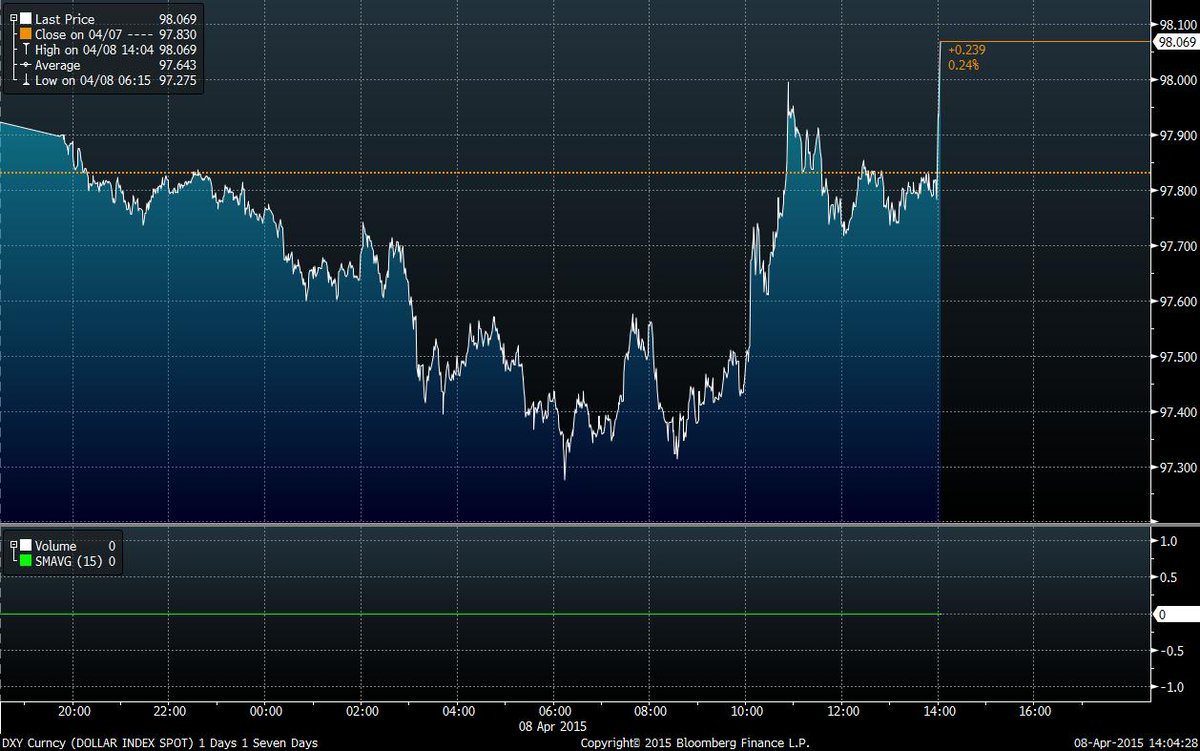
Two days later came the Fed minutes. They seem to tell a slightly more hawkish tone.
- Wed – Bloomberg Markets @markets – The dollar is jumping after the Fed minutes. http://www.bloomberg.com/news/articles/2015-04-08/fed-officials-were-divided-over-june-liftoff-fomc-minutes-show …
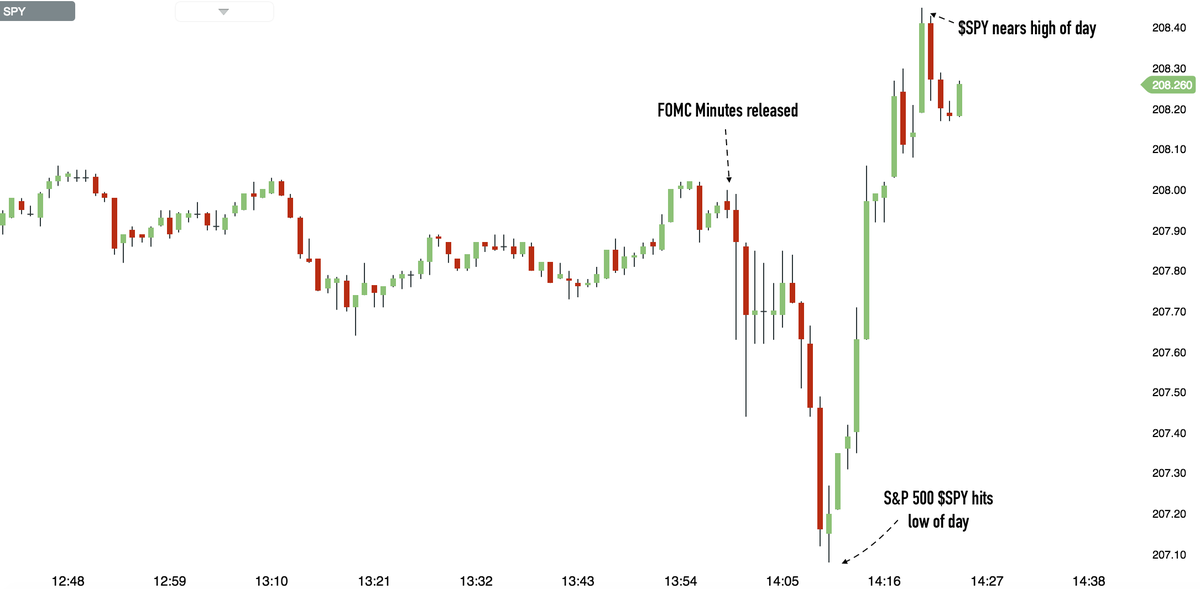
The stock market couldn’t figure the newish tone and then it did.
- Wed – StockTwits @StockTwits – It’s always amazing to see how the market reacts to the Fed. Look how the $SPY is trading now http://stks.co/r1owx
The 30-5 year yield spread flattened to 118 bps, the low for the week, a steep drop from 126 bps on Monday. But the US stock market rallied to close positive on Wednesday, Thursday & Friday taking the Dow above 18,000 and about 500 points higher than Friday’s implied close of down 200 pts. This was summed up well in:
- Friday –Urban Carmel @ukarlewitz – SPY 60’ RSI(5) = 90. Atlanta in summer hot
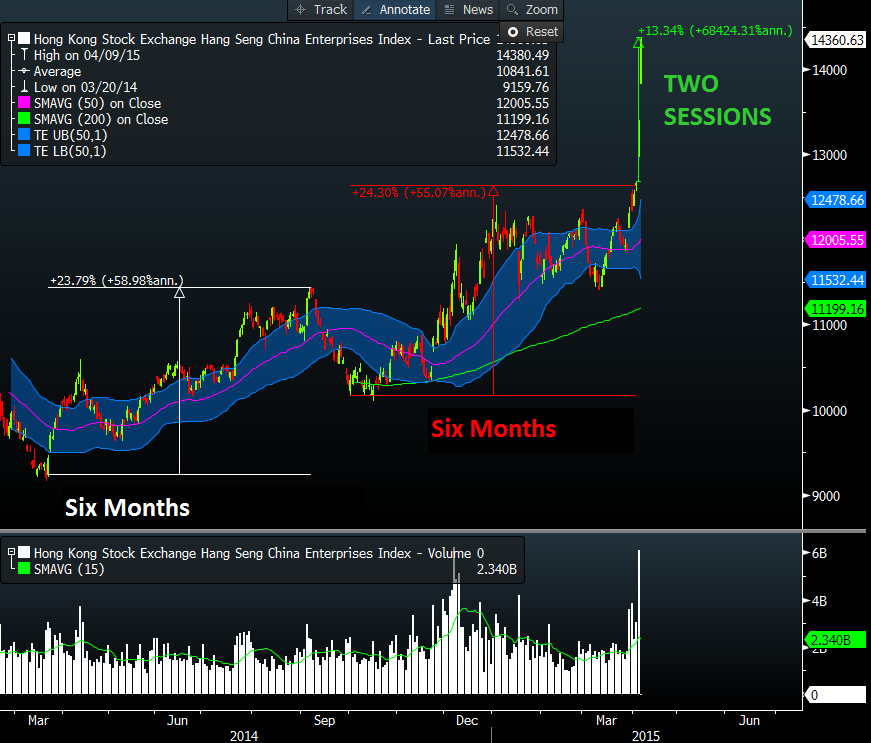
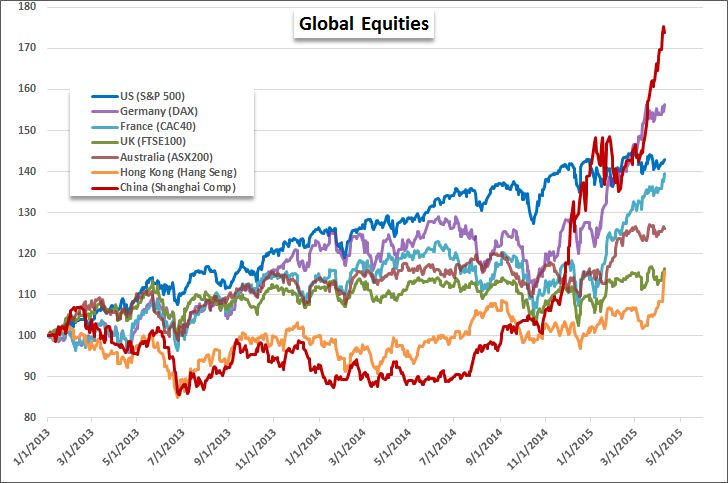
If the S&P 500 is Atlanta hot, how would you describe the Chinese stock market – Sonora hot, Sahara hot or Mars hot?
- Friday – StockTwits @StockTwits – Okay, this chart from @bespokeinvest is INSANE. Must-see. The stock market in China http://stks.co/q1pTR $FXI $EWH
How do the above two compare? See http://stks.co/h26hm $FXI $SSEC
And Sam Zell is worried about the economy, Larry Fink about the US Dollar and El-Erian about Fed-stimulated conditions!
2. Bonds
What happens when there is excess stimulus & hope about the economy being good enough? Treasury yields rise and risk assets go up, right? That seems to be the message of the markets, at least the Treasury market this week. Yields rose sharply across the curve this week from the low levels of payroll Friday – 30-yr up by 10 bps, 10-yr up 11 bps, 5-yr up by 14 bps, 3-yr up by 13 bps & 2-yr up by 8 bps. The action in the short end suggests a tightening by the Fed but the behavior of risk markets suggests a small amount of total tightening. The good old QE days were marked by Treasury prices falling and Stocks, Gold and even Oil going up. That was this week. And the charts spoke to one technician:
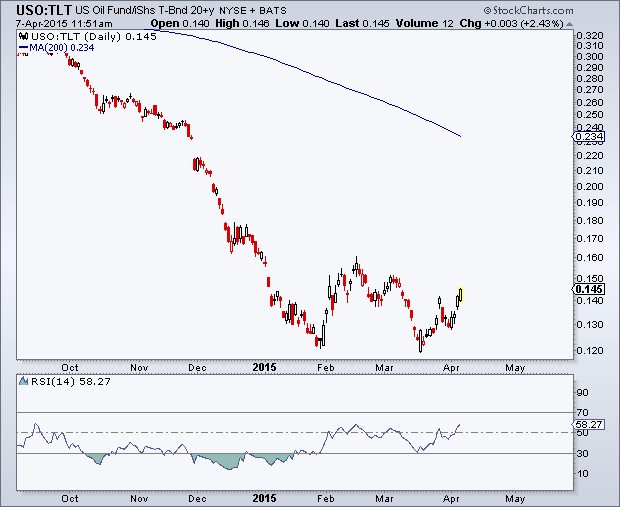
- Tuesday – J.C. Parets @allstarcharts – here’s what a Long Crude Oil / Short Treasury Bonds pair looks like. Bullish Daily RSI Divergence for mean reversion
Parets kept on Short Treasuries theme all week:
- Tuesday – J.C. Parets @allstarcharts – yea I said. It. I’ve loved bonds since late 2013. But tactically I think they’re a short here $TLT $ZB_F
- Tuesday – J.C. Parets @allstarcharts – I like this US Treasury Bond short here with the 10yr finding a bottom at the October lows $TNX $TLT
- Friday – J.C. Parets @allstarcharts – and listen, my big picture outlook for bonds and rates has not changed, but that doesn’t mean I can’t short bonds for a 10yr move to 2.2%
- Friday – J.C. Parets @allstarcharts – I’m telling you guys, I really like this US Treasury Bond short. Nasty fade today. Would love to see them go out at or near lows $TLT $ZB_F
He wasn’t the only one to suggest higher yields:
- Thursday – Rachel Shasha @Sassy_SPY – Perhaps we finally get that “great rotation” out of bonds that everyone talked about for years. $TLT
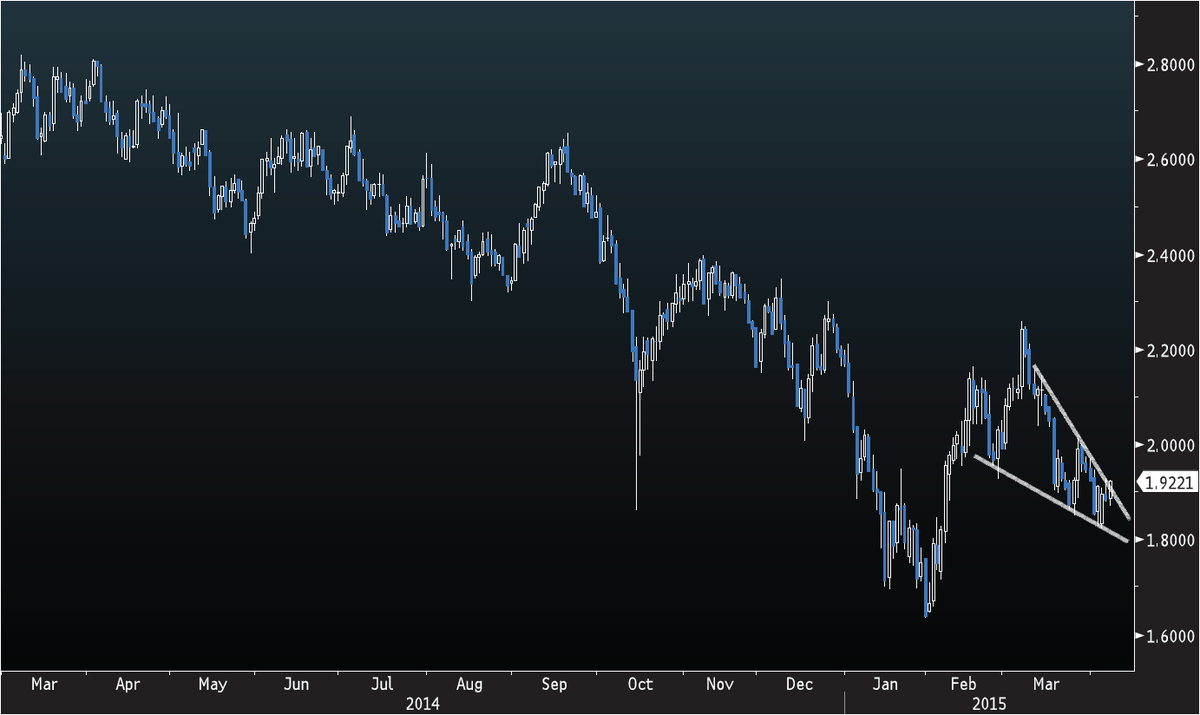
- Wednesday – Antony Filippo @Vconomics – 10-year Treasury (yield) signalling it wants to go higher.
And on a more historical comp basis:
- Monday – Ed Bradford @Fullcarry – Long bond 1998 analog. Yellow is current yields
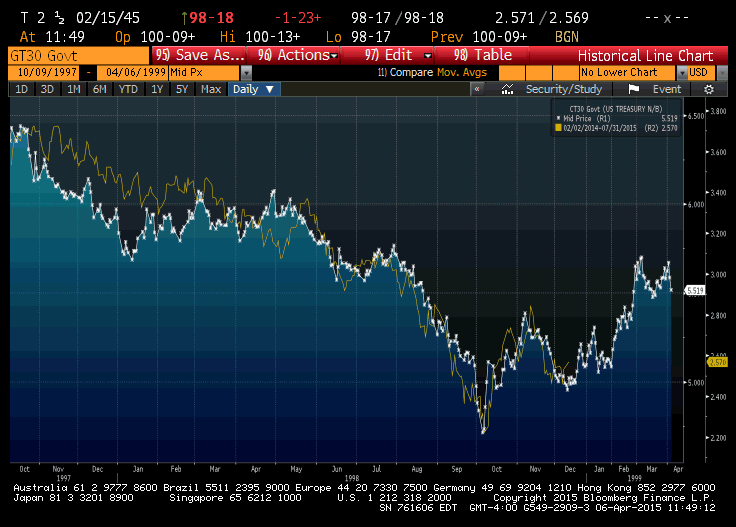
We recall that treasury yields reversed suddenly after a big drop on October 1998 and went straight up afterwards. But that was because they sensed the Greenspan liquidity injection coming in November 1998.
May be the above is over-thinking and perhaps the selling in Treasuries has something to do with the warnings about the lack of liquidity from Jamie Dimon and the negative comments by Jeff Gundlach. Or may be the steep rally in Treasury prices on payroll Good Friday was recognized as a local maximum and sold hard this week.
If Treasuries are not be liked, then what about Corporate Bonds? Bonnie Baha, Gundlach’s colleague who manages $73 billion for him, didn’t mince any words this week:
- “In my 30-year career, it’s one of the most unattractive risk-return propositions that I’ve seen,”
The Bloomberg article that quoted Bonnie Baha also quoted a couple of other managers:
- “Credit as a whole looks more compelling than other asset classes right now, … The risks here are longer-term.”
- “Investors take what is given to them, it’s shoved down their throat and they smile and take it because there is nowhere else to get yield.”
Clearly interest rate risk is a big one if Treasuries sell off hard. But the above quotes remind us of 2007. And in 2007, interest rate risk didn’t kill corporate bonds, bust of the credit bubble did. And the Fed did not tighten policy in 2007 but tried vainly to add liquidity to prevent credit collapse. But nothing on the horizon suggests any risks to the economy, right?
3. Stocks
- 3.1 Relative
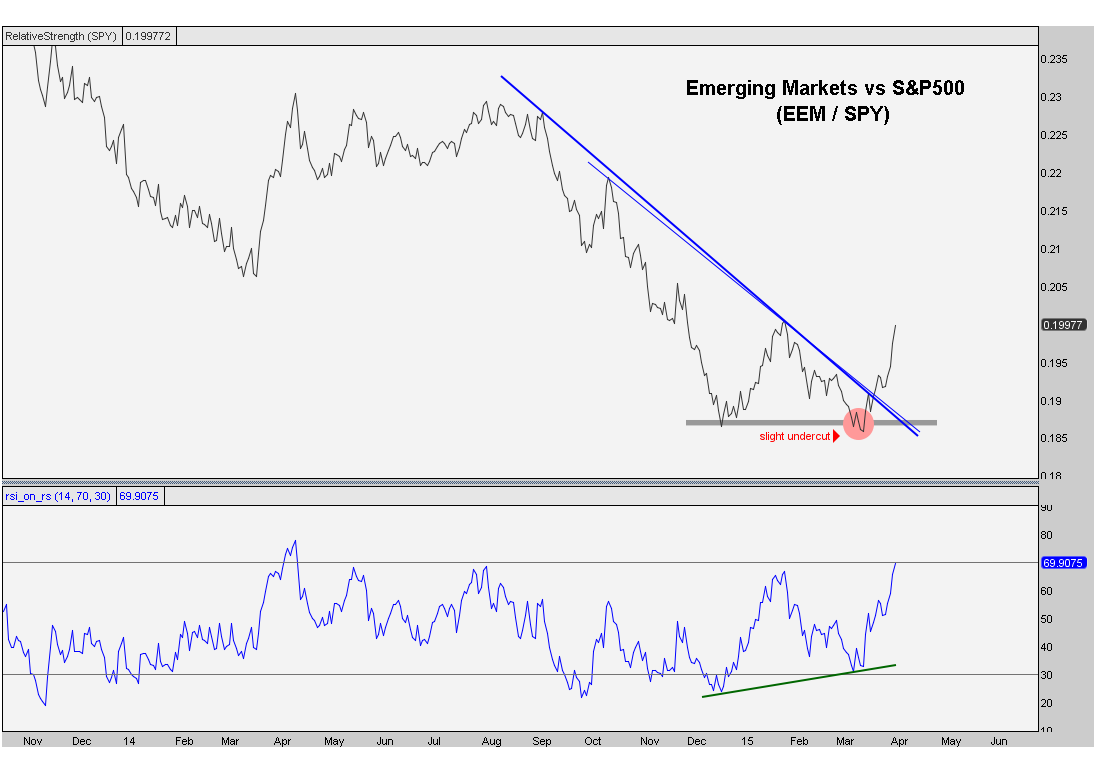
What outperformed during QE days? Emerging Markets & Energy, right? This week, EEM rallied by 3.9%, XLE by 3.2% and OIH by 6% compared to S&P rally of 1.7%. Once again, recommendations of J.C. Parets coincide with what used to work during QE days. The chart below is from his article on Monday that says I like energy & Emerging Markets for Q2.
- 3.2 Absolute
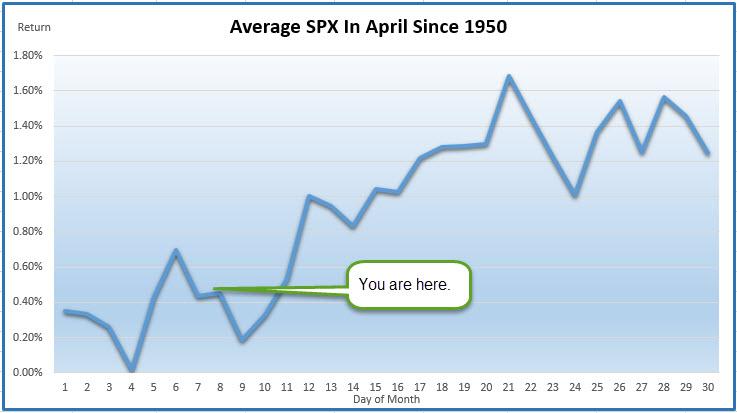
Last week, we featured tweets & charts that spoke of the importance of April. This week, we found a straight call about what lies ahead:
- Tuesday – Ryan Detrick, CMT @RyanDetrick – Historically, April bottoms soon and rallies hard the next two weeks. $SPX $SPY
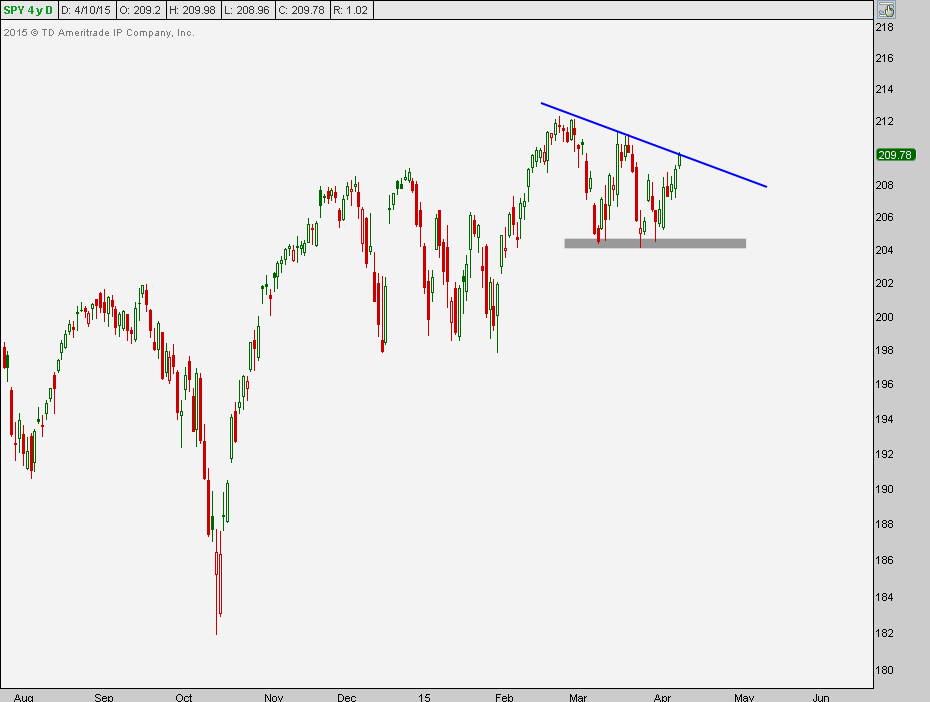
- Friday – J.C. Parets @allstarcharts – a breakout above this descending triangle in $SPY should lead to an explosive rally. This is what I’m watching:
Last week, we featured a tweet from @Mella_TA that gave 2250 as target for S&P. That is sort of the level Lawrence McMillan comes to if his indicator manages to reach his level.
- We have very well-defined criteria for determining a major Total put-call ratio buy signal. These are powerful signals, worth a 100-point rise or more in $SPX. There have been twenty such signals since the year 2000, of which 11 have produced the desired 100-point gain, and three others produced smaller gains. The total $SPX points gained from the twenty signals is +960. So, these signals are not to be taken lightly.
- What happened this week was that the Total put-call ratio came within a whisker of an official buy signal. The question is, “Can we count this as a buy signal anyway, or must we stay with the strict definition?”…
3.3 Resistance?
One man has been right in staying long both last week and this week. What did he say on Friday?
- Friday – Cousin_Vinny @Couzin_Vinny – $SPY my mindset now is – taking profits into this pop atleast partials. End the day on positive note. And create a great weekend 4 yourself
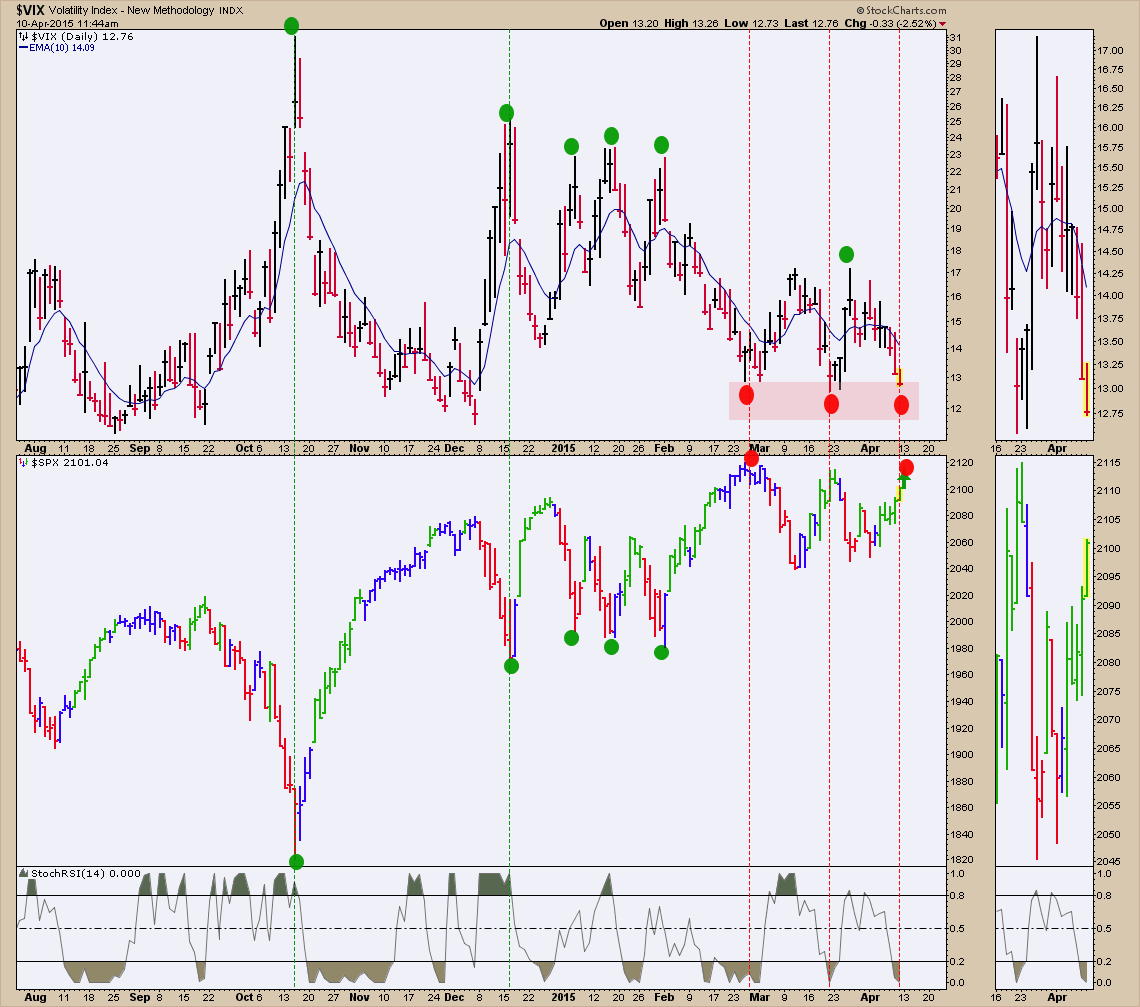
- Friday – Cousin_Vinny @Couzin_Vinny – $VIX entering the red zone. FWIW
For a more detailed treatment, see the discussion & charts in his article Are We Near a Top? He is not alone in the resistance school:
- Friday – J.C. Parets @allstarcharts $VIX with a 12 handle and S&P500 & Russell2000 right under overhead supply, taking some profits here from the past week is probably smart
- Friday – Urban Carmel @ukarlewitz – SPY – set up now and next week: at pt where it has liked reverse the past 4 months; RSI almost O/B, BB bands tight, Vix:Vxv near 0.8
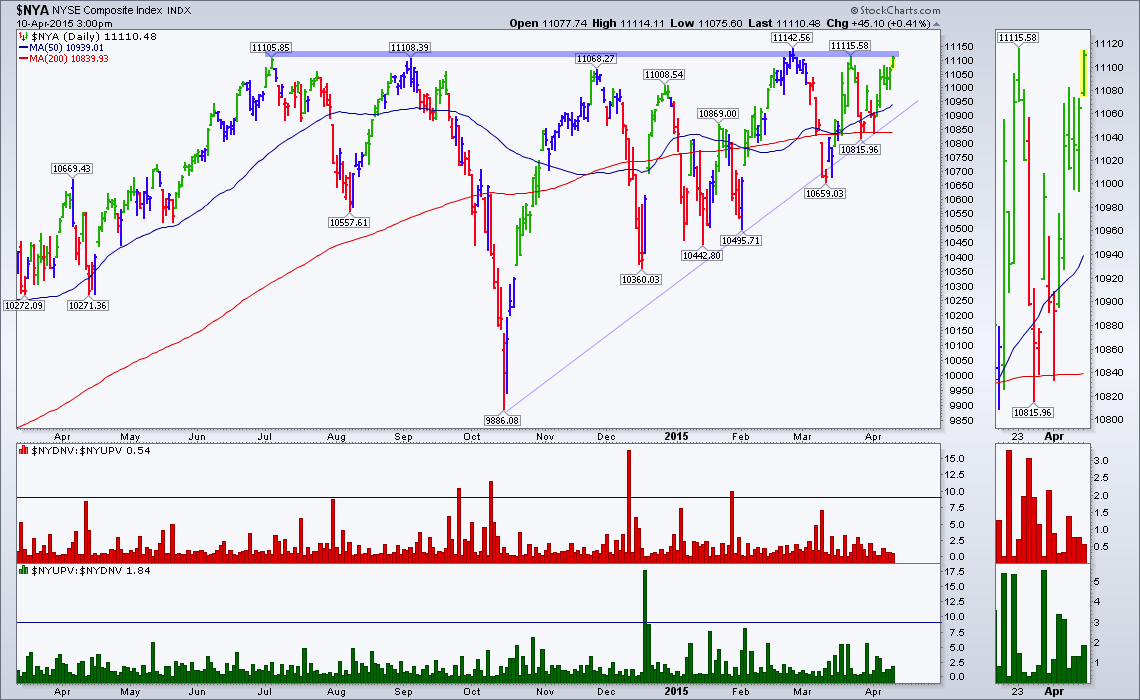
- Friday StockTwits @StockTwits – The NYSE Composite is hitting some BIG resistance right now -> http://stks.co/q1pqG $NYA
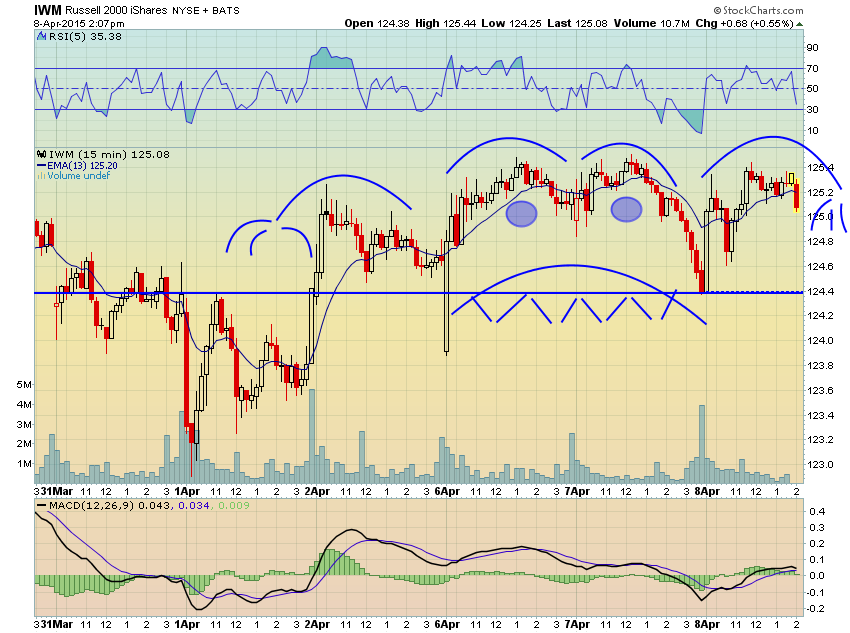
- Thursday – StockTwits @StockTwits – THE 2-HEADED MONSTER PATTERN First spotted by @jessefelder yesterday. $IWM -> http://stks.co/i26Dm
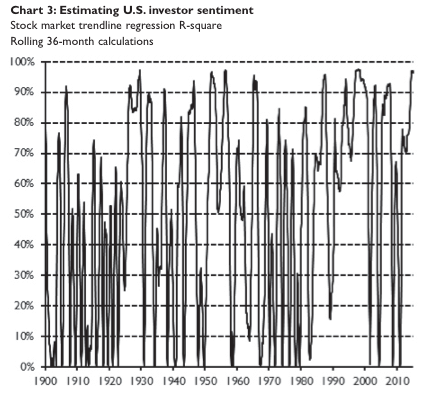
- Monday – Sam Ro @bySamRo – it’s pretty clear what’s happening here, via Wells Capital
4. Oil
What is the adage about volatility? That it is highest near bottoms & tops? Look how USO & BNO behaved this week – Up 4.95% & 4.49% on Monday; Up 3.425 & 2% on Tuesday; Down 5.19% & 4.66% on FedMinutes Wednesday; Down 22bps & Up 1% on Thursday; Up 2.11% & up 2% on Friday – the end result – both up 5% for the week. The oil stock ETFs, OIH & XLE were up 6% and 3.2%. So what is it? A bottom, top or neither?
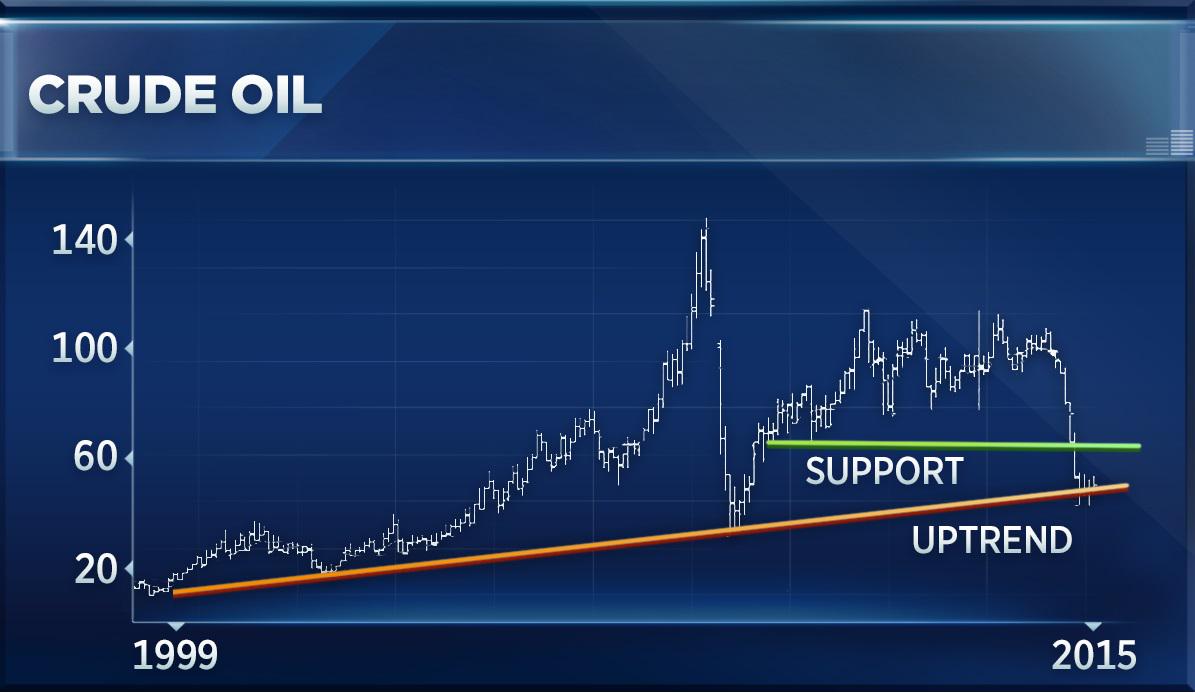
- Louise Yamada on Thursday CNBC Futures Now – oil has been establishing plateaus, consolidations over the past couple of months,this plateau for crude has been between 42 & 54; it stopped right at 1999-2000 uptrend [see chart below]; same place it stopped at 2008-2009; so there is a possibility that you get some kind of contra-trend move; remember the greater the decline, the longer the need for repair;we could get some kind of a rally; it can move up to 54, you could get towards 60, may be 68 resistance, but if it breaks below 42, then chances are 2008 levels of 38-36;primary force is down but that doesnt mean you cant get interim kickback rally; question of which of these levels get violated.
No such doubts in:
- Richard Ross of Evercore ISI on CNBC Trading Nation – we are bullish on crude oil, underlying and also bullish on oil stocks, more specifically on oil service stocks; we believe a breakout in WTI above that 100-day mv at $54 is imminent; we see $65 this summer; now in terms of oil service stocks, OSX had a very important breakout today – above that 100-day mv for the first time since last July; that generated a very strong buy signal; we think there could be another 15-20-25% upisde in those OSX names
- John Dowd of Fidelity on CNBC FM 1/2 – I am constructive on oil prices; the bear case is built on rapid inventory builds & high inventory levels;but story of the past year when we saw a lot of non-OPEN production and sluggish inventory demand seem to be reversing; we have seen rig count in US cut virtually in half; there is no incremental investment going on putting new rigs to work internationally; I think we are going to see supply growth in non-OPEC slow significantly & the demand has actually been fairly good; looks like it is recovering
On the other hand, Jeff Currie of Goldman Sachs has a $39 target for August but 2016 targets WTI = $65; BRENT = $70 :
- but $40 target on WTI basis between now & end of Q3- what we have seen is a shift in sentiment; people have seen the light at the end of the tunnel & improvment in Q2; but commodities are spot assets; they cannot anticipate what can happen in second half of this year; what is going to happen is instead of a crude oil surplus; you are going to see product surplus; as crude ramps up in US, products are going to go internationally; that combined with Russian priducing at highest levels of post-soviet era; Iraq is at all time high in production; 40s os where we expect prices to be because it is creating the correction we need;$4o is what created financial stress, stress in the highyield market – $39 is our forecast for August;
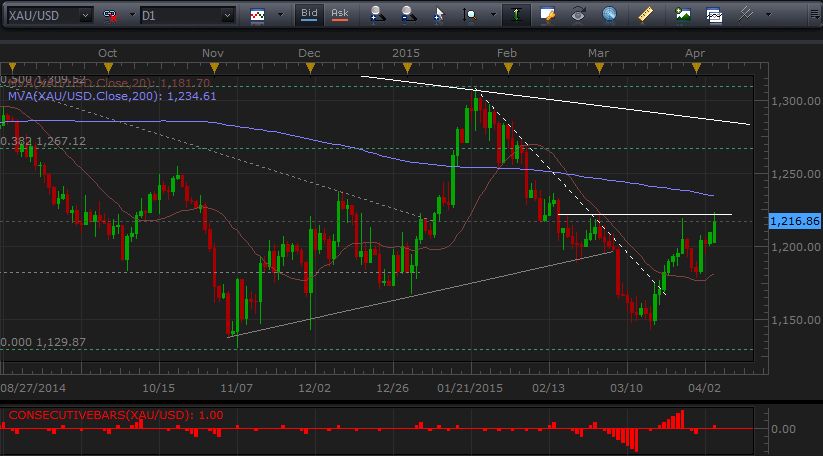
5. Gold
The Dollar index was up 1.9% this week. Despite the Dollar’s rally, Gold was up 49 bps and GDX, GDXJ were up 2.5% & 2.6% resp.
- Monday – John Kicklighter @JohnKicklighter – Is that an inverse head-and-shoulders formation on Gold? Seems to fit the criteria with $1,220 neckline
Send your feedback to editor@macroviewpoints.com Or @MacroViewpoints on Twitter