Summary – A top-down review of interesting calls and comments made last week in Treasuries, monetary policy, economics, stocks, bonds & commodities. TAC is our acronym for Tweets, Articles, & Clips – our basic inputs for this article.
Editor’s Note: In this series of articles, we include important or interesting Tweets, Articles, Video Clips with our comments. This is an article that expresses our personal opinions about comments made on Television, Tweeter, and in Print. It is NOT intended to provide any investment advice of any type whatsoever. No one should base any investing decisions or conclusions based on anything written in or inferred from this article. Macro Viewpoints & its affiliates expressly disclaim all liability in respect to actions taken based on any or all of the information in this article. Investing is a serious matter and all investment decisions should only be taken after a detailed discussion with your investment advisor and should be subject to your objectives, suitability requirements and risk tolerance.
1.Financial Conditions vs. Real Economy Contd.
Last week’s discussion focused on ISM vs. Markit PMI & was triggered by the following tweet by David Rosenberg:
- David Rosenberg@EconguyRosie – The Conference Board LEI is now negative YoY without the hand-holding of the liquidity/momentum-driven stock market. Big disconnect between the financial economy and the (1% growth) real economy.
We got some clarity this week. First the Nirvaan state in Consumer Confidence & Financial measures:
- SentimenTrader@sentimentrader – – “The Bloomberg Consumer Comfort Index..ask[s] Americans to rate the economy, the buying climate and their personal finances as excellent, good, not so good, or poor.” Consumers haven’t been this fat and happy since October 2000.
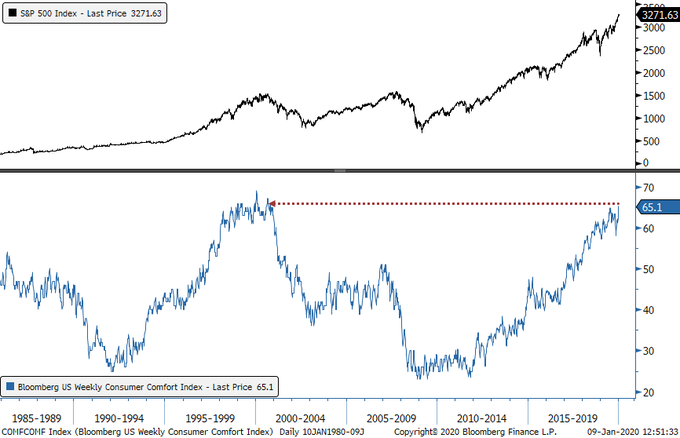
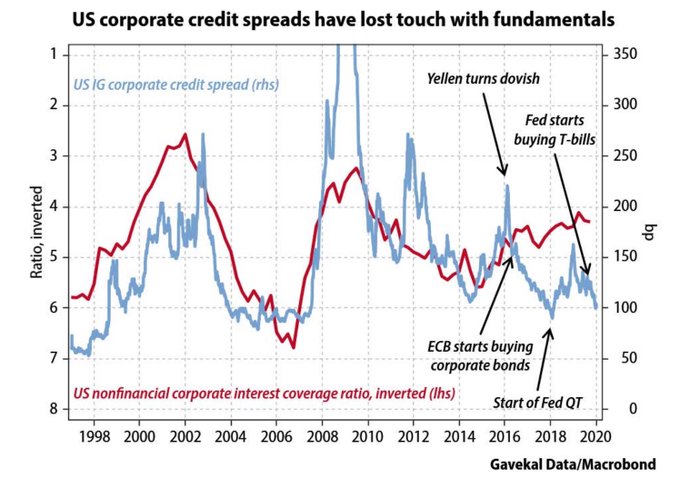
Let us put aside the “October 2000” mention for now and ask if there is a message in high yield spreads?
- Holger Zschaepitz@Schuldensuehner – Another reason why central banks cannot return to monetary normality: US corp credit spreads have lost touch w/fundamentals BUT this excessive narrowing of credit spreads compared w/interest coverage ratios poses no imminent threat as long as liquidity remains plentiful, GK says.
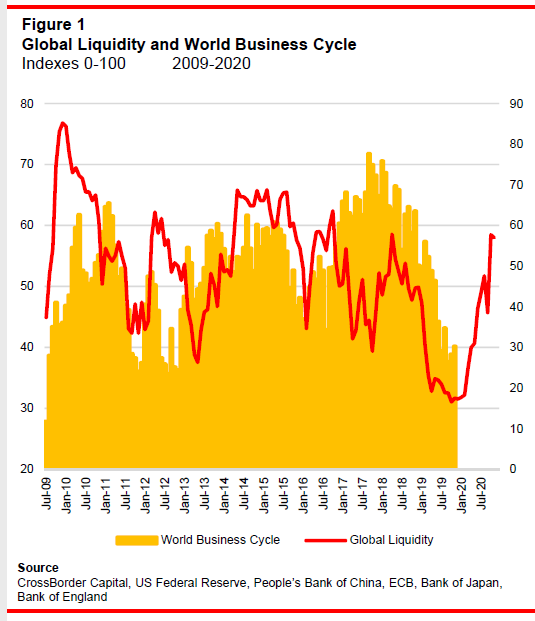
OK but what about the business cycle?
- Holger Zschaepitz@Schuldensuehner – The good news: Global liquidity has just surged upwards over last few mths. We can expect business activity to follow. The bad news in terms of Minsky cycle is that we have conditions for speculation to run riot — but we are still early in the cycle. bloomberg.com/opinion/articl
Yeah but isn’t the above restricted to the people who, as they tell us, have the money to buy stocks? What about the people who drove the November 2016 election, the people who may not even have completed high school?
- Jim Bianco@biancoresearch – Record low unemployment for those without a high school diploma (orange).
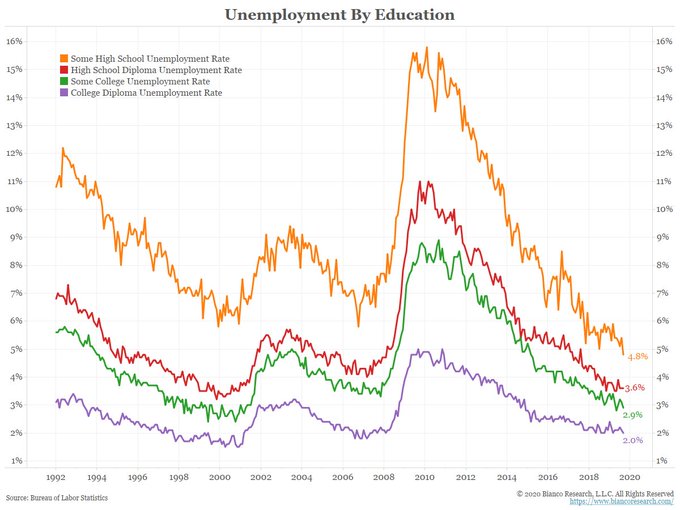
So this is true Nirvaan, right? Not exactly.
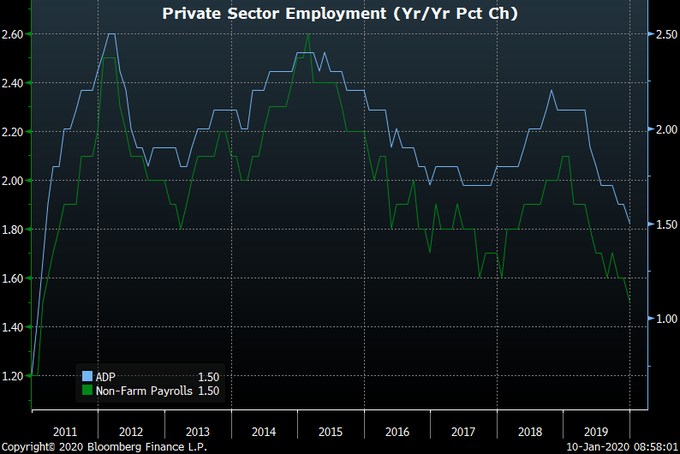
- Richard Bernstein@RBAdvisors – Today’s #employment report confirms @ADP ’s data. Private sector #jobs growth showing WEAKEST growth since the recovery.
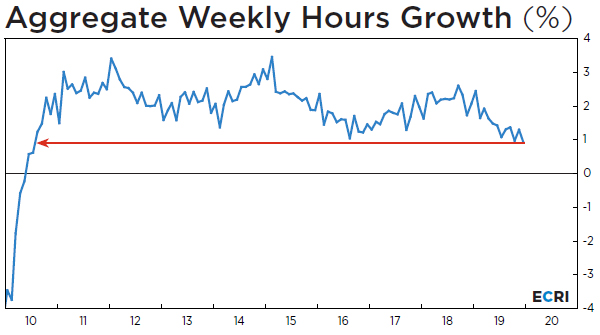
Not just jobs added but, even more seriously, aggregate weekly hours worked are also slowing.
- Lakshman Achuthan@businesscycle – Growth in total hours worked has slowed to its weakest reading since 2010. This is consistent with ECRI’s 2018 slowdown call. #Jobs
The above slowdowns are worrisome but there is a fast contraction that is likely to have a greater impact:
- DoubleLine Capital@DLineCap – Continuing on the inflation theme, @EconguyRosie believes that: “The big story in inflation is velocity is contracting right now at an alarming rate in the last few months.”
And that folks could well be the key to ignore the “October 2000” mention in the tweet above by @SentimentTrader. Because in October 2000, the Greenspan Fed was on a determined mission to kill the tech-telecom bubble.
In stark contrast, the Powell Fed is totally committed to make this slowdown a mid-cycle pause. That commitment will, unless the real economy begins to catch up the financial economy, force the Fed to cut rates (to 1% or just below 1%) & transform his Not QE to real or acknowledged QE. And on top of that, we believe Chairman Powell will support the idea of cutting the payroll tax deduction to increase take home pay in 2020 & stimulate spending.
That to us will again be the Executive Branch & the Central Bank working hand in hand and that is never a negative for the stock market.
2. Treasury Rates
Rates along the entire Treasury curve rose the first three days of this past week & kept rising on Thursday morning as well. Then came a strong 30-year Treasury auction at 1 pm on Thursday. And rates dropped on Thursday afternoon. Then came the weaker than expected 145,000 NFP report with even weaker internals. That continued the fall in Treasury yields into Friday’s close.
Despite the fall in yields on Thursday & Friday, yields along the entire Treasury curve rose on the week by 3-4 bps.
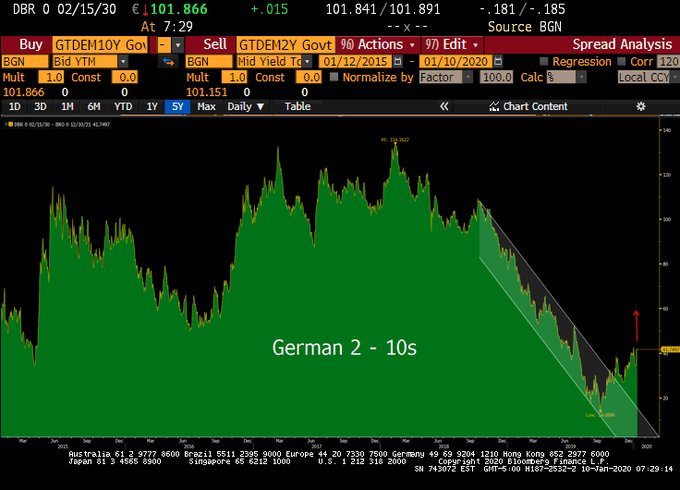
- Lawrence McDonald@Convertbond – If you’re a US bond investor and focused on backward-looking economic data, you’re missing the elephant in the room, global yields have been driving the bus for much of the last 36 months…
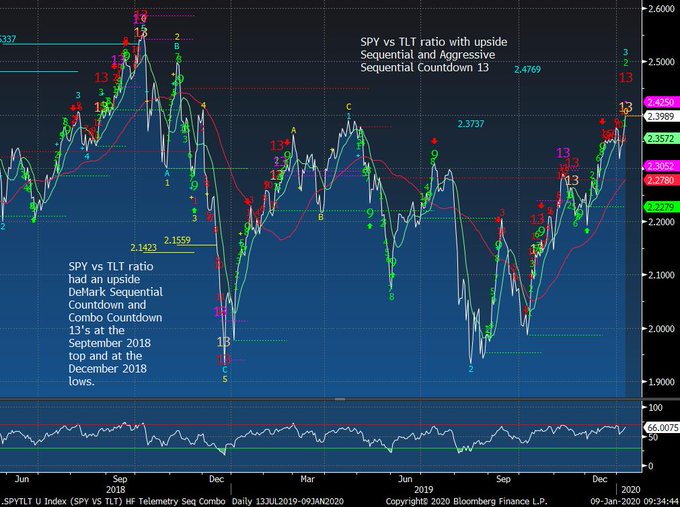
But there is one indicator that might suggest a near term fall in Treasury rates:
- Thomas Thornton@TommyThornton – – $SPY vs $TLT ratio with new DeMark Sequential sell Countdown 13
3. Stocks
Just add Iran-Soelimani to the trident of uncertainty of Q4 2019. It also got resolved the way Brexit & Phase 1 deal got resolved in December. With a “no big deal” realization & a rally in stocks. But this one was even more spectacular with almost a 700 point move in the Dow from Tuesday evening to Wednesday’s close. How unique was that? Totally says the tweet below:
- SentimenTrader@sentimentrader – – S&P 500 futures hit a 10-day low and a 52-week high in the same session today. The last time that happened was…never. Way to do your thing, dip-buyers.
Last week we got the Santa Claus rally. This week we got the up first 5 days of January indicator. Now we need to see an up January. But do we? Or do we have an even better indicator for the year?
- Ryan Detrick, CMT@RyanDetrick – – The first 5 days of the year and the S&P 500 is up >1% YTD. Will see if we close here, but since 1950, the full year has been higher 90% of the time and up 18.6% on average (total return) when this happens.
Then you have a ratio indicator:
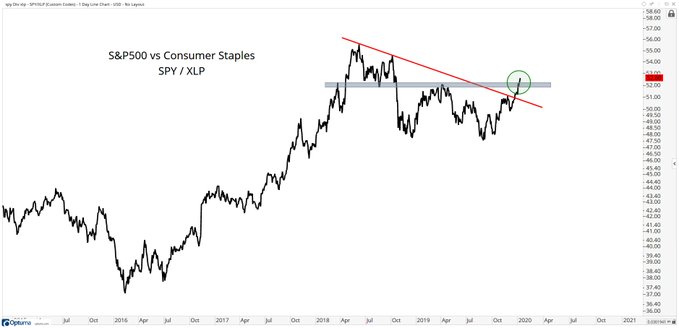
Being simple-minded, we prefer another chart from his article:
He writes,
- “Well here we are today and Consumer Staples are making new 52-week lows relative to the S&P500. What does this mean for the overall stock market? I think it means we’re going a lot higher!”
Warum?
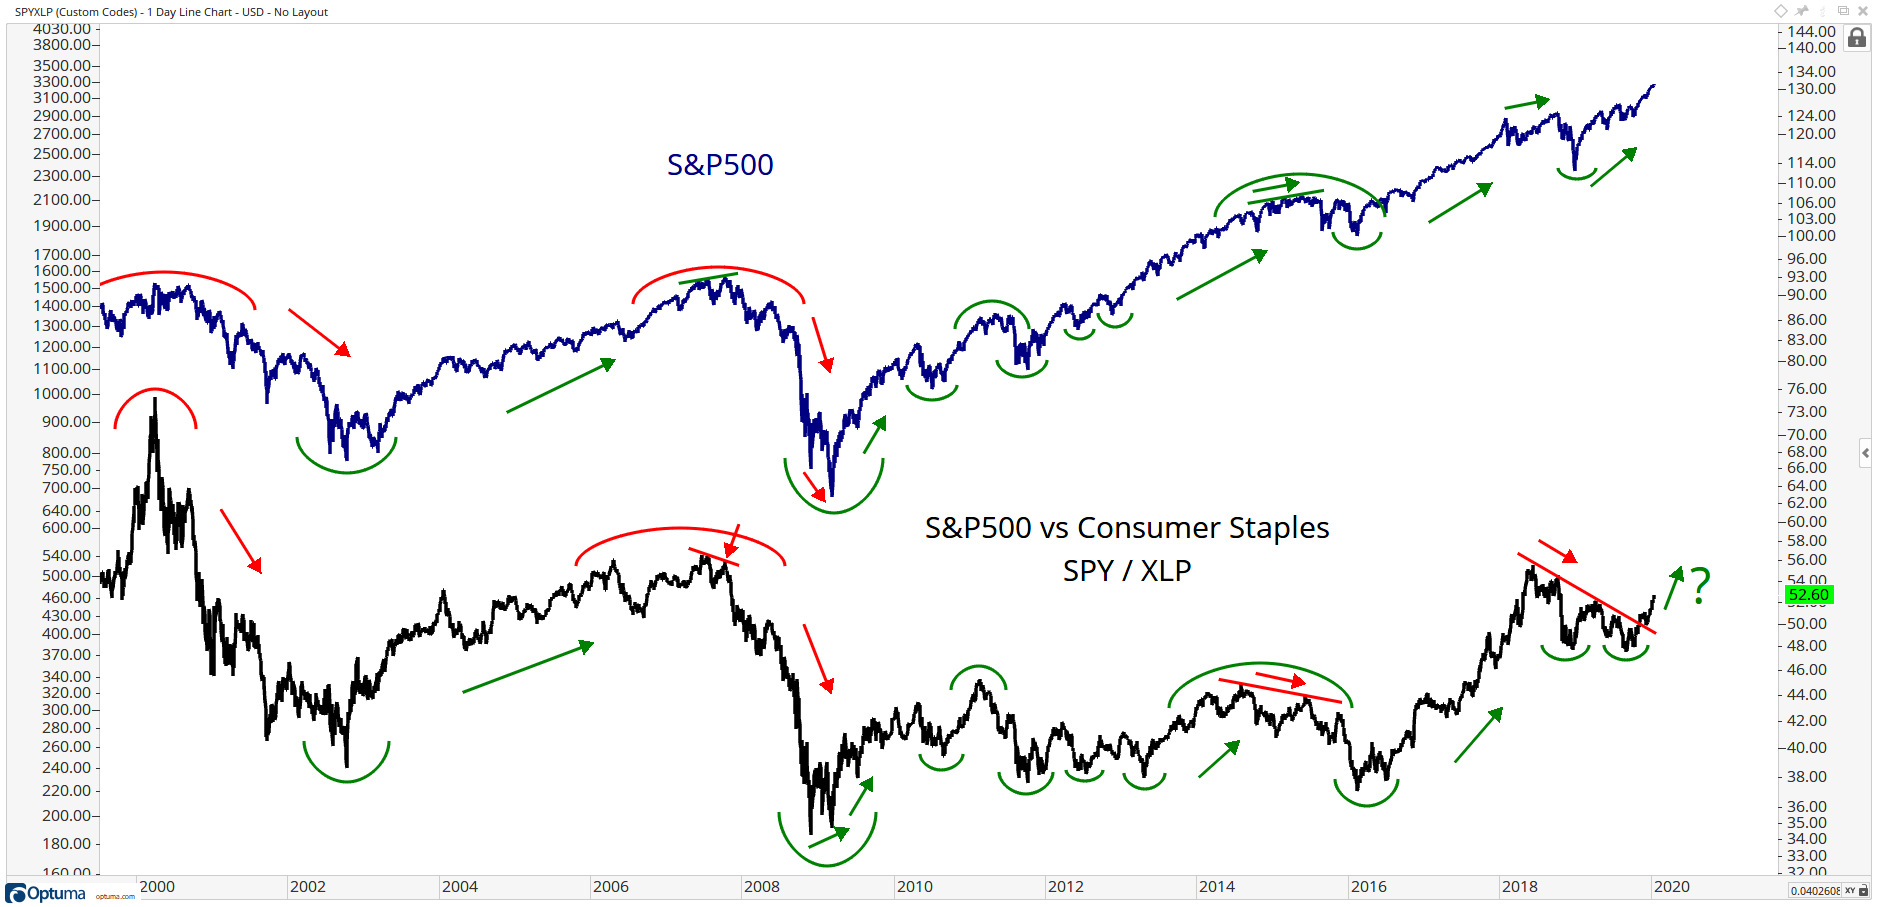
- “As the black line goes up, that means Consumer Staples are underperforming. When the black line is falling, Staples are outperforming. You’ll notice how at the 2007 stock market high, the 2015 high and the 2018 high all included divergences between Staples relative strength and the S&P500. The inability for Staples to make new lows on a relative basis in 2018 (new high in this chart) was one of the reasons we were so bearish throughout the 4th quarter that year. You can also see how at the historic lows in 2009, the black line was already making a higher low. That was evidence that staples were already underperforming, which is consistent with higher stock prices, not lower ones.”
But what is “a lot higher”? J.C. did not say. No problem. Katie Stockton gave us her 3475 number for the S&P:
But there is no doubt the S&P is really up there. Jim Cramer said on Friday evening that viewers should take some off & that he has been taking some off every day this week. Tony Dwyer came on Fast Money on Wednesday evening & said he only sees a 5% upside but a 5-10% pullback. In that context, we rely on what has worked so far:
- Lawrence McMillan of Option Strategist – In summary, the indicators are all bullish once again. We thus remain bullish, along with our indicators. However, the extreme nature of the overbought signals is some cause for concern, but we would not take bearish positions without confirmed sell signals.
And one smart guru sees a down move coming next week:
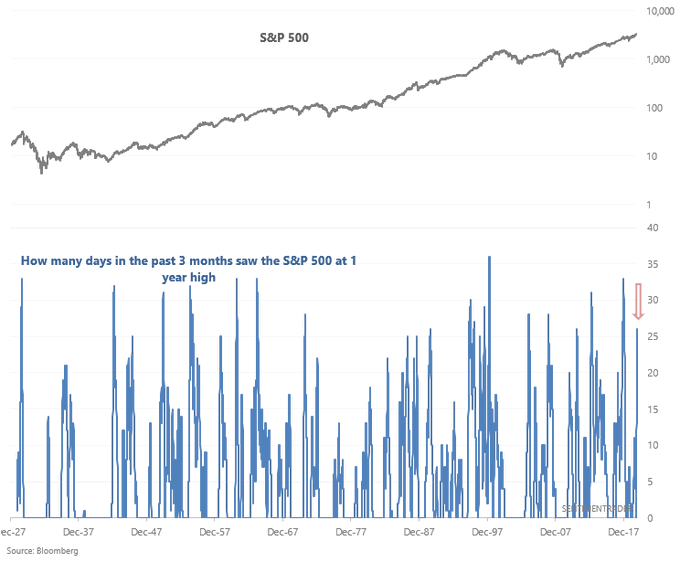
- SentimenTrader@sentimentrader – The recent $SPX rally has been relentless. The past 3 months have seen 26 days in which $SPX was at a 1 year high (daily HIGH prices) Over the past 15 years, this ALWAYS led to a pullback in $SPX over the next week
4. Dollar, Gold & Oil
The U.S. Dollar rallied this week despite all the prognostications about its demise. And actually one turned in its favor:

But despite the 50 bps rally in the Dollar this week, emerging markets outperformed & even Gold slightly outperformed the S&P. Gold, Bitcoin & Oil are among Gundlach’s conviction trades for 2020 along with Dollar weakness:
And those who like macro might want to spend an hour listening to the new & far better Round Table for 2020, the Double Line Roundtable:
Send your feedback to editor@macroviewpoints.com Or @MacroViewpoints on Twitter