Summary – A top-down review of interesting calls and comments made last week in Treasuries, monetary policy, economics, stocks, bonds & commodities. TAC is our acronym for Tweets, Articles, & Clips – our basic inputs for this article.
Editor’s Note: In this series of articles, we include important or interesting Tweets, Articles, Video Clips with our comments. This is an article that expresses our personal opinions about comments made on Television, Tweeter, and in Print. It is NOT intended to provide any investment advice of any type whatsoever. No one should base any investing decisions or conclusions based on anything written in or inferred from this article. Macro Viewpoints & its affiliates expressly disclaim all liability in respect to actions taken based on any or all of the information in this article. Investing is a serious matter and all investment decisions should only be taken after a detailed discussion with your investment advisor and should be subject to your objectives, suitability requirements and risk tolerance.
1. Is it as simple as this?
By “it”, we mean the biggest variable today:
- Jim Bianco@biancoresearch – Another argument is the virus spreads indoors. Feb/Apr, everyone in the northern climates is inside (N. US, Europe) cases surged. Jun/Jul, southern climates are very hot, and everyone is inside, cases are surging. Not a perfect explanation, but better than red/blue state BS
We think the astute Mr. Bianco may have something here. The flip side is that Northern US might see a surge of cases again from Nov-Dec to April 2021. We may have a treatment that reduces deaths but we still don’t have a vaccine.
On the other hand, if economic data keeps improving as it did this week, then would a surge in Northern USA be as awful & matter as much for economy & markets as the surge in March 2020?
2. The dog that didn’t bark?
We are delighted to see that Fed Chair Powell woke up from what we had described last week as his “siesta” and acted as the market whisperer to the Congress. Remember our favorite indicator of Fed’s liquidity getting assimilated? HYG & JNK, the unleveraged high yield ETFs rallied by about 90 bps on the week but the leveraged closed-end fund DPG exploded up by 7.3%.
And yes, stocks did great as well with Dow up 3.2%, SPX up 4%, Russell 2000 up 3% and Transports up 4.9%. And yes, the NDX was up 5% to a new all-time high. Gold & Gold miners were up. Oil was up. And even Mosaic, the Ag stock, was up 7.5%.
And why shouldn’t they be up? The data was just awesome.
- Charlie Bilello@charliebilello – Jul 1 – ISM Manufacturing moves up to 52.6 from 43.1 last month. 52.6 is highest reading since April 2019. +9.5 monthly increase is largest since August 1980.
If that was not enough, the NonFarm payroll number blew people away with 4.8 million jobs added vs. 3 million expected and the unemployment rate fell to 11.1% vs. 12.3% expected.
There are smart guys & there are big guys (used obviously in a gender-neutral sense consistent with 31 recognized genders in NYC). But just a few are both. What did one of them say about the NFP number?
- Rick Rieder@RickRieder – While the #JobsReport data during the #pandemic has shown itself to be highly unpredictable and #volatile, the remarkable gain of 4.8 million #jobs in June is a heartening development.
And,
- Rick Rieder@RickRieder – Finally, the stimulus and resulting impact on household #incomes are much, much more predictable, and in fact have had an incredibly positive influence on the #economy…
Does this mean there is more cash in consumer pockets?
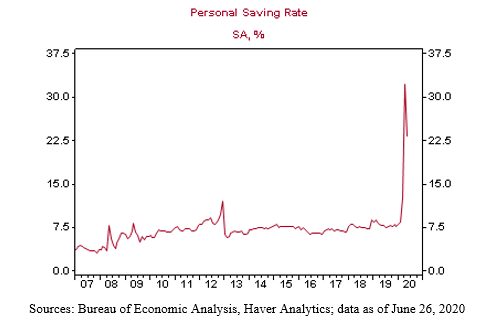
- Rick Rieder@RickRieder – Zero #interest rates, massive asset purchases by the @federalreserve and more than $2 trillion of #fiscal stimulus has supported an extremely high personal #saving rate, which will be critical in supporting households as the recovery unfolds.
That brings up an important question – why didn’t the dog bark? Remember that the 2-5 year Treasury curve closed at new all-time low yields on Friday, June 26. So with the terrific manufacturing & employment data this week and realization of Fed’s liquidity into credit, Treasury yields should have rallied hard, right?
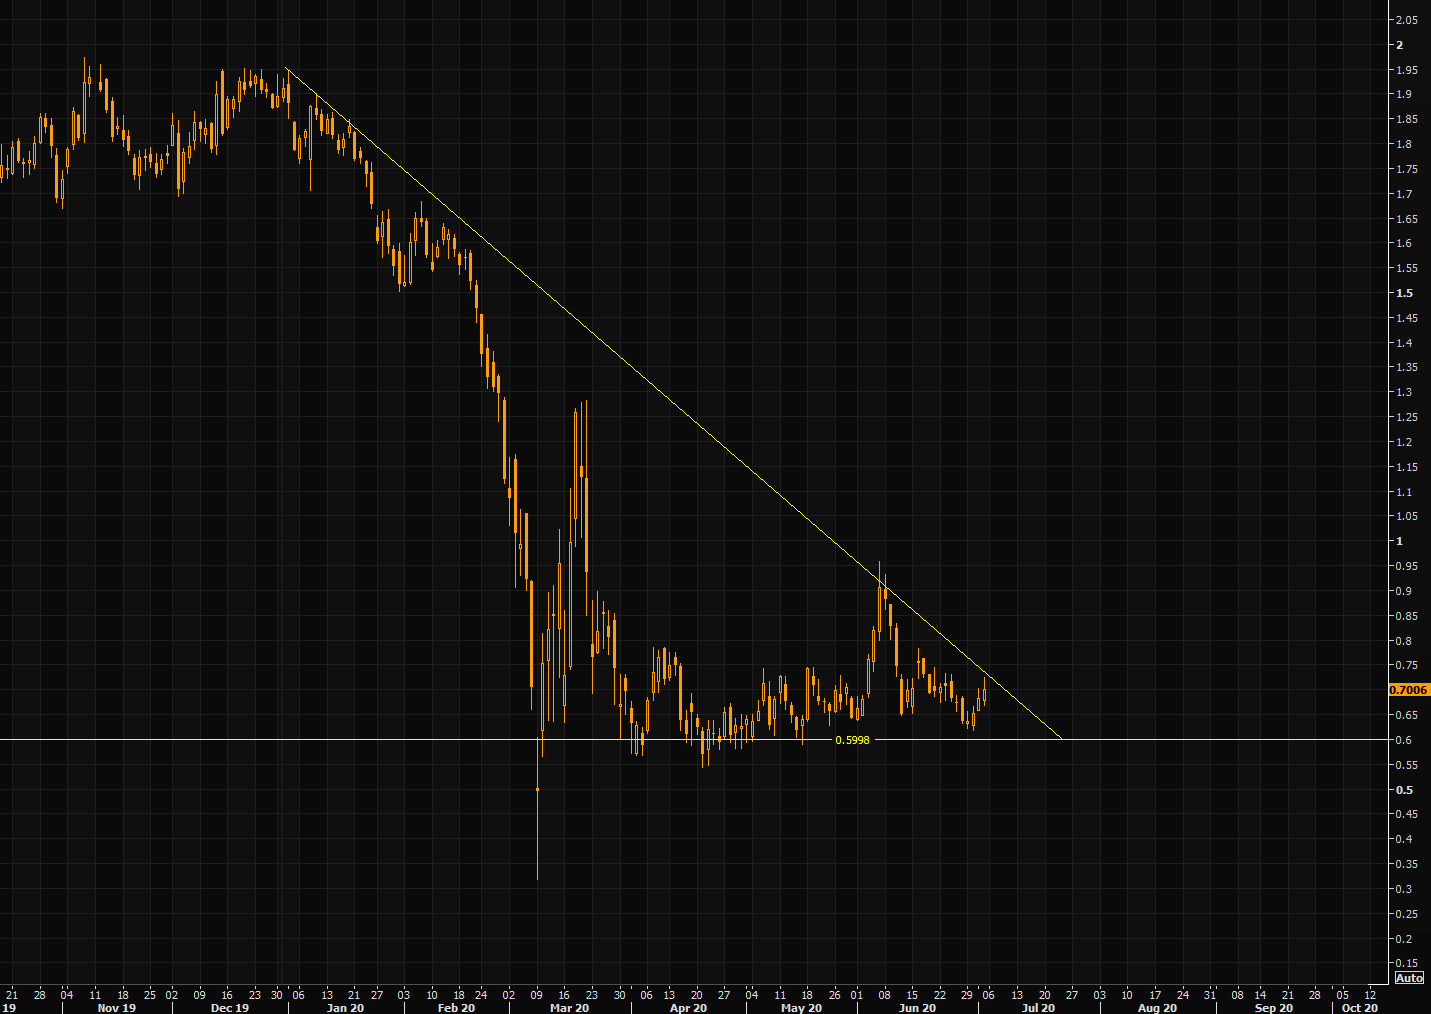
They didn’t. Actually the 2-5 year curve closed lower in yield this Thursday with 2-year at 15.5 bps down 1.5 bps on the week; 3-year at 18.1 bps down a bit & 5-year at 29.4 bps down a fraction. Yes, the 30-year yield closed up 5.6 bps but the 10-year remains trapped between “the negative trend line and the mighty 0.6% level” to quote The Market Ear: What’s going on? Fears of the D-word?
3. Spike or Fall
This seems to be the big big issue according to smart guys in the stock market.
Kudos to @Sentimentrader for a prescient tweet last Friday:
- SentimenTrader@sentimentrader – June 26– – Panic in the air. Inverse ETFs like QID and SH are seeing a jump in volume, accounting for more than 1.5% of total volume. That has been a pretty much perfect sign of a short-term pessimistic extreme, except for that nasty bit in late Feb – early Mar.
Those who bought last Friday or even on Monday did very well. This week Marko Kolanovic of JPMorgan raised his year-end target to 3,400 and his overshoot target is now 3600-3700.
- “… one big driver of our view is positioning in equities; positioning is very low; it is 26% across discretionary hedge funds; it is much lower in Quants; even CTAs are between 5-10%; signals are positive but what’s holding back investors is high level of realized volatility; … say VIX goes into mid-20s & may be by end of the summer into low 20s, then you can pull in few hundred billion dollars in equities …”
Watch the clip below:
Ok, but does Nomura concur? Via Market Ear:
-
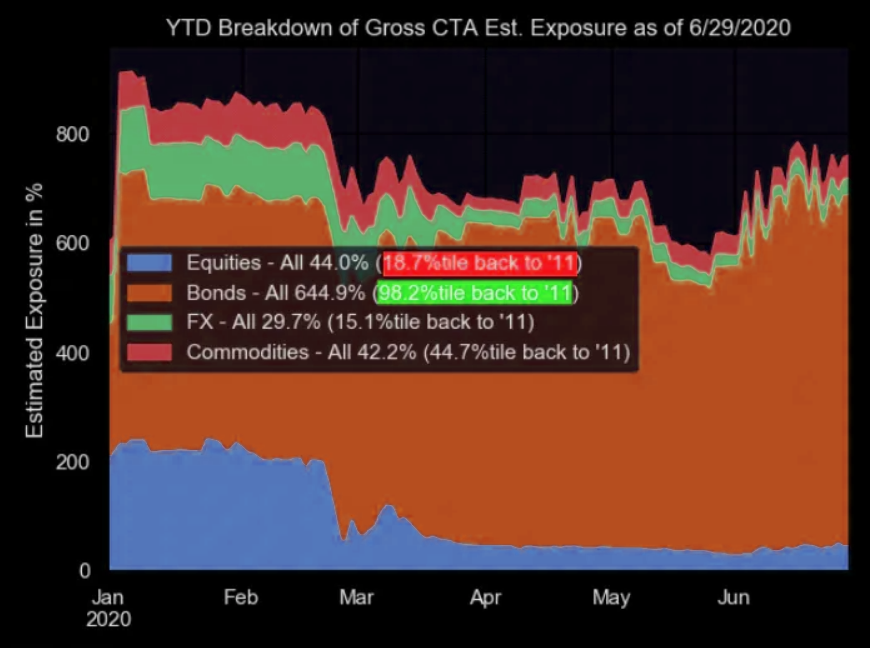
- “The Nomura QIS CTA model shows just earlier this week that the “Bonds” exposure is 98th %ile since 2011 (and predominately “long”), while “Equities” are just 18th %ile (and predominately “short”)—ripe for some unwind, some of which we’ve obviously already begun to feel in markets this week, with Spooz now+166 handles from lows, UST 10Y yields +8bps cheaper and UX1 down 7vols!”
What level should be watched on the S&P? The levels for BAML’s Michael Hartnett are reportedly 3250 & 2950. What about Lawrence McMillan of Option Strategist ?
- “In the short-term, though, another $VIX “spike peak” buy signal was generated as of June 29th, and it’s been off to a strong start. In fact, almost every time that the market has had one of those strong down days or two, another $VIX spike peak buy signal has been generated and most have been good buying points. In summary, the market has alleviated some of the overbought conditions that existed in early June, but not all. It remains in a trading range, and until there is a breakout above 3184 or below 2920, the “trading range” status will be in effect.”
Remember the terrific call by Caroline Boroden as relayed by Jim Cramer on May 19, 2020?
- “If the S&P breaks out above the 200-day moving average, then the first target would be 3,720. But if the S&P 500 is unable to break out above its 200-day, then 2,766 would be the first downside target.”
- “The picture for NDX, Nasdaq 100, looks better given that NDX has broken above its 50-day & 200-day moving averages. So it only has to remain above last week’s low of 8860. Then the first upside target would be 9,660.”
She was absolutely right about the NDX which closed at 10,342, a new high this week, well above her 9660 target. She was also correct about the importance of the 200-day moving average for S&P. Breaking above that did lead to a big rally in the S&P.
So what is she saying now? As Jim Cramer reported,
- ” … at this point, the Nasdaq 100 is giving you an almost picture perfect chart … its got a bullish pattern of higher highs & higher lows; its price keeps holding above the recent lows; most important, every time this thing pulls back, Boroden points out, it has been similar in price & duration to last selloffs since the bottom in March; … these corrections last for 1-2 days and as long as this pattern holds, she could see the Nasdaq 100 rally another 200-400 points; .. Boroden wouldn’t be surprised if we saw 11,568 ; that’s the next stop roughly 1200 points from here …”But Boroden is not as sanguine about the S&P 500, Cramer said:
- ” … here [S&P] Boroden is feeling less sanguine… her next target is 3,720 but she can’t feel confident until we break out above 3,280; … her daily chart of 5-da7 & 13-day ema is in bearish territory suggesting momentum is heading in the wrong direction … now it may be time to sell … but if the 5-13 day ema gets bullish and S&P can take out last week’s high, then Boroden thinks we can resume the rally … and S&P can add 200-300 points; … if it can’t break through last week’s high of 3,150, then we need to prepare for pain.. ”
On the other hand,
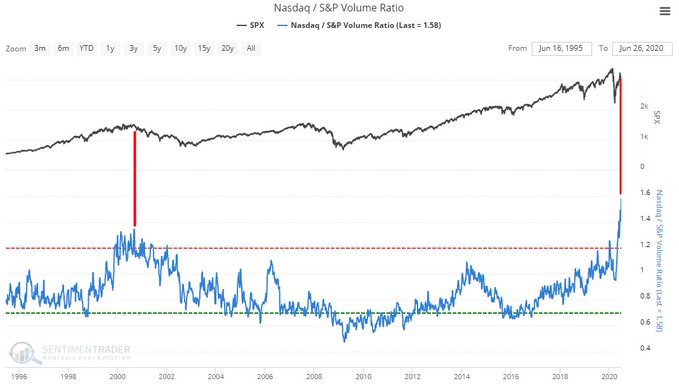
- SentimenTrader@sentimentrader– Jun 27 – Wild EXPLOSION in speculation: NASDAQ / S&P volume ratio has gone through the roof, and is now higher than at the peak of the dot-com bubble! For those who are old enough to remember, most traders who got rich quick during the dot-com bubble also lost their shirts in the crash
Absolutely true, but then as the to-be immortal phrase said – “The Hard Part About Playing Chicken is Knowing When to Flinch“
4. “If it stalls, it falls“
Is this a “you vs. me” or is it a matter of time frames? The title of this section comes from Jeff Kilburg who said his trade is to Sell September futures in Silver at 18.30 with a target of 18.00. Also this week, Carter Worth highlighted Silver (SLV) as a buy because of a bearish to bullish conversion in the SLV chart.
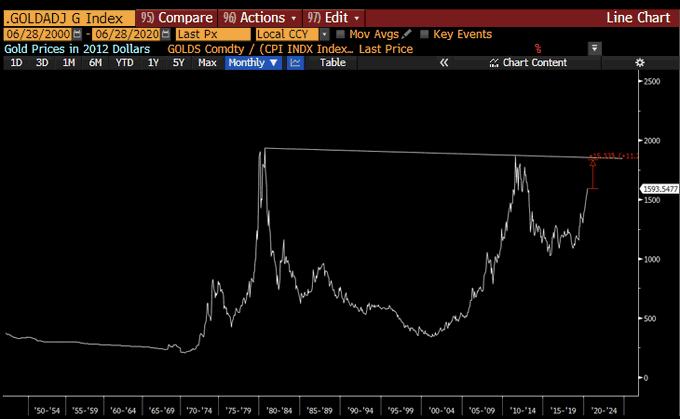
A lot of smart guy trade silver. We are simple folks & we find Gold Miners & GLD to be simpler trades. Both GDX & GDXJ were up 3-4% this week.
- Raoul Pal@RaoulGMI – Jun 28 – Sunday Chart: Gold in inflation adjusted terms is 15% away from the biggest cup and handle break out you can imagine…
5. One Road
During the past few weeks, you have heard a lot about Ladakh & the one Indian road to the Karakorum pass connecting Chinese occupied Xinjiang to Napak-occupied Kashmir. Here is what this road looks like from way top. Can you imagine walking on it let alone fighting on it?

6. Happy 4th

We don’t know whether the big bird below is an eagle or an osprey, but both are symbols of the U.S. Air Force. Given that, isn’t the action below on June 30, 2020 in South Carolina a perfect clip for the 4th of July weekend?
Send your feedback to editor@macroviewpoints.com Or @MacroViewpoints on Twitter