Summary – A top-down review of interesting calls and comments made last week in Treasuries, monetary policy, economics, stocks, bonds & commodities. TAC is our acronym for Tweets, Articles, & Clips – our basic inputs for this article.
Editor’s Note: In this series of articles, we include important or interesting Tweets, Articles, Video Clips with our comments. This is an article that expresses our personal opinions about comments made on Television, Tweeter, and in Print. It is NOT intended to provide any investment advice of any type whatsoever. No one should base any investing decisions or conclusions based on anything written in or inferred from this article. Macro Viewpoints & its affiliates expressly disclaim all liability in respect to actions taken based on any or all of the information in this article. Investing is a serious matter and all investment decisions should only be taken after a detailed discussion with your investment advisor and should be subject to your objectives, suitability requirements and risk tolerance.
1.Fast Speed & Small Size?
The week ending Friday April 16 had an almost forgotten feeling as we suggested last week. Whichever measure you looked at seemed to echoing the same bullish thought, especially the VIX which closed at 16.25. So many luminaries seem to have felt the same given the amount of bearish talk we heard on Fin TV.
All that was being realized on Monday & Tuesday in a fast deleveraging. Was that deleveraging excessive? If you looked closely, you would have noticed a market signal on Tuesday afternoon.
By early afternoon on Tuesday, VIX had exploded above 19.5, up 20% from Friday’s close. Then it started falling. And the corresponding chart below acted the same in a reverse direction, just a bit later on Tuesday afternoon.
You can clearly see IWM, the Russell 2000 ETF, bottom for the week on Tuesday afternoon, a little later after the VIX peaked on Tuesday afternoon. Yes, the VIX shot up higher on the surprise of the Biden 43.4% cap gains tax news but that was short-lived. And the Russell 2000 fell less hard than both the VIX and the broad stock indices on the Biden 43.4% cap gains tax surprise.
The real story of this past week, we think, is the outperformance of the Russell 2000, both upside & downside, over Dow, SPX and the NDX. Just look the daily action in these after Tuesday:
- Wednesday – Dow up 93 bps; S&P up 93 bps; NDX up 91 bps; RUT up 2.35%; IWC (iShares Micro-Cap) up 3.02%
- Thursday – Dow down 94 bps; S&P down 92 bps; NDX down 1.24%; RUT down 31 bps; IWC down 8 bps;
- Friday – Dow up 67 bps; SPX up 1.09%; NDX up 1.30%; RUT up 1.76%; IWC up 2.02%
- For the week – Dow down 46 bps; SPX down 12 bps; NDX down 72 bps; RUT up 40 bps; IWC up 80 bps;
Remember the Russell 2000 is full of low-credit, weak balance sheet stocks unlike the NDX and IWC is even worse than the Russell 2000. So if this week’s demonstrated outperformance of Micro Caps & Small Caps continues, then it has to be a very good sign for both the re-opening of the US Economy & the economically-sensitive stocks.
Now look again at the VIX chart above. But for the upshot on Biden’s 43.45 cap gains tax news, VIX might actually have closed lower on the week. So does the speed of the VIX moves (both up & down) and the clear cut outperformance of small size suggest a stronger market ahead?
We can’t say because we are not smart enough to be forecasters. But one who is did say on Thursday that “we are done with the correction” and added “we could have a real rejuvenation of the stock rally“.
But frankly, Mr. Lee’s target of 4200 leaves us cold. The S&P closed on April 16 at 4185 and closed this week at 4180. So who cares about 4200? Even his 50% probability of 4400 by June is a yawn for us. That is merely 4.7% higher than 4200. Who cares when the Russell 2000 rallied 4.6% just from Tuesday’s low to Friday’s close?
The ultimate “cyclicals” to us are Small-Caps & Micro-Caps who cannot benefit from selling bonds to refinance as big caps can. So we wonder whether Tom Lee’s call of “cyclical stocks might be 100% higher than 2019 levels by 2022” applies to small caps as well.
Look at the example Tom Lee cited on Thursday – CLF or old Cleveland Cliffs. And now look at this week’s comparative chart of IWM with XME.
XME was a little weaker & a little more volatile than IWM. But essentially the same chart, wouldn’t you say? Now read what Tom Lee said about cyclicals on Thursday?
- ” … there is a lot of operative leverage that will take place this year; because the top line environment was so restrictive for the past year; It’s now starting to open up at a time when companies are really lean; I don’t think most people have really modelled the rebound in EBIT that will happen; If we just look at the sector level for cyclicals, they might be by 2022 100% higher than 2019 levels on using consensus revenue estimates but 2008 operative leverage numbers;
On top of all that, we could have the ultimate global liquidity enhancing signal:
Where does the Dollar go? “Next trade is lower” said Mark McCormick, Global Head of FX Strategy at TD Securities on Friday.
With that thought, look at “the chart that stood out this week” to J.C.Parets “is our Equally-weighted Commodities Index overlaid with the ACWI All Country World Index Ex-U.S:“
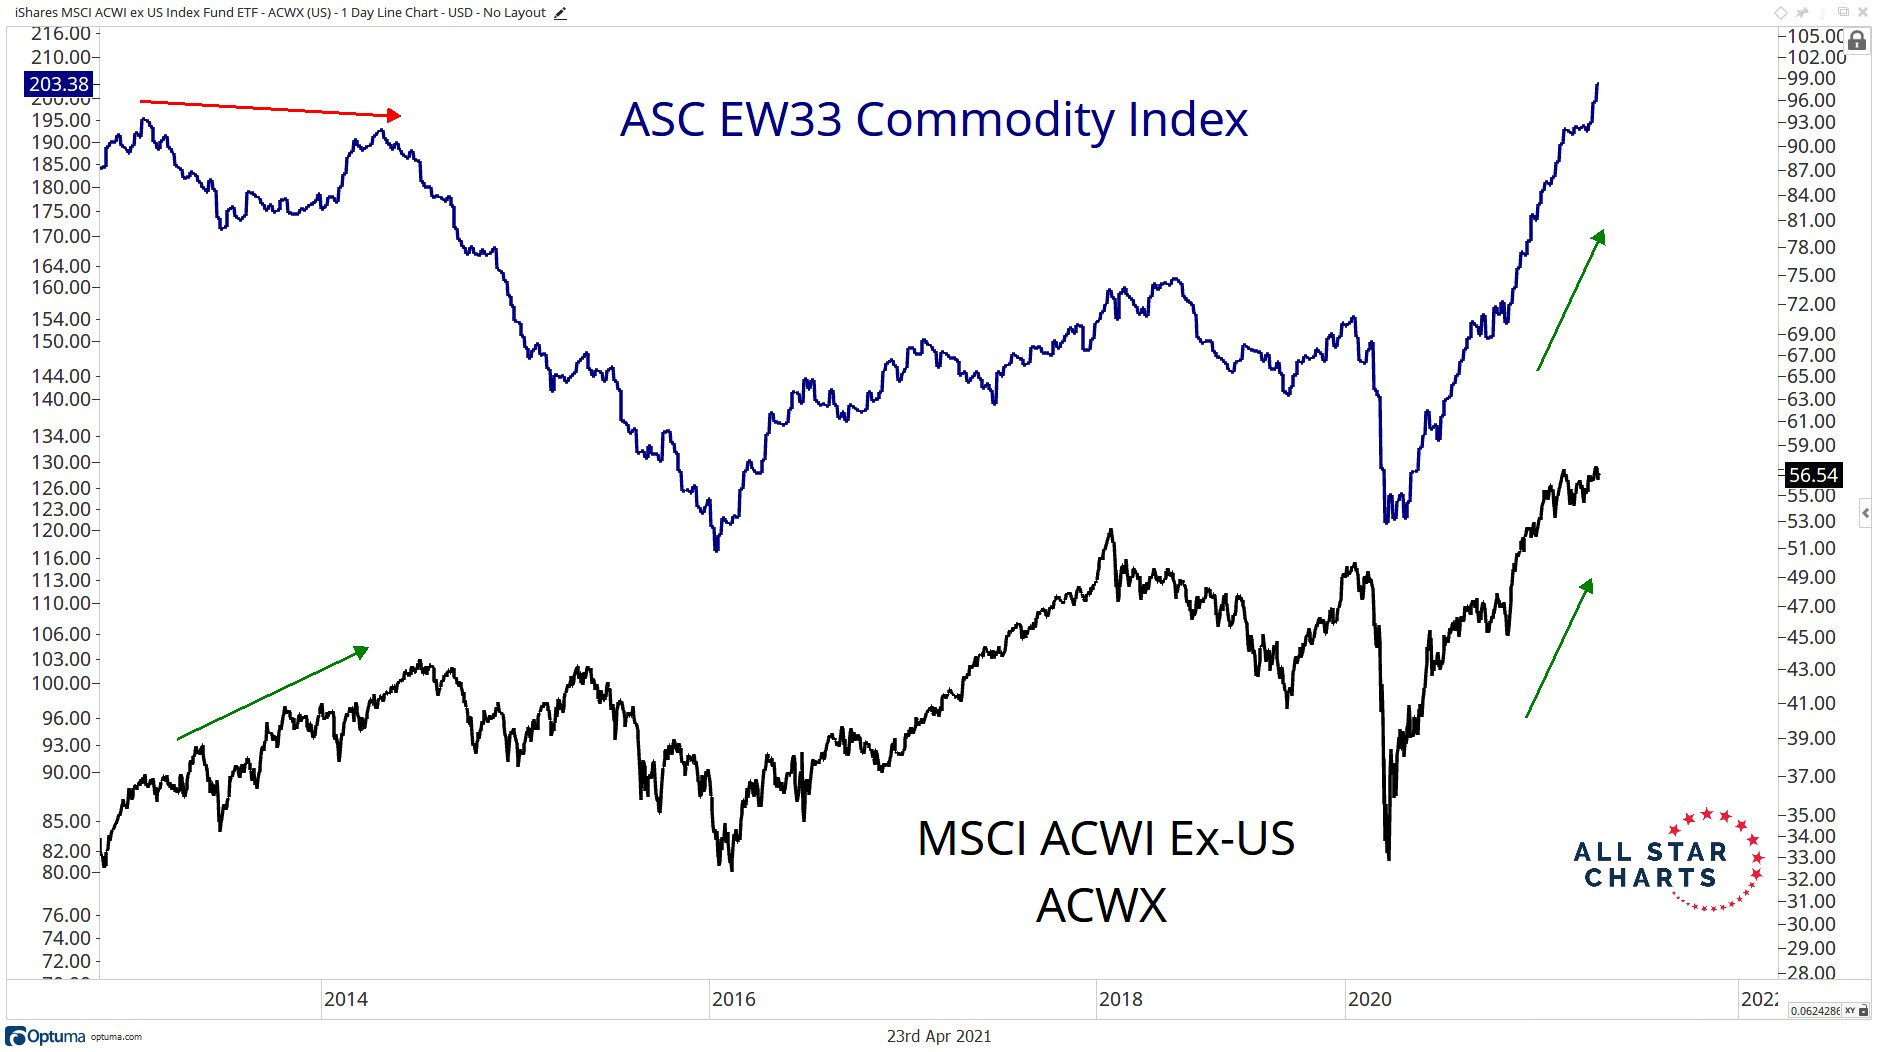
Parets put it simply on Friday afternoon – “Think Crude Oil and Energy stocks, Precious metals and Gold Mining stocks, Materials names, etc.“
2. Interest Rates
Interest rates fell again this week in a bull-flattening. The 30-20 yr curve fell by 3.8 bps; the 10-yr fell by 3.3 bps; the 7-5 yr curve fell by 2 bps. TLT was up 91 bps and closed above $140 and above the 50-day moving average. But it has been flat for the past two months:
So what is next? “Higher yields from here on” said Subadra Rajappa of SocGen on Bloomberg Real Yield on Friday. Priya Misra of TD Securities said on Friday morning on BTV that she expects “the 10-year to get to 2% by year-end“. Her main concern seems to be supply.
On the other hand,
- Lisa Abramowicz@lisaabramowicz1 – Apr 20 – The size of Treasury auctions are poised to start declining later this year, some Wall Street strategists predict. It would be the first such slowdown since 2016. “https://www.bloomberg.com/news/articles/2021-04-20/cresting-flood-of-u-s-treasury-supply-may-end-auction-woes”
The article says,
- ” …. the size of such auctions are poised to start declining later this year, some Wall Street strategists predict, ending a torrid pace of increases as the federal government spent heavily to soften the hit of the pandemic. It would be the first such slowdown since 2016, potentially easing the pressure on a market where yields surged during the first three months of the year on speculation that the economic rebound and federal spending increases will cause inflation to accelerate.
- “Smaller auctions would be easier to digest” and allow for increased sales of scarce Treasury bills, Jefferies economist Thomas Simons said. At the same time, “the signal that we’ve hit the top in supply would help to tighten up the auctions even before the cuts come.”
- “Such a pullback would reflect the steep rebound in economic growth after federal stimulus efforts and the steady roll out of the Covid-19 vaccines. As a result, if the pace of borrowing remains the same, the federal government is likely to have far more cash than it needs even as it continues to contend with budget shortfalls.”
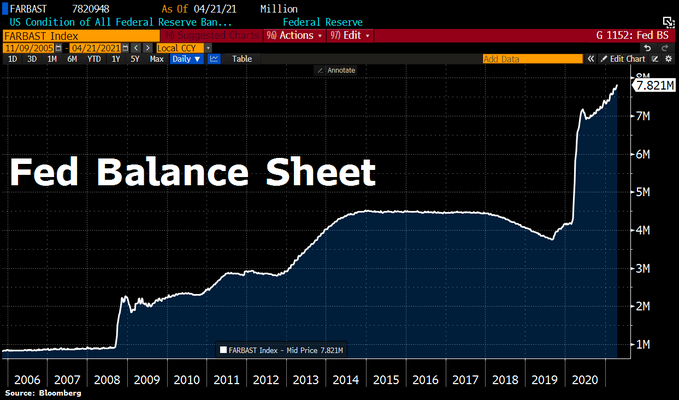
And the biggest buyer keeps buying:
- Holger Zschaepitz@Schuldensuehner – #Fed balance sheet expansion continues despite a booming US economy. Total assets rose by another 0.4% to hit a fresh record of $7.82tn. Fed balance sheet now equal to 36.4% of US GDP.
So what happens next? Why don’t we wait until the biggest buyer says something on Wednesday April 28?
Send your feedback to macroviewpoints.com Or @MacroViewpoints on Twitter