Summary – A top-down review of interesting calls and comments made last week in Treasuries, monetary policy, economics, stocks, bonds & commodities. TAC is our acronym for Tweets, Articles, & Clips – our basic inputs for this article.
Editor’s Note: In this series of articles, we include important or interesting Tweets, Articles, Video Clips with our comments. This is an article that expresses our personal opinions about comments made on Television, Tweeter, and in Print. It is NOT intended to provide any investment advice of any type whatsoever. No one should base any investing decisions or conclusions based on anything written in or inferred from this article. Macro Viewpoints & its affiliates expressly disclaim all liability in respect to actions taken based on any or all of the information in this article. Investing is a serious matter and all investment decisions should only be taken after a detailed discussion with your investment advisor and should be subject to your objectives, suitability requirements and risk tolerance.
1.Thank you Jim Bullard
Wasn’t it boring two weeks ago? Powell & FOMC did a little bit to enliven things on FOMC Wednesday afternoon. But that was baby stuff compared to the fireworks set off two days later by the flame throwing Bullard. Not only did he entertain us but he also delivered an opportunity for some real profitable trades, at least for the cognoscenti. Just think if you were like BlackRock’s Rick Rieder, what could you have bought & sold on that Friday afternoon &/or on Monday morning?
Actually Rick Rieder did come on CNBC Closing Bell on Monday & say that Friday provided (to him & this cohort) an opportunity to buy & sell. But he didn’t even hint at what he bought & sold. And no CNBC Anchor pressed him on that. Guess CNBC remains a for & by forum for the pezzonovante!
At least we simple folks should feel happy about the entertainment, right? Why the past tense? Because the entertainment is finito & we are back to square one, or square two weeks ago.
Look at the 30-year Treasuries, the instrument most affected by Bullard. The 30-year yield closed at 2.14% on Friday June 11. It fell 13 bps to close at 2.02% on Friday, June 18. This week, it went up 13 bps to close at 2.15% – a total change of 1 bps over the past two weeks.The 20-year yield closed at 2.07% on June 11; fell 11 bps to close at 1.96% on June 18; this week it rallied 12 bps to close at 2.08% on this Friday – again a two-week move of 1 bps.
Not so the rest of the curve over the past two weeks – 10-year yield moved up 7 bps; 7-year yield moved up 13 bps; 5-yr moved up by 18 bps. So short term yields went up during both weeks showing the real move that was signaled by both Powell & Bullard.
The VIX behaved just like 30-year Treasuries – up 32% from 15.65 two Fridays ago to 20.72 on June 18; then a 25% fall this week to 15.62 – a grand total of 0.03 cents move over two weeks. The question is do VIX gurus count this week’s 25% fall in VIX as another “VIX-spike-peak” bullish signal for stocks?
Stocks did rally this week but to the same result as other asset classes above. Dow Industrials went down by a total of 46 points or 13 bps over the past two weeks while the S&P went up by 46 points or 80 bps to close at 4280, a new all-time high. The big up mover was the NDX, up 2.5% to 14345 to 12998. In contrast, Russell 2000 went down by 2,3% over the same two weeks. EEM moved up a total of 21 cents from 55.29 to 55.50 over the past two weeks, despite the Dollar rallying by 1.3% over the past two weeks.
So it does feel as if we are back to where we were two weeks ago albeit with a bit more conviction – that inflation is indeed high right now (Core PCE up 4% yr/yr) regardless of where it might go. So short maturity rates are unlikely to go down much. In fact, some are calling for the 5-year yield to cross 1% on the upside. Seems easy enough so some just as it seemed easy to others to think of the 30-year yield breaking 2% on the downside.
So what do we do? Wait for next Friday’s Non Farm Payroll number.
2. The Constant
And what might that be?
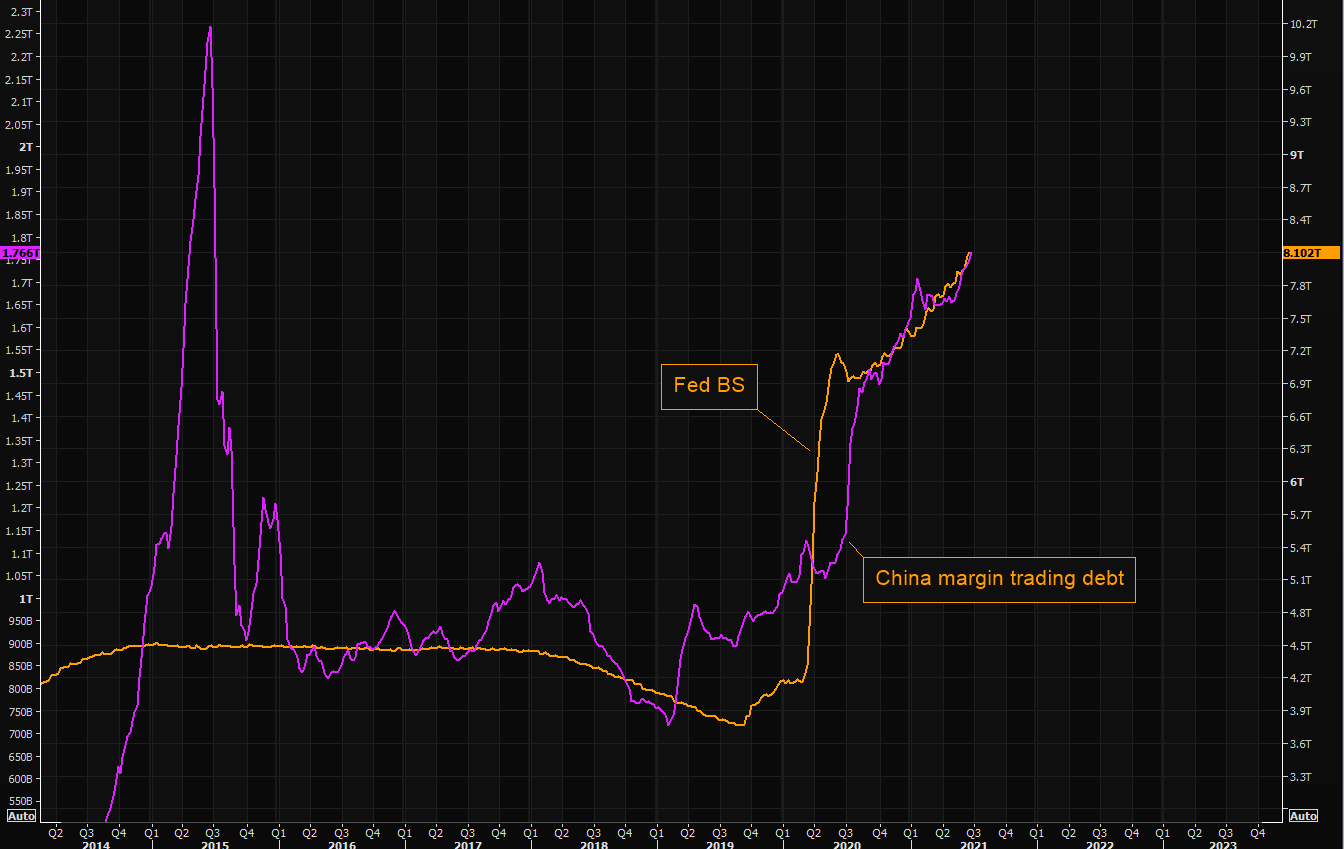
- The Market Ear – Main drivers of the bull printing new highs – Fed’s BS reached another new all time high, and Chinese speculation (margin trading debt) printing another high, but far from the all time highs we saw during the 2015 frenzy.Do you need anything more…?
Some might remember our old discussion about the MC/BS measure – Market Cap to Fed’s Balance Sheet. Below is looking another way at the same concept to gauge the actual rise in S&P for the past 13 years:
- Holger Zschaepitz@Schuldensuehner–The S&P 500 may have hit a new ATH today at 4,277 points, +13.8% YTD, but if you put the index in relation to Fed’s balance sheet, it is trading at the same level as in 2008, so equities have traded sideways since 2008, basically counteracting balance sheet expansion.
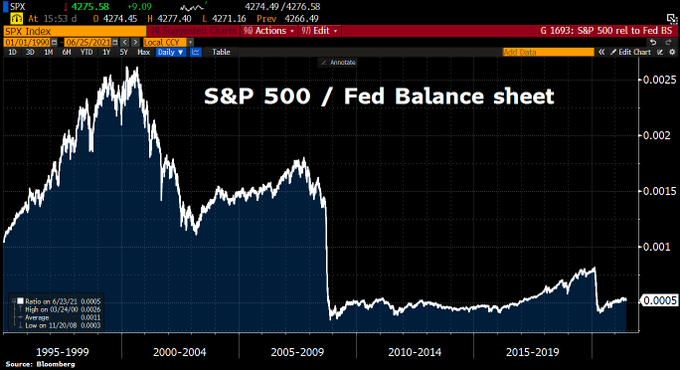
Look at this & understand that the Fed’s Balance Sheet is not coming down unless we actually get sustained inflationary growth for more than a couple of quarters. Perhaps that is what Chairman Powell means by evidence-backed FOMC monetary action instead of prediction-based action. Others might look at the last 13 years and blame the Fed for being the main driver of increasing wealth-income inequality in America.
We owe another thanks to Signor Bullard. He did end up scaring a lot of people by showing what might happen to stocks if Powell were replaced by another Chair later this year. Did you notice how Congresswoman Maxine Waters was humbly polite to Chairman Powell and actually requested him to keep advising them? We do hope that the Biden brain trust also got the same message that replacing Powell might prove risky for 2021.
3. A Lukewarm High but Not a Top?
First, the positive from Tom McClellan & his article – VIX Open Interest Is Falling, Which is NOT a Feature of Price Tops.
- “It is important to note that for the time period since VIX futures first started trading in 2004, the important price tops for the SP500 have appeared when VIX open interest is up well above its 200MA.”
- Here in 2021, we are seeing a change in behavior. Total open interest has been falling since the peak in February, and is now down to the 200-day moving average, even though prices are continuing higher.
- Rather, the point of this is that having VIX open interest below the 200MA is useful for ruling out the possibility that prices are now at a major top. It is a missing topping condition. So we have some assurance that there should still be a lot more for prices to run higher.
But does that also rule out short corrections? We don’t know for sure but we doubt it.
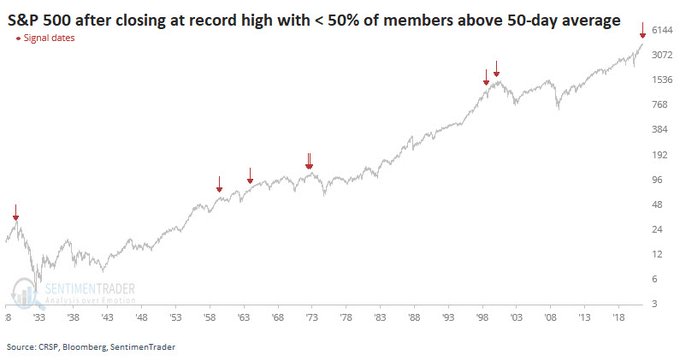
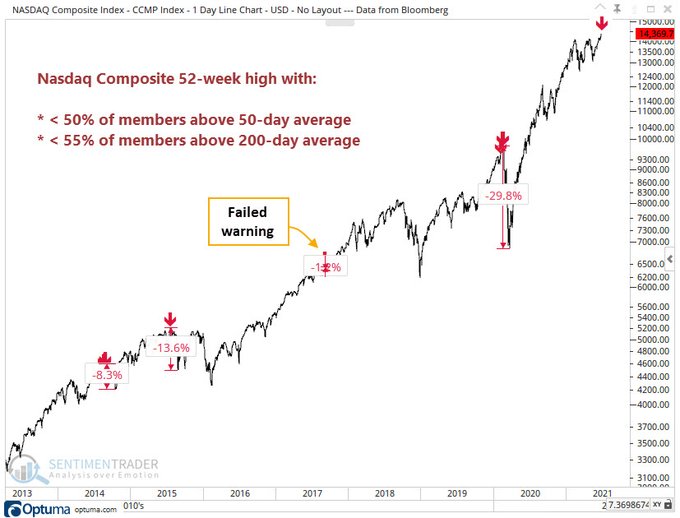
- SentimenTrader@sentimentrader –For some perspective, here’s every instance since 1928. This is why people just buy the indexes – it’s a gut punch see “record highs” and half of the stocks aren’t even in uptrends.
Similar story for the Nasdaq:
- SentimenTrader@sentimentrader – Maybe markets are just playing a whole new game. Maybe stuff like this doesn’t work anymore since so many are now following it. But this is one of the few times in 20 years that the Nasdaq has scored a high with so few stocks in uptrends.
Where are the daily sentiment numbers, you ask?
- Thomas Thornton@TommyThornton –$SPX bullish sentiment 81%, $NDX bullish sentiment 88% – both in the extreme zone over 80%
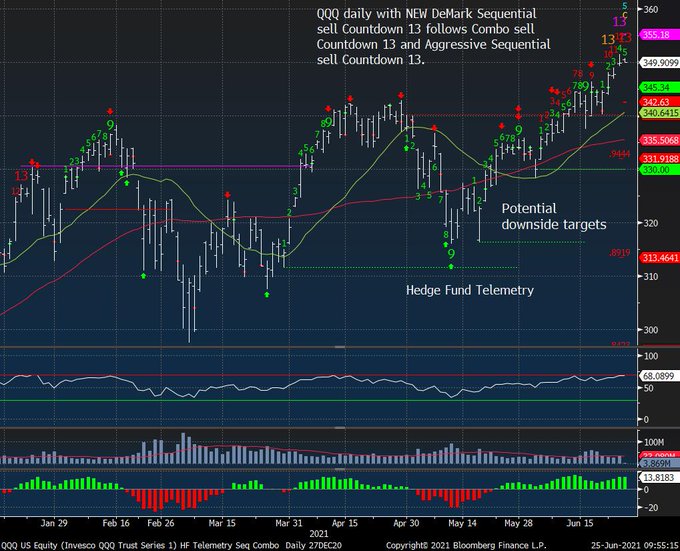
-
Thomas Thornton@TommyThornton – $QQQ as we have been anticipating the DeMark Sequential sell Countdown 13. Now we want to see a price flip down with a close lower than the close 4 days earlier. There are also weekly signals in play
But with all the above negative stuff, is there any thing missing? According to J.C. Parets, New Lows Remain Nonexistent. He compares the expansion in new lows in 21-day chart (month) & 63-day (quarter) chart. He saw “a spike in 21 day lows last week … an expansion all the way down the cap scale, from large-caps to small-caps“.
In contrast, he added – “Where we’re NOT seeing this is in the 63 day lows. It’s an absolute ghost town.”
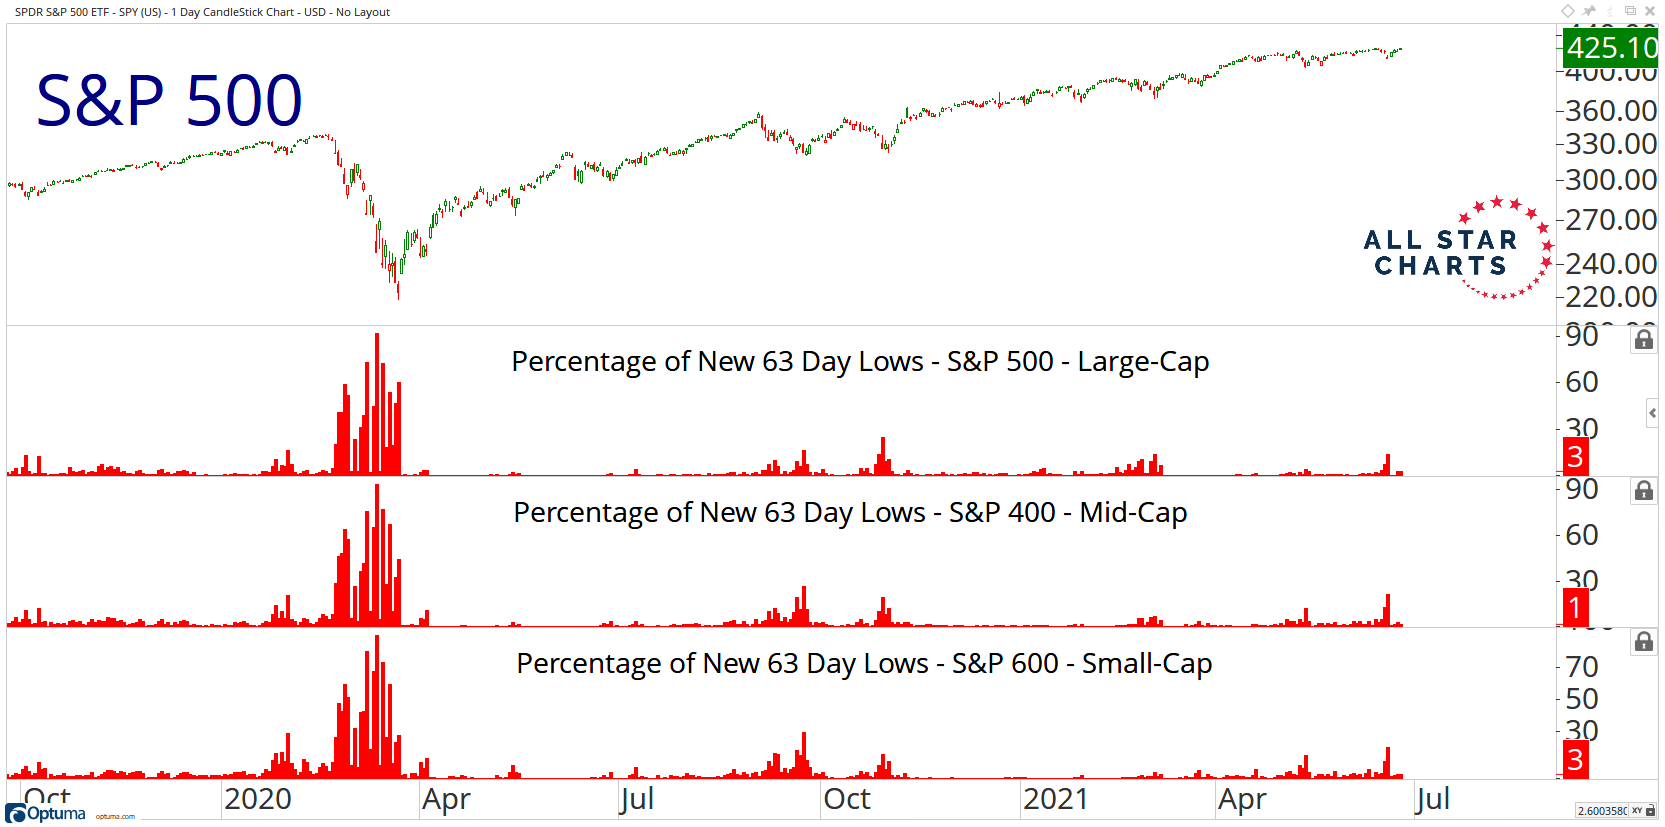
- “Without an expansion in, at least, the 63 day lows, it’s tough for the market to do anything but go sideways or up. … If you think the stock market is going a lot lower, you want to look for signs of life from the new 63 day low list. We’re just not seeing it yet. And if we don’t get it, the path of least resistance for stocks is higher, not lower.”
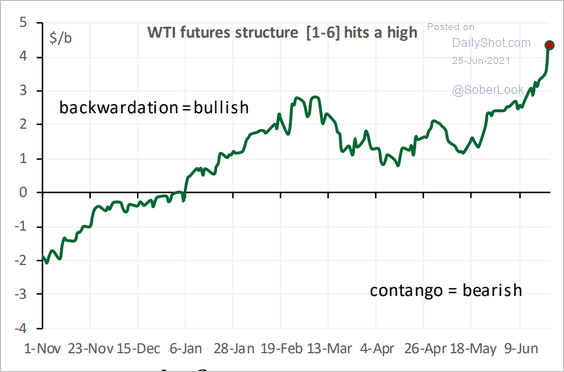
4. Commodities
On our two week basis, Copper is down 5.5% and CLF, FCX are down 12% and 9% resp. Gold is down 5.3% with GDX & GDXJ both 11% over the past two weeks. In contrast, Oil is up 4.5% and Brent is up 4.8% over the two week period.
In contrast OIH, the Oil Services Holder, is down 2.7% in the last two weeks while XLE is virtually unchanged.
5. Bitcoin
We are not going to get into the trading of Bitcoin. But we would like to recommend the clip below for an overview and a glimpse into how institutional talent & practices are coming into Bitcoin. Hear from a former regulator who is now a Bitcoin fund manager:
**Please note the change in email address for feedback. We are going to try free business gmail account instead of paying for email.
Send your feedback to editor.macroviewpoints@gmail.com or @MacroViewpoints on Twitter