Summary – A top-down review of interesting calls and comments made last week in Treasuries, monetary policy, economics, stocks, bonds & commodities. TAC is our acronym for Tweets, Articles, & Clips – our basic inputs for this article.
Editor’s Note: In this series of articles, we include important or interesting Tweets, Articles, Video Clips with our comments. This is an article that expresses our personal opinions about comments made on Television, Tweeter, and in Print. It is NOT intended to provide any investment advice of any type whatsoever. No one should base any investing decisions or conclusions based on anything written in or inferred from this article. Macro Viewpoints & its affiliates expressly disclaim all liability in respect to actions taken based on any or all of the information in this article. Investing is a serious matter and all investment decisions should only be taken after a detailed discussion with your investment advisor and should be subject to your objectives, suitability requirements and risk tolerance.
1.What’s Going On?
As we have written a few times, the last & fast big move in Treasury rates began the afternoon before Thanksgiving & continued through the next week until Friday, December 3, the day of the stunning Non-Farm Payroll number. In that week and half, the 30-Year Treasury rate fell from 2.04% to 1.69%. That was because the Fed “minutes” released the day before Thanksgiving panicked the Treasury market into believing the Fed was going to trash the economy. And the extent of the move was due to the short position in Treasuries.
Thanks to the strength of the Non Farm payroll, Treasury yields began rising again from a low of 1.69% on Friday, December 3 and got back the entire decline by last week’s minutes. That move big but steady. But both the down & up moves in Treasury rates made sense.
We felt last week that much of the rise in yields due to the Fed was nearly done with 2-year at close to 90 bps. And that feeling was supported in the Treasury market during the first four days of this past week. Despite Fed’s rhetoric & despite the higher than even expected inflation numbers, the Treasury rates did not move rates up much. In fact, the 30-year and the 2-year yields simultaneously fell on NDX 230 point up Tuesday and NDX 409 points down Thursday. So Fed & inflation factored in?
Heck No said Friday. And that was despite a weaker than expected Retail Sales report, actually a bad retail sales report that led to bug declines in retail stocks on Friday. In fact, BTV’s Tom Keene joked that the retail sales number had reduced the number of Fed hikes expected from 4 to 3. It was a logical and sensible comment.
But the Treasury market laughed at him, at all of us and pushed rates up. Look at Friday’s one-day chart of 30-year yield:
The entire Treasury curve rose by 6-7 bps in yield on Friday:
- 30-yr yield up 6.6 bps, 20-yr yield up 6.7 bps, 10-yr yield up 7.3 bps, 7-yr yield up 7.6 bps, 5-yr yield up 7.3 bps, 3-yr yield up 6.5 bps & 2-yr yield up 6.8 bps.
This on a soft economic data day, softness that caused semi-havoc in the retail stocks? This when shorts in Treasuries had already been reestablished in size (per JPM survey via The Market Ear)? Lo & behold, this was a week in which Treasury rates fell on high inflation data & hawkish Fed talk!
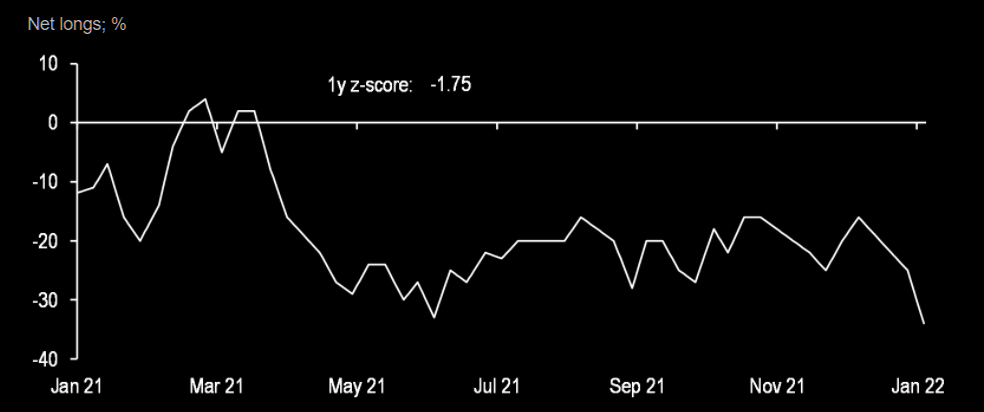 (courtesy – The Market Ear)
What’s going on? Is it possible that stronger than expected data is causing rates to fall because the strong data would make the Fed raise rates faster & taper faster thereby weakening the economy? And weaker economic data is causing rates to rise because the weaker data could force the Fed to lower the speed of their taper & rate-hikes thus keeping the economy from slipping?
This is what happened after WWII. The war-time stimulus was allowed to fade away slowly & steadily and that kept real interest rates negative for years. If you think COVID was also a war-like exigency, then it might sense for the Fed to allow its stimulus (low rates & high QE) fade away slowly and thereby allow the negative real rates to slowly turn positive without causing an accident in the economy.
We were not around in the 1945-1950 period but we were around in the 2006-2007 period. We recall how Bernanke entered 2007 with a hawkish determination and how inflation had been a visibly big problem by the summer. Treasury rates had risen to around 5.5% and, as we recall, CNBC Fast Money was shouting “inflation” even louder than they are now. Hedgies were short Treasuries massively as well.
Then on the morning of Friday, June 22, 2007, the Treasury market turned. Rates stopped going up & began going down. About 5-6 weeks later on August 3, 2007 came the famous “they know nothing” anti-Fed rant of Cramer.
We know we are basically simple folk who think simply. And that may be why we keep wondering whether we are in a reprise of a 2007-like slowdown that is building underneath the economy’s surface as the surface seems hot & inflationary. Frankly, we think that 2007 economy was actually stronger than the one we have in 2022. The data in 2007 began slipping later in Q1 or early Q2. In 2022, it is already slipping.
And the political situation in 2007 (2nd term of President Bush) was relatively benign. So there was hardly any political pressure on Bernanke to get more hawkish and fast. In shark contrast, as Jim Bianco said in the Double Line Markets Outlook, “the Fed is under enormous political pressure to at least appear to be doing something“. And that something is almost guaranteed to be wrong.
Further, unlike Bernanke in 2007, Powell is almost besieged within the FOMC with Brainard promising 2% inflation at all costs (of course costs to be borne by the middle & lower-middle class) and Waller going even more hawkish than her, followed by couple of regional members. So Powell may have to choose between risking an open fight within the FOMC or simply going along with the hawks.
We hope that this 2007 stuff is baloney but we can’t shake it off. And now Tom McClellan has brought up 2007 in his article Bond CEF A-D Line Showing Liquidity Problems, an article that describes a divergence that measures liquidity in the stock market. He writes that “liquidity has suddenly become a problem, and it is affecting the more liquidity-sensitive issues first“.
Then he uses that awful number beginning with “2” and ending in ‘7″ to give an “example of a big divergence between the Bond CEF A-D Line and the SP500“. He adds,
- “The final price high then did not come until October 2007, but the Bond CEF A-D Line had its peak all the way back in May 2007. By the time that the final price high came, this indicator had been screaming about big illiquidity problems.”
Just think! The above divergence signifying liquidity problem did not begin until May in 2007. In contrast, according to Mr. McClellan, this divergence & liquidity problem is beginning NOW in mid-January of this year.
Remember what Gundlach said back on Friday, October 22 on CNBC Half Time Report:
- “Long term Bonds do make sense with 30-year Treasury at 2%+; with all the debt, be alert to debt deflation; 30-yr at 2% can give you a 30% return because the yield can fall to 1% as it did in Covid.”
Fast forward to this Monday, January 10, 2022, and read what he said in his Best Ideas segment in 2-minutes in the Double Line Round Table Best Ideas clip:
- “… you should own at least 25% of your assets in the long bond [30-year Treasury Bond] … “
And David Rosenberg proclaimed the 30-year Treasury Bond as his first best idea and that he is going to buy at price dips.
2. Inflation & the Economy
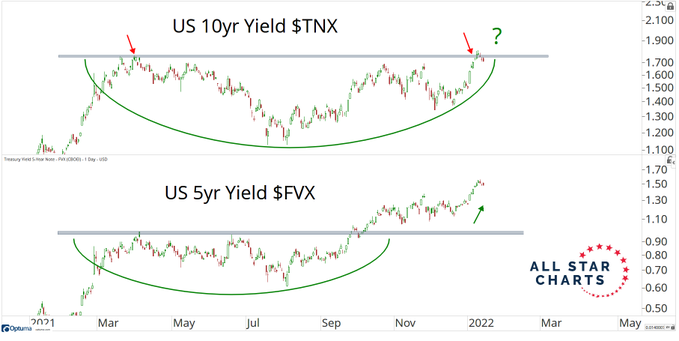
Not only was the sharp rise in rates on Friday interesting but also interesting is the fact that the 10-year yield closed on Friday at 1.78%, above Rick Santelli’s 1.76% level. Some others, like Katie Stockton of Fairleigh, consider 1.79% as the major resistance. Even more interesting is the uniformity of rate rise across the entire 30-2 curve with each maturity up 6-7 bps on Friday. That brings up a key question:
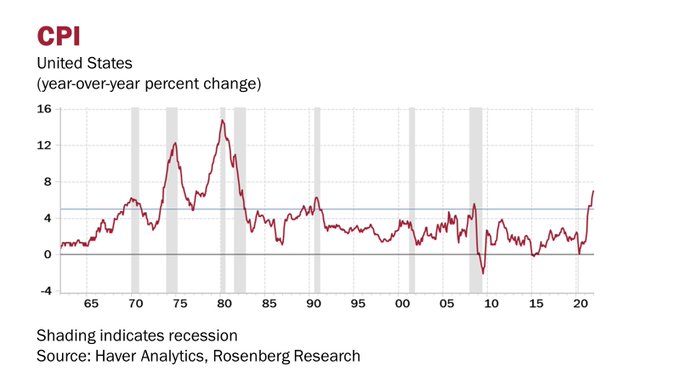
We know that an intense war on inflation by the Fed tends to cause recession but is inflation in itself is a cause of recession? Below is a track record over the past 60 years:
- David Rosenberg@EconguyRosie – – Inflation is 7% and the last time this happened, we had a double-dip recession. Prior to the pandemic, 5%+ inflation presaged all seven recessions over the past sixty years. Les jeux sont faits. #Economy #Inflation #DavidRosenberg #RosenbergResearch #RRMacro
Rosie also says “GDP contraction is starting” and focuses on real retail sales vs. nominal retail sales:
- David Rosenberg@EconguyRosie – – Let’s look at these retail sales data in real terms because recessions are determined by volumes, not nominal dollars. Real retail sales were -8.2% SAAR in Q3 then a mere 0.5% for Q4… and look out below because the hand-off for this quarter is -7%! #Economy #Recession
On the other hand, business formation data suggests to Brian Reynolds that the “economy is probably better than the published figures and it is more productive. People are quitting their jobs & they are launching their own companies at a record pace.” This, Mr. Reynolds suggests, is not being captured in the jobs data produced by BLS. Watch this clip yourselves:
3. U.S. Dollar & Stocks
Not only was Friday a change of direction for Treasury rates but also for the Dollar. The Dollar fell hard on days that featured strong economic data. On Tuesday, it fell by 40 bps, on CPI Wednesday it fell by 71 bps and then on PPI Thursday, it fell by 6 bps. Big moves. Then lo & behold the Dollar rallied 38 bps on Friday after the weak retail sales data.
So what do we look at? The week’s fall of 53 bps for the Dollar or Friday’s up move? Same for Treasury rates. Do we focus on Friday’s sudden up move in rates or the almost unchanged weekly moves? The 10-year was up 1.3 bps on the week while the 30-yr was only up 0.5 bps.
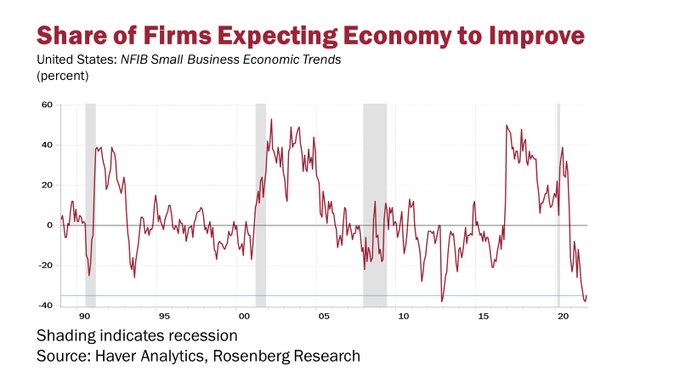
In contrast, Friday was relatively ho-hum for the stock indices. And the week was virtually flat with the S&P down only 30 bps on the week with RSP, the equal-weighted S&P, actually up 12 bps on the week. And the beaten-down NDX was actually up 13 bps on the week. The worst performer of the week were small-caps with Russell 2000 down 88 bps and the Micro-caps down 1.4%. Is that because,
- David Rosenberg@EconguyRosie – – “I was watching former Fed VC Alan Blinder struggle on @CNBC to explain how Treasury yields could have the temerity to stay so low. I wanted to send him this chart. Econ expectations from the small-biz sector are lower today than at the trough of all 5 prior recessions!
This brings up the big question:
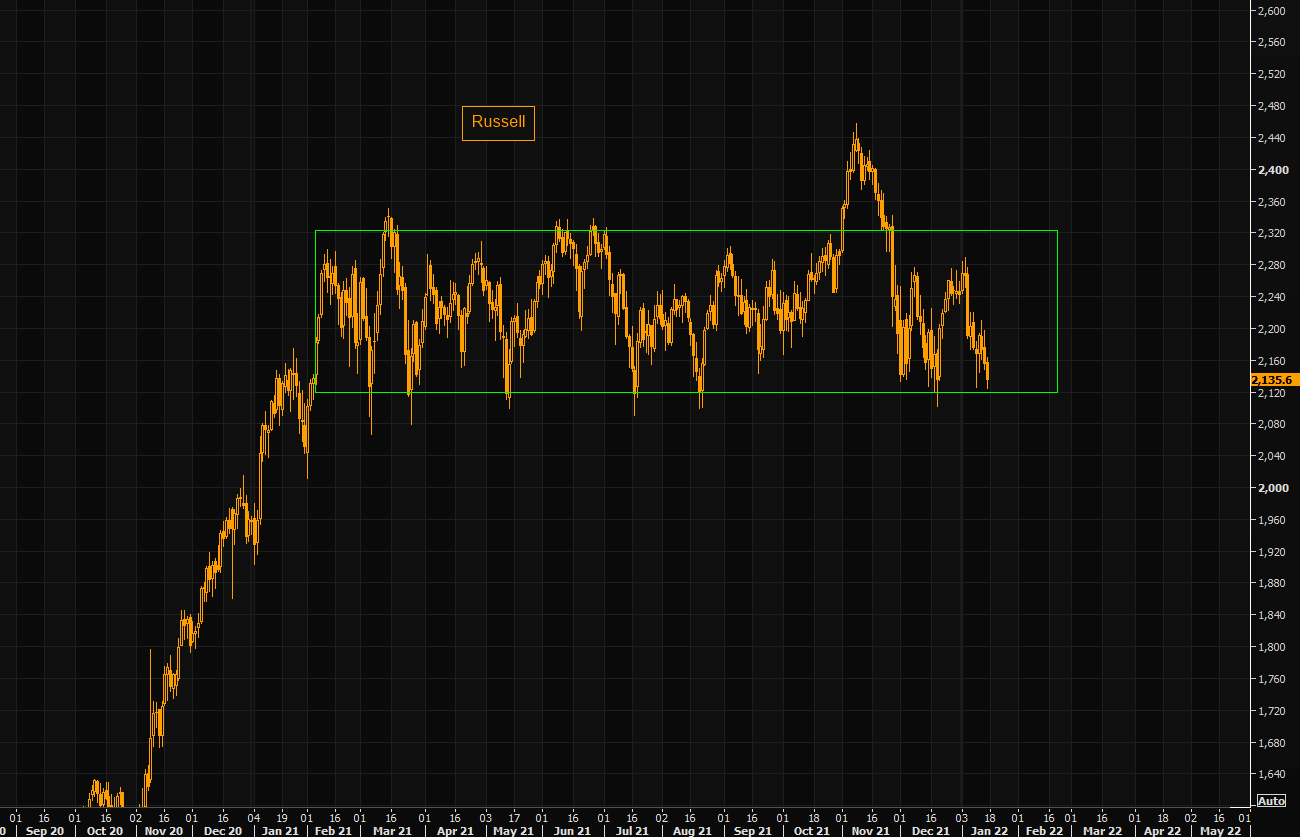
- The Market Ear – Here we are once again, Russell trying the lower part of the huge range. This is soon going to be the textbook range example…until it breaks.
4. Guru-Talk
In case you didn’t know, “Guru” is an ancient Sanskrut term which means “remover of darkness“, darkness of the mind. This was used to describe Rushi (Sages) to whom one turned to reduce confusion & receive enlightenment. So below are a series of words from people who might reduce the reigning confusion.
We begin by reproducing last week’s abridged clip of Cramer summarizing the views of the renowned Larry Williams. For the immediate term, the view is the market will be ok until mid-month and then we will see a “brutal” correction that provides a buying opportunity in late February.
The next one is Cramer’s abridged summary of views of his techni-pal Carolyn Boroden who uses the Hemchandra-series of numbers (adopted by Fibonacci from the 9th century book “Hisab al-Hind” or “Arithmetic of Hindus” by the renowned Al-Khwarizmi whose name was latinized as Algorithmi, hence the term Algorithm).
This clip was released on Tuesday January 11, after the big bounce in NDX off of Monday’s low. Despite the bounce, Boroden told Cramer that the NDX is in bad technical shape and the rebound could peter off in a week & half; her new absolute support is the 15003-15162 range in NDX.
On Wednesday, Chris Verone said on CNBC Fast Money that the “internal complexion of this market is not as sound as it looks“. On Monday, January 10, Katie Stockton, despite being pleased by the bounce in the NDX from Monday’s support low of 15,575, said on CNBC Closing Bell that she was advising clients to hold but not to buy. She proved right because that her 15,575 support was broken badly during Thursday’s fall of 409 points in the NDX.
All this technical stuff is fine but was there any one who could speak in simple terms? Below is Eric Johnston, Cantor Fitzgerald’s head of equity derivatives and cross-asset on CNBC Closing Bell. The title of the clip is “I think we’ll see material sell-off over the next six weeks.” Warum? Johnston gives 4 reasons:
- reason 4 – we are actually seeing early signs that the consumer who has really been incredibly powerful part of this economic rebound is going to start to fade over the coming months
- reason 1 – this is really a historic change in monetary policy that no one has ever seen before; Fed bought over $4 trillion of assets over the last two years; … rates have been pinned at zero; … this is all going to be completely reversed this year; … the market is aware of it but because it has never happened before to this magnitude, the market is unaware how equities will actually handle it. we think it will be pretty negative;
- reason 2 – equity exposures globally are at historic highs; ..margin debt was up 80% last year; … so when the market sells off, there will not be an incremental buyer … ;
- reason 3 – yields are moving higher, TINA will fade
So his conclusion – “the sell-off could be somewhat material & gain steam as momentum comes out of the market“.
Did you notice that “six week” duration of Johnston’s sell-off would end by late February? Doesn’t that match Larry Williams call for a buying opportunity to emerge by late February? Hmmm!
Another case for not buying here could be:
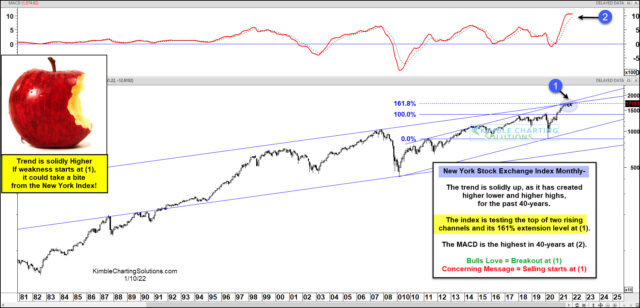
- Jesse Felder@jessefelder – – ‘The NYSE Composite is trading at a confluence of resistance, including the top of two rising channels and the 1.618 Fibonacci extension level off the 2020 lows. As well, the MACD indicator is at its highest level in 40 years.’ kimblechartingsolutions.com/2022/01/is-nys by @KimbleCharting
Isn’t the above just making you sick with all the negativity? We ourselves are sick of it writing it. So we end this Guru-section on a positive note:
Wouldn’t it be fun if the stock market, especially NDX, rallies hard next week with a derisive laugh about the negativity above? If it does so, would people follow Katie Stockton & sell that rally or would they get more long?
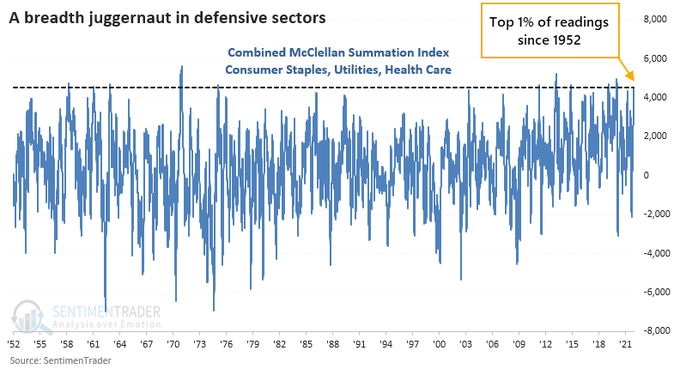
By the way, the term Juggernaut (used in the tweet above) is a British butchering of Jagan-Nath, a name of God meaning Lord Protector (Naath) of Jagan (Universe/world). The connotation of Juggernaut is a powerful force that crushes the opposition in front of it. That connotation comes from the JaganNath Rath Yatra in which the Chariot of JaganNath is pulled by devotees with devotional force. Sometimes the pulling is so strong that the Chariot gains speed & tramples some of the devotees pulling the chariot. Such a death is welcomed by true devotees because it is deemed a sure path to Heaven.
This is the world’s biggest Chariot festival and has been an annual tradition for over 500 years. Below is a BBC photo of a recent celebration.

5. Best Ideas
We urge all to watch the 13-minute clip below titled Best Ideas from the Double Line Round Table in January 10, 2022. Participants had to present their best investable idea in two minutes. There are a couple of real surprises in it.
Ed Hyman – I think I would pick Amazon; Its been a real laggard & I think its sort of at the heart of what’s gonna happen to the economy in the future …
David Rosenberg – I like the Long Bond (30-yr Treasury Bond); Fed’s gonna pull a policy mistake; fiscal drag … what I am going to buy on price dips …. in the stock market I like Utilities, I like Pipelines, … something that has a massive tail-wind that pays of very nice cashflows *(self or shelf) storage space, …. industrial reits; … in emerging markets one giant we didn’t talk about where inflation has actually broken down; its in India.. I am looking to writing more & more about Indian Stocks & Indian Bonds; …because we are noticing structural shifts in the economy; … its true that Modi’s reforms have been slow but they have been accumulating over the years .. we have detected in India something interesting; that their potential non-inflationary growth rate has gone up & that’s very bullish for their financial assets; so that’s on our radar screen in the emerging market space for the coming year …
Jim Bianco – I agree with Rosie about a policy mistake coming next year .. the Fed is under enormous political pressure to at least appear to to be doing something … so a flattening yield curve would be story one with potentially second half inversion of the 2-10 curve …. 2nd one is that there is high cyclicality to value vs. growth; value stocks had their worst 10-yr period ever until their low in late 2020 before they rebounded … for mean reversion standpoint, the return of value relative to growth will continue through the year… lastly I believe in the digital space …
Danielle DiMartino Booth – … the multiplier effect of Fed removing money from markets is about 3 times .. I think the money supply growth could itself turn negative & that could be a first-half story; I think the curve is going to flatten more rapidly than most people are anticipating … I am watching the MOVE index as an indicator; VIX index has come down but MOVE index has not; that’s telling you there could be a credit hiccup sometime in the second half of the year; … the other thing I would suggest is that there is still fiscal monies to be spent ; Municipal Bonds are going to be a good place to because they are going to be actual physical recipients of monies in this coming year … finally I would say that there is a lot of scrutiny now about the office space … I think you need to draw the parallel between office space & multi-family because one has followed the other … as Rosie said, the supply coming on is at a 47-year high; …
Jeffrey Gundlach – for relatively low risk assets I would prefer European stocks; I think for high-risk assets investors should start Dollar-cost averaging into Emerging Markets Ex-China and I would overweight India; I agree with Rosie; I have been a long-term India Bull … I am not talking about 5-years; I am talking about 35-years in the future and you should hedge that with the Long Bond; you should own at least 25% of your assets in long Treasuries for the deflation risk … where there is yield, & it comes with attendant risk, is in closed-end bond funds; …. there are many that are at discounts, kicking off yields of about 7%-8%; but it comes with risk; when there is a credit event, you are going to have a drawdown that is about 25% …
What might be an idea that incorporates the best idea from David Rosenberg, Danielle DiMartino Booth & Jeffrey Gundlach? A long duration Municipal Closed-End Bond Fund like, for example for NYC folks,:
PNF from Pimco has a 4.17% triple-tax-exempt dividend yield. Similar are MHN from BlackRock & NAN from Nuveen. These firms offer similar closed-end funds for most states.
6. The Josh of Josh
We have spoken a good deal above about Gundlach, his Double Line & their views. It is therefore appropriate to highlight another call he has made. Like some of his calls, he was early but now proven correct.
Sadly the English script is incomplete & that is what leads to mispronunciation. In great contrast, the Dev-Naagari script (loosely Divine Urban) script, that was developed before writing was invented, is almost perfect. Unlike English, it was 12 vowels of 6 pairs like a & aa. The one we focus on today are vowels that sound “o” & “aw” or the difference between जोश & जॉश .
The “Josh” of this section’s title is the “o” sound like Go or Mo. It means the joyous confidence with which a soldier goes into battle. The question “How is the Josh?” became an instant cult line when used in “Uri”, a film about 4 teams of commandoes who slipped behind the Napaki military lines to attack & kill the terrorists who had conducted a raid inside India. Watch the 20-second clip below to get the impact of the line:
That Josh was जोश. Now to जॉश, also sadly written as Josh. The twain met on Saturday & we saw the Josh (जोश) of Josh (जॉश), of Josh Allen. Allen brought the same जोश to the game playoff game against the Patriots. Those who unfortunately didn’t watch the game, should watch the 5-minute clip below:
Gundlach has been a fan of Josh Allen for some time. All Allen needed was patience, maturity & then finally a cold intense जोश which spread to the entire Buffalo team, especially Safety Micah Hyde who made a game changer play in the first Patriots drive. To quote Gundlach,
Think back to the destruction of Tom Brady’s Tampa Bay by Kansas City Chiefs in the regular season game in 2020. What is not recognized that Brady brought his team to within 4 points in the 2nd half. Much more importantly, Tampa Bay went unbeaten from that destruction onwards & finally won the Super Bowl.
A few weeks ago Brady & Tampa Bay demolished Buffalo Bills in the first half. But Josh Allen and the Bills roared back in the second half to tie the game. Like Tampa Bay last year, Josh Allen & Bills have gone unbeaten since the destruction in Tampa Bay.
Saturday’s game was the 3rd game between Bills & Patriots with each team having won one of the two previous. Next game is the 3rd game against Kansas City after the two teams have gone 1-1 in the prior two games. Can Josh & Bills beat Mahomes & Kansas City in their home field like Brady did to his opposition last year? If so, we can again celebrate the जोश of जॉश.
Send your feedback to editor.macroviewpoints@gmail.com Or @MacroViewpoints on Twitter