Summary – A top-down review of interesting calls and comments made last week in Treasuries, monetary policy, economics, stocks, bonds & commodities. TAC is our acronym for Tweets, Articles, & Clips – our basic inputs for this article.
Editor’s Note: In this series of articles, we include important or interesting Tweets, Articles, Video Clips with our comments. This is an article that expresses our personal opinions about comments made on Television, Tweeter, and in Print. It is NOT intended to provide any investment advice of any type whatsoever. No one should base any investing decisions or conclusions based on anything written in or inferred from this article. Macro Viewpoints & its affiliates expressly disclaim all liability in respect to actions taken based on any or all of the information in this article. Investing is a serious matter and all investment decisions should only be taken after a detailed discussion with your investment advisor and should be subject to your objectives, suitability requirements and risk tolerance.
1.“bucking is dangerous“
And bucking is not just for horses:
- Ilia Sakowski, MBA@IliaSakowski – – $DXY HT @AlessioUrban
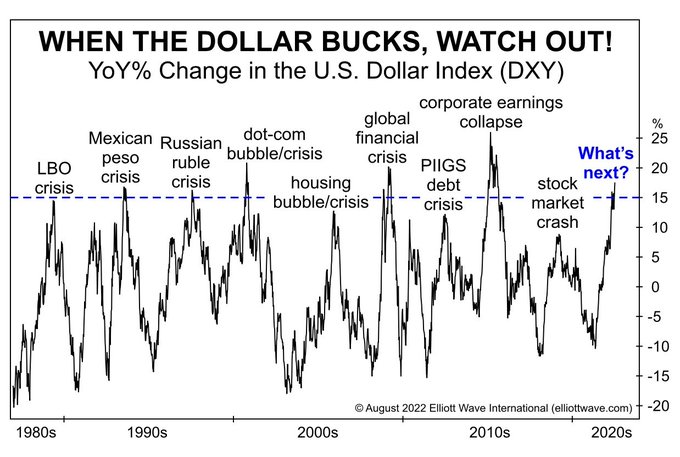
Hmm, but is DXY really bucking or merely cantering?
- Jason@3PeaksTrading – – $DXYDollar index starting to look strong from recent pullback pattern to 55 EMA. Could be headwind for stocks into rest of month after this week
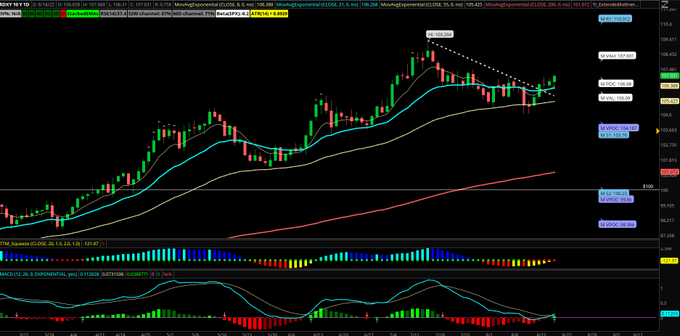


Look & notice that cantering has staying power that bucking does not. And staying power in currency terms is measured in months not days:
- Dijames23®@dijames23 – $DXY #Dollar Monthly chart
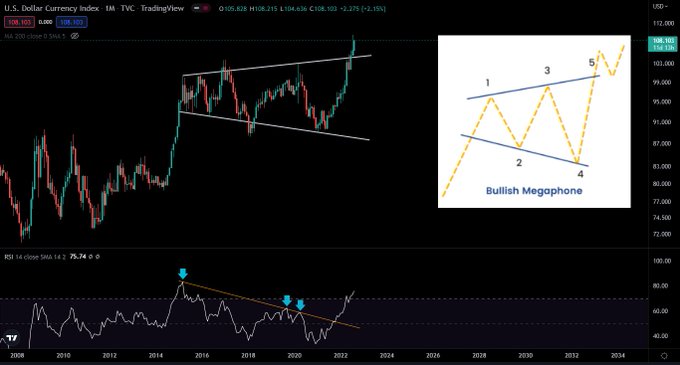
That brings us to the reality that the cantering strength of DXY is one of the major risks for financial markets. Because it shows that, while cyclical inflation might cool down, structural inflation might be taking hold in America.
Analogies apart, who is responsible for our cantering Dollar?
2. The other sides of the Dollar
The biggest other side is probably the Euro & that means Germany:
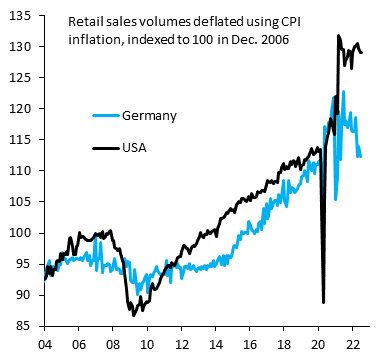
- Robin Brooks@RobinBrooksIIF – – The epicenter of the coming global recession is Europe, not the US. Real retail sales in Germany are down lots (blue), consistent with the sharp fall in consumer confidence, while US real retail sales (black) remain very strong. No recession in the US. But recession in Europe…
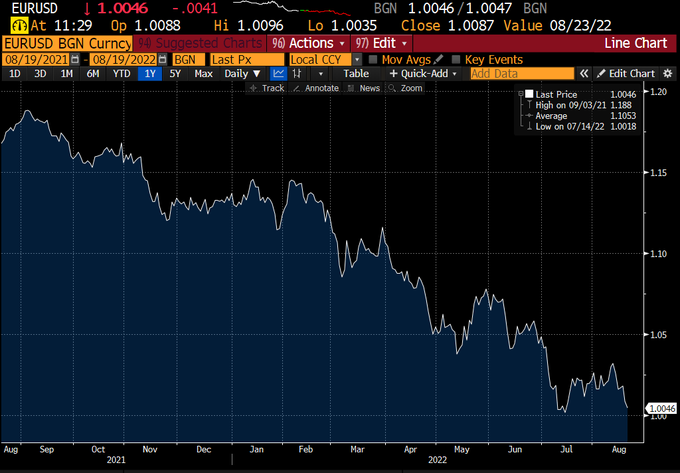
That presumably means:
- Robin Brooks@RobinBrooksIIF – – We’ve been forecasting that the Euro will go below parity since mid-March. Russia’s invasion of Ukraine is a body blow for the Euro zone, because the loss of cheap Russian energy upends the German growth model. A massive negative terms of trade shock that will drag Euro lower…
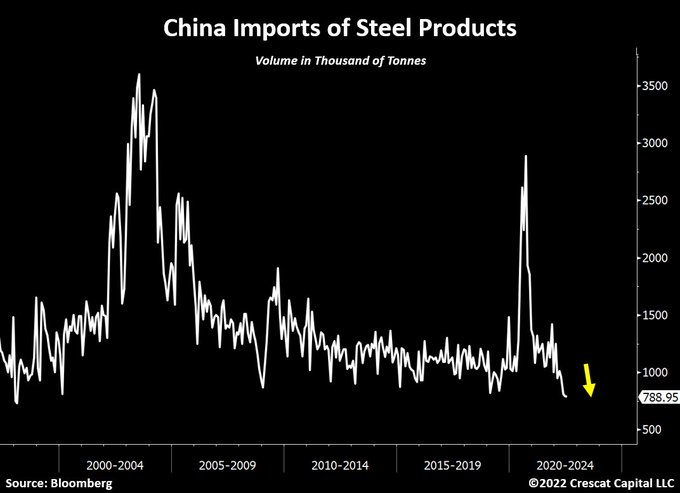
But we still got China on our side, right?
- Otavio (Tavi) Costa@TaviCosta – – China imports of steel products just are now at the lowest level in 24 years. A full-blown balance sheet recession unfolding. Further monetary easing likely ahead.
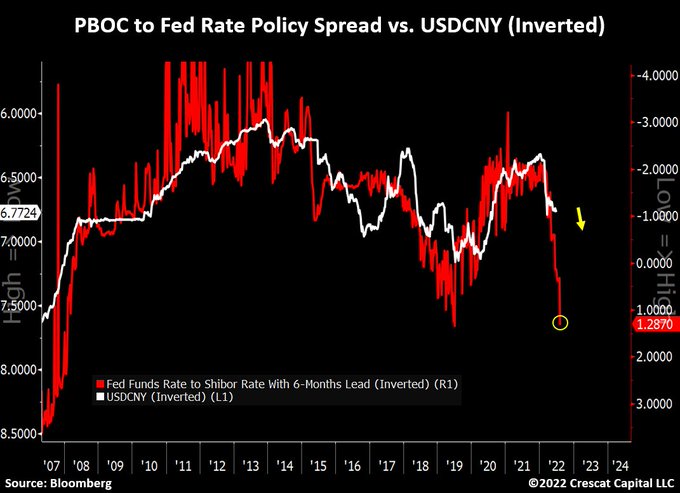
Does that mean the following?
- Otavio (Tavi) Costa@TaviCosta – – The Fed is tightening while the PBOC is easing. This interest rate policy spread has consistently led the changes in USDCNY by 6 months. Yuan still poised to devalue significantly from here.
If you had monies in Europe and China-influenced Asia, what would you do? Act like Columbus & come to America!
3. The U.S. leading indicators
Since every one is now blaming Powell for focusing on backward indicators, let us look forward to indicators that actually lead:
- Richard Bernstein Advisors@RBAdvisors – – LEADING #Indicator falls to 0%. Not a good #sign no matter how you spin it.
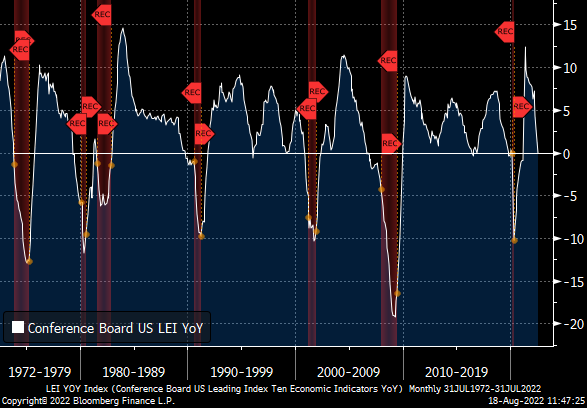
Hmm! Is Rich Bernstein moving towards his old colleague David Rosenberg?
But all this talk should be getting U.S. Treasury yields lower, right? That was the bad surprise this week:
- 30-yr yield up 11 bps; 20-yr up 12 bps; 10-yr up 14 bps; 7-yr up 14.5 bps; 5-yr up 14 bps; 3-yr up 9.5 bps; TLT down 2.1% & EDV down 2.2%.
That is mainly due to the force of rates shooting up in Europe due to inflation there, energy inflation. That was true in UK and worse in Germany with German 2-yr up 21 bps, German 10-yr up 24 bps & German 30-yr up 17 bps.
These rising yields in Europe are forcing up Treasury yields recreating the Q2-like problem for the Fed with rates going up as the U.S. economy slows.
4. Stocks
And a problem for Powell is a problem for stocks, right? At least that is how the stock market reacted this week. And U.S. credit too with HYG & JNK down 2.7% & 2.6% resp. on the week, worse than the fall in TLT. Naturally for the week,
- IWC (micro-caps) down 3.6%; Russell 2000 down 3%, Nasdaq down 2.6%, NDX down 2.4% with S&P down 1.2% & Dow only down 1.2%.
With Emerging market debt (EMB) down 3.7% on the week & the Dollar up 2.3% on the week,
- EEM was down 2.7%; FXI down 3.4%; ASHR down 3%; KWEB down 4.5%; EWZ (Brazil) down 2.5%; EWY (South Korea) down 4.8%; and commodity stocks like CLF down 10.5% & FCX down 4%.
Coming back to the U.S., Amazon was down 3.7%, Meta down 6.8%, GOOGL down 3.6%, Netflix down 3.3%, Microsoft down 2.1%. In contrast, Apple was only down 40 bps.
Stocks, especially NDX stocks, are beginning to follow the rise in Treasury rates and EM-Commodities are beginning to follow the Dollar. But there is an important indicator that is still complacent:
- jeroen blokland@jsblokland – – So why is FX (and bond) #volatility spiking again, but not equity volatility? What is driving FX and bond markets but not equity markets? Looks like a bit of complacency to me.
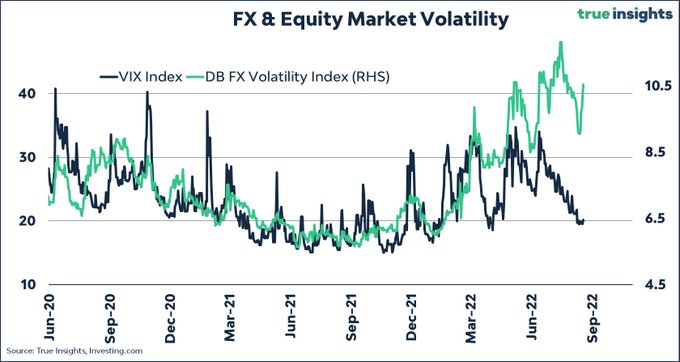
Yes, $VIX was only up 5.5% on the week but it was interesting to see that $VIX refused to break below 19 when it had a chance.
So what does a bullish voice say now, a voice that was steadfastly bullish in June?
- Macro Charts@MacroCharts – – A textbook rally from start to finish: •Every Core Model Buy & Macro signal from the last 2 months turned into a Sell this week. •Stocks which led up are now leading down. •Momentum turning lower… if one looks close enough. •Bears have been silenced. •Bulls run unchecked..
What about a picture?
- Macro Charts@MacroCharts – – Full reversal – from record Short to extreme Long. From max Fear to max FOMO.
Veteran technician Katie Stockton took it farther this week describing this market as a “bear market cycle“. She added that ” the setup makes you look very vulnerable to a breakdown … may be that is later in Q4 or we suspect the bear market cycle might last even into the 1st half next year; we are bracing for more downside “. Her targets? ” … if we were to see the S&P take out 3815 support, then the next level of support is around 3500 … “.
Carter Worth of CNBC Fast Money did not go as low as 3,500 but sees the S&P falling to 380-390 range. His charts are interesting to watch:
Stocks dropping today, with the S&P snapping a 4-week win streak. And if you're hoping to use options to play the next market move, @CarterBWorth & @Michael_Khouw have a way to do it! $SPY pic.twitter.com/vSnTD6bhTN
— Options Action (@OptionsAction) August 19, 2022
5. Commodities
With Dollar up 2.3% & appearing to break out and Treasury rates up hard, Gold & silver got hammered with Gold down 3% & Silver down 8.8%. Gold miners got hammered too with GDX & GDXJ down 7% & 9% on the week.
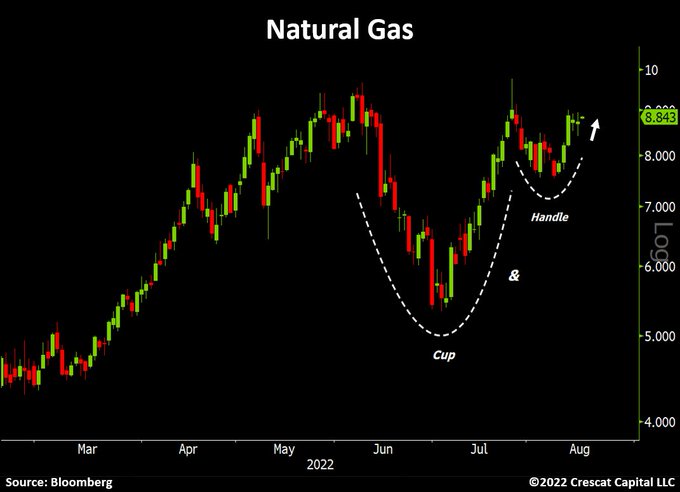
The commodity that shone the brightest was Natural Gas, up 6% on the week in the US.
- Otavio (Tavi) Costa@TaviCosta – – And once again today: Despite the selloff in commodities, nat gas had a strong close now looks ready to rip through its recent highs. This has the potential of reinforcing the inflation narrative.
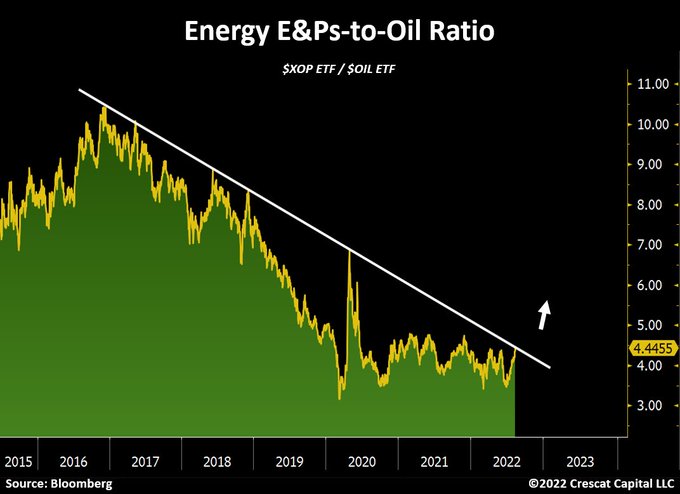
WTI was down 1.9% & Brent was down 1.9%. But XLE was up 1.2%. It may actually be a signal per the tweet below:
- Otavio (Tavi) Costa@TaviCosta – – Energy E&Ps-to-oil ratio now on the brink of a significant breakout from 5-year resistance.
Guess what, Buffet wins again!
Send your feedback to editor.macroviewpoints@gmail.com Or @MacroViewpoints on Twitter