Summary – A top-down review of interesting calls and comments made last week in Treasuries, monetary policy, economics, stocks, bonds & commodities. TAC is our acronym for Tweets, Articles, & Clips – our basic inputs for this article.
Editor’s Note: In this series of articles, we clude important or interesting Tweets, Articles, Video Clips with our comments. This is an article that expresses our personal opinions about comments made on Television, Tweeter, and in Print. It is NOT intended to provide any investment advice of any type whatsoever. No one should base any investing decisions or conclusions based on anything written in or inferred from this article. Macro Viewpoints & its affiliates expressly disclaim all liability in respect to actions taken based on any or all of the information in this article. Investing is a serious matter and all investment decisions should only be taken after a detailed discussion with your investment advisor and should be subject to your objectives, suitability requirements and risk tolerance.
1.”Trends gonna trend?”
A good summary of the two big scenarios ahead is below:
- Jay Kaeppel@jaykaeppel – June 3 – 2 scenarios:
1. The indexes keep rising, investors experience FOMO and start piling in, creating a broader rally.
2. Recession fears prove real and market sells off in anticipation.
As a trend-follower, am trading #1, watching price action closely in case of #2.
The only elaboration we might add is that we might get an economic slowdown that drives interest rates lower without getting a recession in a somewhat 1995 scenario. Of course, that would fit in the first case above.
A practical & sensible view of markets came from Rick Rieder on CNBC on Thursday & on BTV on post-NFP Friday. With apologies to both networks, we will combine his messages into one below. His basis tenet is that
- “there is a historic opportunity to build income & put that next to your equity portfolio; its pretty extraordinary“
He says for that you “need upside convexity” in equities and “tech is still the place to get it“. He adds that
- “there is an interesting flight to quality trade going on; big tech companies are delivering cash flow generation; its a flight to quality“,
- “issuance in fixed income – a trillion in T-bills in next 3 months; equity market not a lot of supply; people are short equities; if money just incrementally comes into the equity market thru 401-K, thru equity buybacks .. people are not long that’s why volatility is priced so cheaply ” the market just has a hard time going down … technicals in equities are amazing … “
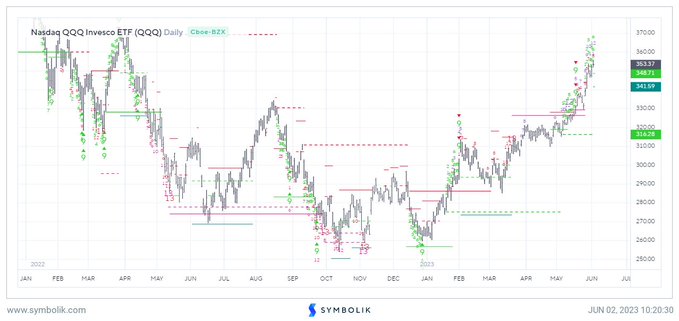
This is not just a talking mouth or a blogging head! He actually manages about $2.3 trillion in assets. That doesn’t mean he is always right but that his words deserve serious consideration. Especially when smart technicians don’t sense any real exhaustion yet:
- Mark Newton CMT@MarkNewtonCMT – Still no evidence of exhaustion in $QQQ nor $SPY While many have quickly tried to fade QQQ given “overbought” conditions & poor breadth, none of this matters until price signals it’s done moving higher– #FANG does NOT have to immediately show mean reversion lower, & lackluster… Show more
Remember Rick Rieder asking above “if money just incrementally comes” into the equity market? Should he have used past tense instead of future?
- Jesse Felder@jessefelder – ‘The S&P 500 is up more than 6% over the past three months, and retail investors are finally getting in on the action. Data compiled by @vandaresearch shows retail investors recently bought $1.48 billion in U.S.-listed stocks — a three-month high.’ https://www.cnbc.com/2023/06/01/retail-investors-start-to-join-stock-market-rally-data-shows.html?__source=newsletter%7Cproplaybook
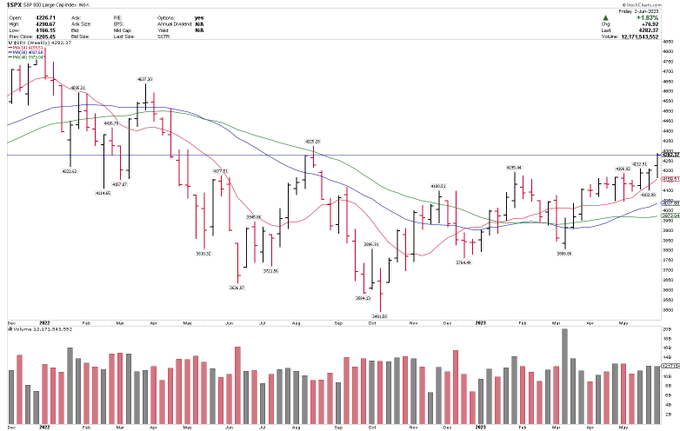
Clearly the stock market is running over the steadily crumbling walls of worries, like the debt ceiling fears this week. The S&P blew past the previous resistance of 4,200 on Friday. The big question is whether 4,200 now proves to be a floor instead of resistance?
- Larry Tentarelli, Blue Chip Daily@LMT978 – $SPX – Debt-limit resolution led to a strong weekly breakout to 4282. – Above average volume and in a 4-day week. – Weekly base breakout setting up well here.
Remember how the stock market sold off on Friday afternoons in the bear market after the 2008 crash? The message was with the potential of bad news few dared going long into the weekend.
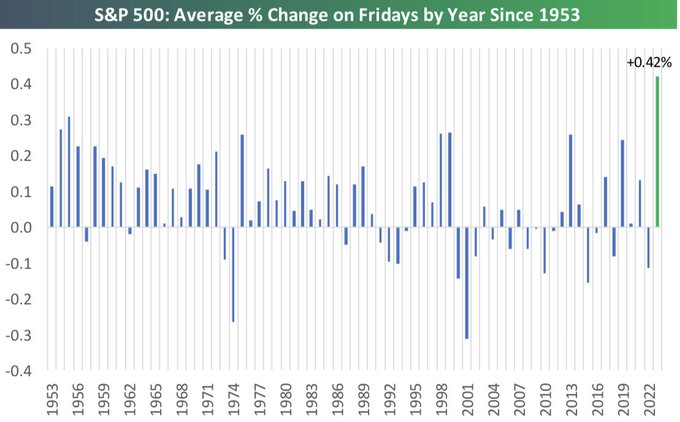
Is this year a mirror image? Actually not just a mirror image but a historic magnification?
- Bespoke@bespokeinvest – The market is having its best performance on Fridays of any year since 1953. So far this year, the S&P has averaged a gain of 0.42% on Fridays. Strength into weekends… Read more: https://bespokepremium.com/interactive/posts/think-big-blog/the-bespoke-report-remember-when-6-2-23
But is there a number that might suggest how historic 2023 might be?
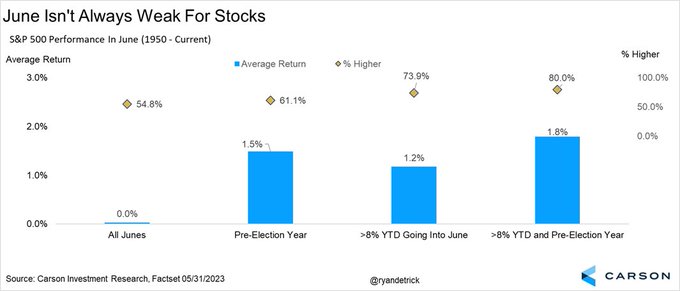
- Ryan Detrick, CMT@RyanDetrick – Yes, stocks don’t historically do too well in June, up 0.03% since 1950 and up 55% of the time. But when up >8% YTD heading into June? Things go to 1.2% and 74%. When up >8% YTD and a pre-election yr? 1.8% and 80%. Trends gonna trend.
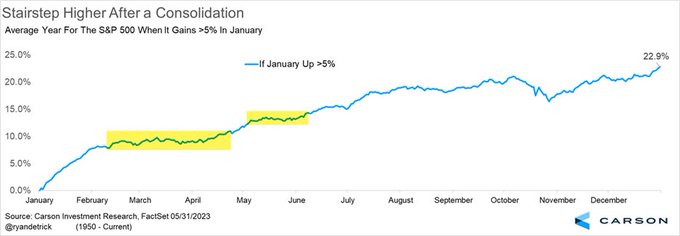
But don’t stocks consolidate in early June? So what happens then Mr. Detrick?
- Ryan Detrick, CMT@RyanDetrick – Another potential positive for June? Years that gain >5% in Jan (like ’23) tend to see consolidation most of May/early June, before a nice surge higher into July.
Ask & thou shalt receive?
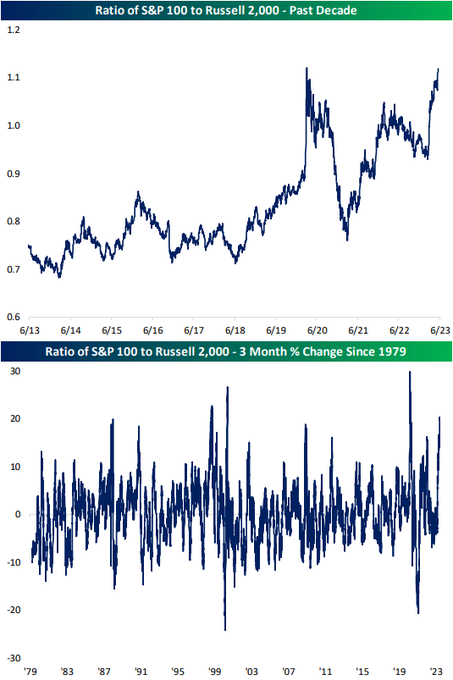
- Bespoke@bespokeinvest – June 1 – On one of the largest three-month gains on record, the ratio of the S&P 100 to Russell 2,000 is approaching the highest levels of the past decade. Read more in tonight’s Closer: https://bespokepremium.com/interactive/posts/think-big-blog/the-closer-small-caps-left-in-the-dust-pmi-update-construction-boom-6-1-23
Bespoke did receive on behalf of all of us on Friday! IWM rose 3.63% on Friday handily beating SPY up 1.45%. Even on the week, RUT was up 3.3% vs. SPX up 1.8%. Guess what happens in rallies after the Fed pauses as in 1991, 1994 & so on? RUT beats the heck out of SPX! But for that to even becoming a case, the following must hold:
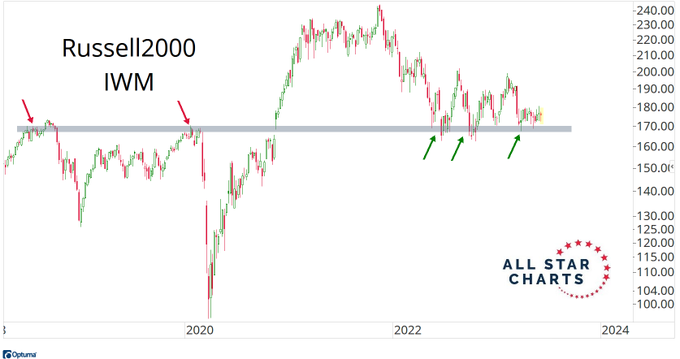
- J.C. Parets@allstarcharts – Small-caps: Former resistance from 2018 and 2020 turning into support since last summer
Neither we nor most folks know what will happen in the next 7 months. But one thing we KNOW and what we hope everyone now accepts that October 2022 low was the start of a new bull market.
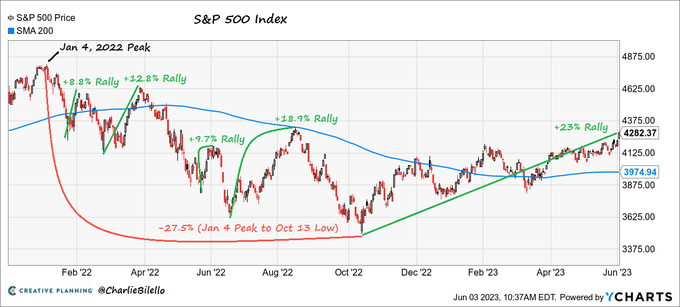
- Charlie Bilello@charliebilello – The S&P 500 has gained 23% from its low last October, the largest rally since the index peaked back on January 4, 2022. Highest level since last August. $SPX
Those who still call this a bear-market rally should change the definition of a bull market to up 30%.
What a week this was?
- VIX down 18.7%; Dow up 2%; SPX up 1.8%; RSP up 2%; NDX up 1.7%; RUT up 3.3%; IWC up 3.5%; DJT up 1.8%; EEM up 89 bps; AAPL up 3.1%; AMZN up 3.3%; NFLX up 5.6%; META up 3.6%;
Despite getting torched on Friday, Treasuries managed to have an up week:
- TLT up 88 bps; EDV up 1.7%; ZROZ up 1.5%; 30-yr yield down 8 bps; 20-yr yield down 10.5 bps; 10-yr down 11.5 bps; 7-yr down 10 bps; 5-yr down 9 bps; 3-yr down 10 bps; 2-yr down 7 bps;
2. Does the Chuck Daly dictum still work?
For those who don’t know or may not remember, Chuck Daly was the Championship Coach of the Detroit Pistons basketball team and the Coach of the World Champion American Dream Team at the 1992 Summer Olympics. His favorite dictum was “keep running a winning play until they figure out how to stop it“.
To us the dictum translated into June being the reversal month for Treasuries. In other words, if TLT (long-duration Treasuries) sold off hard into June, then the dictum said buy TLT in mid-June. Seems dumb but that was the wisdom of Coach Daly – as long as they don’t learn how to stop it, keep running it.
Look how well this performed in 2007 & 2008:
Now look at TLT, year-to-date:
Now read what we saw this week:
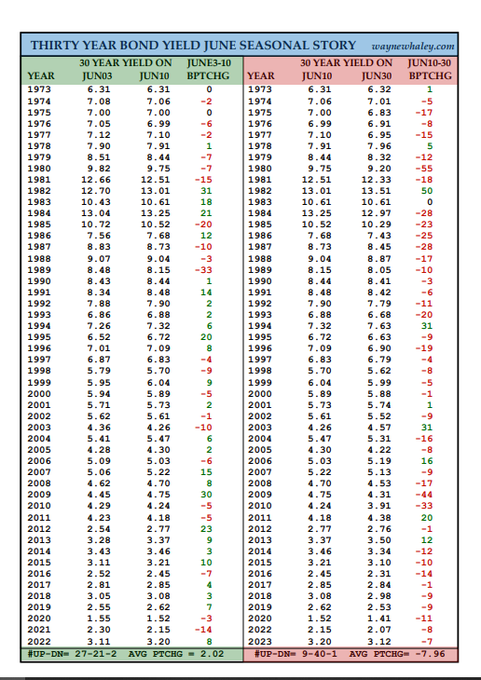
- Wayne Whaley@WayneWhaley1136 – 30 YEAR BOND YIELD JUNE SEASONAL STORY : June3-10 is historically the strongest week in June for yields then they tend to fall off a cliff, down June10-30 in each of the last 9 yrs and 30 of the last 40. Interestingly, equities normally get soft during that time frame as well.
A similar theme using moving averages:
- Shane C. Murphy@murphycharts – Treasury Bonds + 150-day MA – Over the last 10+ years, following a downtrend in T-bond prices, when the slope of the 150-day MA is this positive, we’ve witnessed a trend reversal. Small sample, n=2 so don’t hang your hat on it, but still notable IMO $ZB_F $TLT #longbond
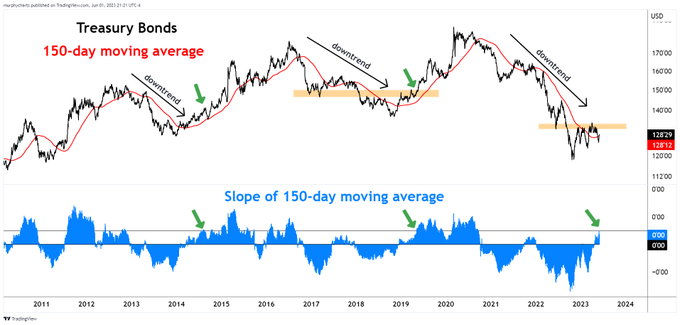
Nothing is given, of course! And the case of a rally in TLT (long-duration treasury bonds) does rest on a slower plateau in the economy or a pause in the Fed’s tightening campaign.
On this note, we highlight the interview of JPM’s Bob Michele on BTV Surveillance on Thursday, a day before the huge rally in stocks with cyclicals leading and the simultaneous large up move in Treasury yields. He reiterated his conviction that the entire Treasury yield curve will be at 3% by the end of September 2023 and intermediate term Treasury bonds will deliver double-digit returns (5-yr being his sweet spot) . He also reiterated his conviction that the US will be in recession by the end of 2023 & the Fed will cut rates in September 2023.
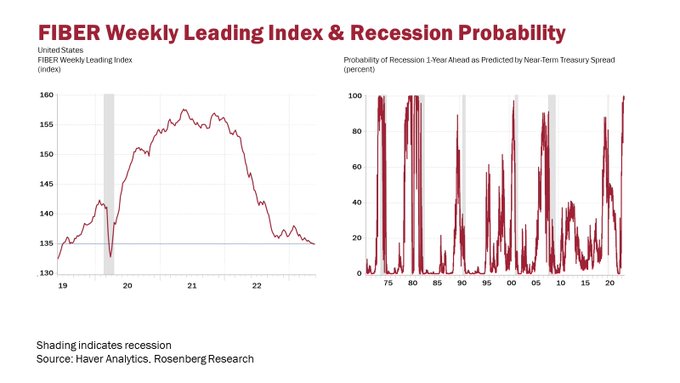
That might well be the case if David Rosenberg proves correct in his assessment of the 395,000 payroll report:
- David Rosenberg@EconguyRosie – Jun 2 – Investors don’t seem to realize that after accounting for the drop in hours worked, it’s as if the economy lost 140k jobs in May. In the Jan-May period, the index of aggregate hours worked is negative and that is a sure-fire recession signal.
He also scoffed at his critics with the end result of the “boy who cried wolf” parable:
- David Rosenberg@EconguyRosie – Jun 2 – Markets pricing in a ‘soft landing’? Will they ever be in for a big surprise. The boy cried wolf, indeed, but the wolf did show up at the end of the story.
3. Commodities
The Dollar shot up higher on Friday after the NFP report. But on the week UUP closed down 7 bps & DXY down 16 bps and:
- Gold up 92 bps; GDX up 3.1%; NEM up 3%; Silver up 1.5%; Copper up 1.6%; CLF up 5.2%; FCX up 7.7%; Oil down 1.1%; Brent down 84 bps; Nat Gas down 86 bps; OIH up 4.7%; XLE up 1.4%; PBR up 2.1%;
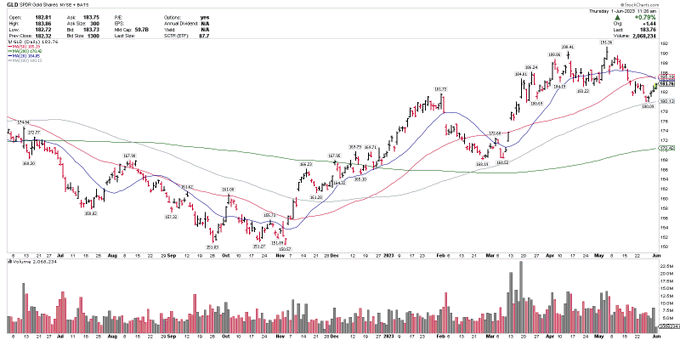
Regarding Gold,
- Larry Tentarelli, Blue Chip Daily@LMT978 – June 1 – $GLD getting back on track with debt ceiling deal. Held 180 support & 100-sma on pullback. Back > 186 would improve the chart. LT uptrend intact.
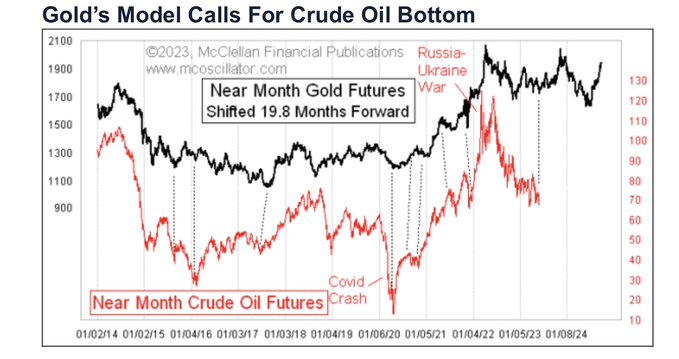
What about oil?
- Hedgehog Trader 🦔@HedgehogTrader – Tom McClellan: Gold’s Model Calls for Crude Oil Bottom. His view is gold tends to lead oil’s action by 19-20 months. If this holds true, he then projects a potential Nov 2023 oil top, followed by a “meaningful” early 2024 decline into a bottom in May-Aug 2024. $GOLD $WTIC
What about Copper? In case you have not heard of him, there is a man on CNBC named Jim Cramer. One of his better contributions to viewers is his series of “off the charts” clips. These are relays of views of his techni-pals on a variety of asset classes. This past Tuesday (May 30), Cramer discussed the views of Carley Garner about Copper.
Readers know that CNBC webmasters don’t share our positive views of these “off the charts” clips. That is why we could not locate the above clip to provide a link to readers. Below are our hastily scribbled points which should be confirmed for accuracy with Cramer and/or CNBC:
- ” new call $3.60 = floor of support; we are at fulcrum level of the commodity; July copper futures due for a rebound similar to middle of last year; … COT large speculators are crowded on the negative side as shorts; … late June bottom … “
The above was aired on Cramer’s Mad Money on Tuesday evening and Copper was down about 54 bps on Tuesday. So if you listened & bought, say FCX on Wednesday morning, then you were up 7.7% by Friday. How many other CNBC clips gave you that performance this week?
What we don’t get is that other CNBC shows refuse to highlight these Cramer videos? Are they jealous or they are under strict orders to not mention these? Guess CNBC still prefers to highlight “cautiously optimistic” type money managers that use CNBC to market themselves instead of adding value to viewers!
4. India
First & foremost, our prayers go out to families which suffered in the horrific train crash in north-western coastal region of Odisha. Reportedly almost 300 people died in the crash shown below:

What is the status now?
- ANI@ANI – Jun 4- #OdishaTrainAccident | Balasore: Both tracks have been restored. Within 51 hours the train movement has been normalised. Train movement will begin from now: Railways minister Ashwini Vaishnaw
On a different note,
- BQ Prime@bqprime – – India’s #GDP grew by 6.1% in Q4FY23. For the latest news and updates, visit: bqprime.com
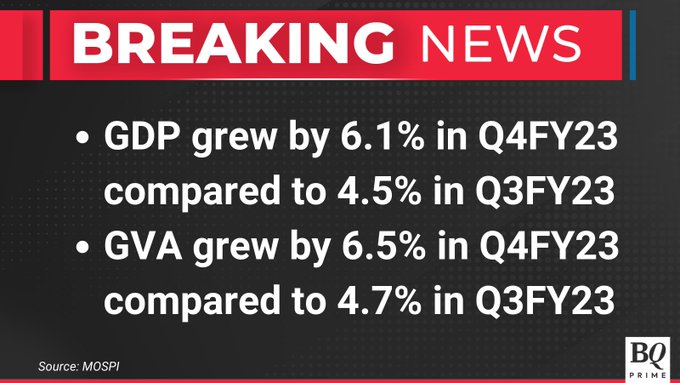
David Rosenberg highlighted this in his Wealtheon clip saying “India – great demographics & arguably the strongest GDP growth on the planet“.
People like CNBC FM who only bring up India as a market for Apple of 1.4 billion people might want to look at the following (hopefully accurate) statistics published by 4 newspapers:
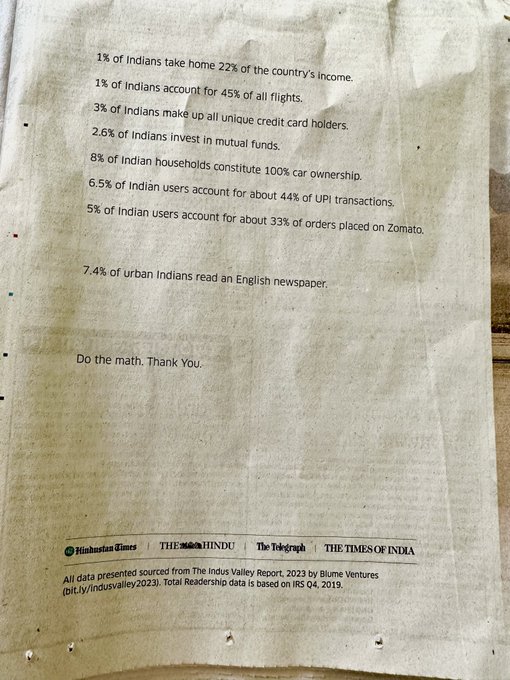
This may explain why we consider growth in income as the most important parameter for India’s growth. Imagine that India is near becoming the 3rd largest economy in the world with the above statistics. Where could India go as incomes grow steadily and the above percentages merely double?
A more amazing fact is that the growth delivered pre-curing-post Covid was generated without a steep rise in inflation. That is because PM Modi is an inflation-hawk, according to Ridham Desai, Managing Director at Morgan Stanley India. What he pioneered after becoming PM in 2014 was creation of a huge number of free bank accounts for the poor & the low-income class and instead of delivering cash to the poor, he delivered food through these accounts.
The clip also points out that funds for educating daughters of the low-income parents were delivered via QR codes that could only be used for school tuition. Desai points out that such financial aid does not create inflation that most countries faced last year from Covid stimulus.
The clip below might be a first for us in that it is a CNN clip – actually a CNN-TV 18 clip, TV 18 being the local CNN, CNBC, Viacom affiliate. Any one who invests in India should watch this clip:
Send your feedback to editor.macroviewpoints@gmail.com Or @MacroViewpoints on Twitter