Summary – A top-down review of interesting calls and comments made last week in Treasuries, monetary policy, economics, stocks, bonds & commodities. TAC is our acronym for Tweets, Articles, & Clips – our basic inputs for this article.
Editor’s Note: In this series of articles, we include important or interesting Tweets, Articles, Video Clips with our comments. This is an article that expresses our personal opinions about comments made on Television, Tweeter, and in Print. It is NOT intended to provide any investment advice of any type whatsoever. No one should base any investing decisions or conclusions based on anything written in or inferred from this article. Macro Viewpoints & its affiliates expressly disclaim all liability in respect to actions taken based on any or all of the information in this article. Investing is a serious matter and all investment decisions should only be taken after a detailed discussion with your investment advisor and should be subject to your objectives, suitability requirements and risk tolerance.
1.A”new sense of relief”? A wish coming true?
Remember what we wrote last week in our Section 2 “one hurdle in march for“:
- “Frankly, we would rather be surprised by Bonds moving UP and Stocks moving Up as things are supposed to be at least for Tech & EM stocks.”
That’s what happened this past week. And what’s more “Tech” than Semis?
- Larry Tentarelli, Blue Chip Daily@bluechipdaily – Fri- Massive breakout moves in semis. The exact group that we want to see leading. $NVDA $AMD $SMH $TSM
When did Semis break out last week? SOX was up 124.32 or up 2.7% on Thursday and up 202.66 or up 4.29% on Friday. Did this breakout have anything to do with the “one hurdle” getting crossed?
The numbers at 8:30 am on Thursday did put a bit of a wind in the TLT sails. But look how TLT rallied vertically upon hearing the PMI numbers on Friday at 10:00am. What did the TLT rally mean for SMH? Look in the chart below for the SMH rally on Friday:
Last week, Neal Dutta of Renaissance Micro touched on a “productivity boom” ahead of us. This week, he spoke about inflation:
- “inflationary impulse in the labor markets are fading; we also know that productivity is picking up; unit labor costs have come under some control; so to me that kinda sets the table for the direction of inflation; yeah, January is a bad month; but talk to me in the spring; I wouldn’t be surprised to see things like March-April core inflation coming weaker than expected“
Yeah but, don’t you need buyers to come in for TLT to rally?
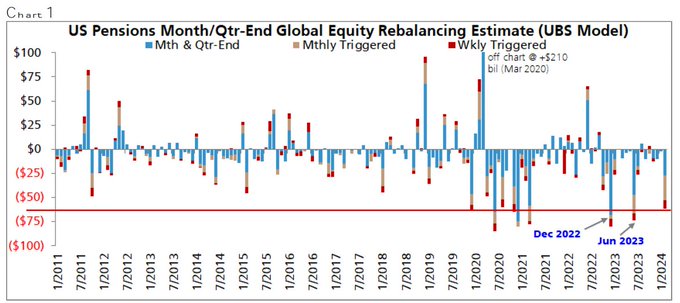
- Seth Golden@SethCL – Sat – UBS: Here come bond buyers of last resort! “Pension rebalance expected to be a detour, not an end game; dip buying opportunity. Current rebalancing ~$62bil of equity selling / bond buying… largest selling since Dec 2022 ($80 bil) & Jun 2023 ($74 bil)” $SPX $SPY $TLT $QQQ $DIA
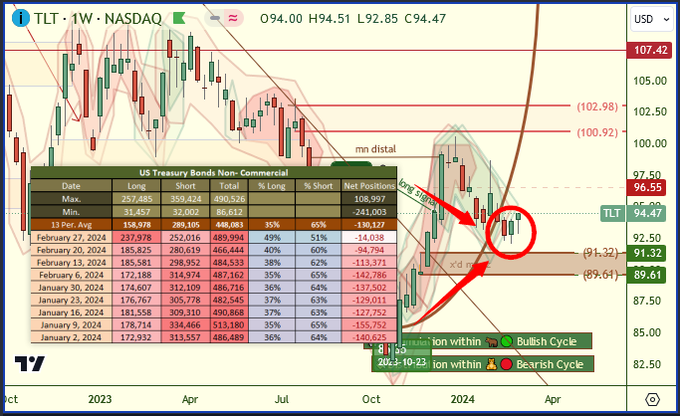
What price does TLT have to exceed for confirmation?
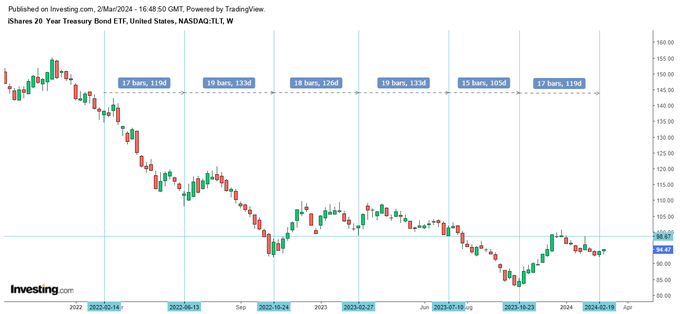
- CyclesFan@CyclesFan – Friday – $TLT – Potentially made a 17 week cycle low last week. Some of these cycle lows have only been small bounces during the vicious bear market that ended in October, but I expect the current cycle to be bullish so in order to confirm the low TLT has to surpass 98.67.
Then we saw the below with the accompanying chart:
- CFTC Trading Mastery@WhiteOakFX – 🎩 30 ❤️’s has 🔓 unlocked this analysis, thank you. $TLT #Bonds just saw a massive increase in 🟢 long positions by the BIG 💰 MONEY 👉 From 185k to 237k and 🔴 shorts were reduced from 280k to 252k. They are serious now. …….
Ok, but did anyone see any trades being put on?
- Jason@3PeaksTrading – Wed – Treasury $TLT with 3000 July $97 ITM puts sell to open at $5.35 as March short puts adjust out. Also a large opening seller of 2500 January $93 puts for $4.79, strong confidence in lower rates this year
Now for the final & most interesting of observations we saw this week. If right, might the bulls say to the bears – “you ain’t seen nothing yet“.
- jeroen blokland@jsblokland – Sat – This is one of the biggest charts that makes me believe we actually got a US #recession, but that #NBER forgot to call it. Real disposable income without government transfers is rising at a very healthy pace. But income growth was negative for most of 2022, when the US economy recorded two quarters of negative #GDP growth. If this is the case, we are at the START of the economic cycle with lower #FederalReserve rates as a welcome catalyst.
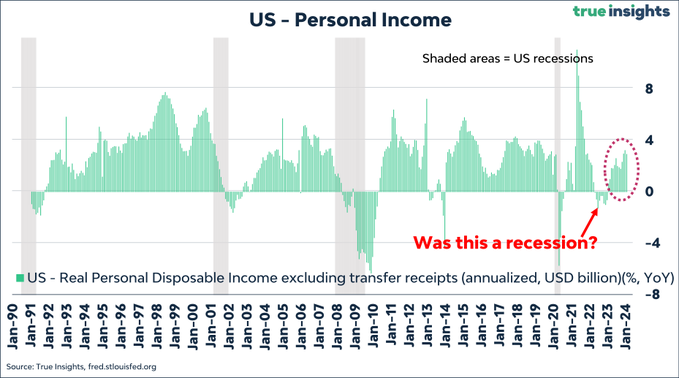
What if the above turns out to be true? When was the last time we saw a recession end after a big Fed-rate cycle and a new economic cycle begin? Wasn’t it 1995 when both Stocks & Bonds rallied? How did SPY do in the Jan-Feb 1995 period?
Not entirely unlike this year?
What do you think when you hear 1995? The surge in use & talk of technology, then called TMT. That led to a surge of productivity as RenMac pointed out last week. Is AI beginning to have that kind of influence on the markets? Mary Ann Bartels pointed this out to CNBC’s Andrew Ross Sorkin this week and said:
- “we are getting huge base breakouts – saucer breakouts ; we are seeing these across the markets & these are over large trading periods in some cases a year which means there is a significant upside potential for this market; so we raised our target for the market to 5,400 to 5,800 (from 5200-5400)”;
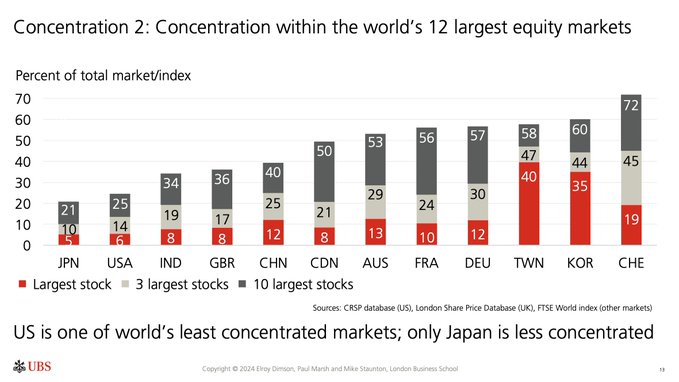
That view, among others, have raised concerns about the US stock market being very concentrated. A highly erroneous view, according to:
- Holger Zschaepitz@Schuldensuehner – Wed – For all the talk about the Mag7 and the ultra-reliance of just a handful of companies to drive stock-market returns, it turns out the US is in fact one of the least concentrated markets in the world. That’s acc to the latest findings of the global investment returns yearbook, by Paul Marsh and Mike Staunton of London Business School. Only Japan is less concentrated. https://morningstar.com/news/marketwatch/20240228181/it-turns-out-the-us-is-one-of-the-least-concentrated-stock-markets-in-the-world
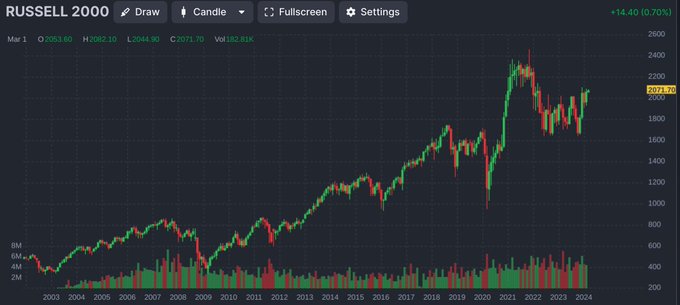
Getting back to 1995, what asset class came back to life & a rally in 1995, perhaps in response to the bond rally?
- Markets & Mayhem@Mayhem4Markets – Sun – The Russell 2000 has been coiling up for years. When it breaks out of this range, it’s going to make a big move, and it’s looking more and more like that move may be to the upside in the small cap index.
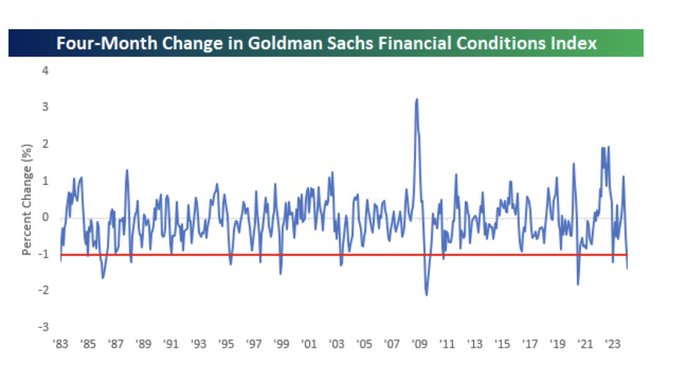
Does the market actually need Fed rate cuts given the easing of financial conditions already seen?
- Lisa Abramowicz@lisaabramowicz1 – “The total cumulative easing over the past four months ranks as one of the most significant periods of relaxing financial conditions since at least 1982:” @bespokeinvest
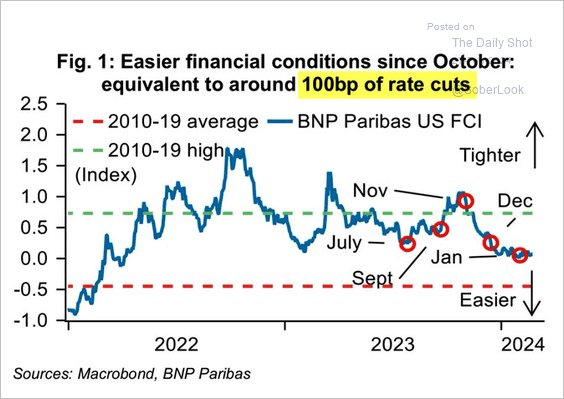
How many rate cuts might that be?
- Jesse Felder@jessefelder – Tue – ‘The easing of US financial conditions equates to approximately 100 basis points of rate cuts.’ https://thedailyshot.com/2024/02/27/lower-tier-homes-see-the-largest-price-gains-in-january/ via @SoberLook
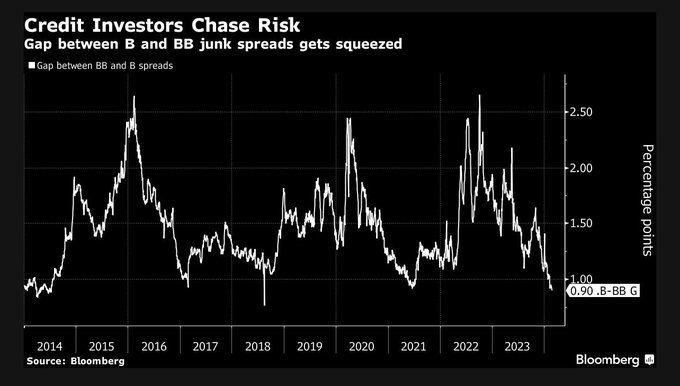
Any evidence of froth in the credit market, with this amount of easing of financial conditions?
- Lisa Abramowicz@lisaabramowicz1 – Tue – Lower-rated junk bonds are rallying more than higher-rated ones, evidence of just how risk-on this credit rally has been. The gap between BB and B rated bonds “has fallen the least since 2014 (ignoring what looks like a fat-finger kink in our data during 2018):” @jtcrombie
How is Fed viewing the “frothy” action in credit & stock markets? We will find out on March 20. There was another year in which Treasury rates fell in January, rose in response in February & fell back from last week of February to about 3rd week of March. Below is the chart of 10-yr yield in that unforgettable year numbered 2008.
What if the Powell Fed responds to the froth in markets by being gently taciturn leading to a rise in Treasury yields and reiterating that stance on May 1? Might that lead to a real spike in Treasury yields into the June 12 FOMC? Then wouldn’t the Feb-July 2024 10-yr yield chart look kinda like the above Feb-July chart of 2008?
2. On the other hand
Two weeks ago, Jeff DeGraff said on his Saturday podcast,
- “I don’t look at this market at 79% as dangerous momentum market … what we saw this week was a snap-back from the Tuesday weakness … we are at 79% percentile; we will alert clients when we get to the 90% percentile“
Based on what he said this week, that 79% percentile has risen to 87%. Presumably, this means be more alert for getting out or hedging? That brings us to:
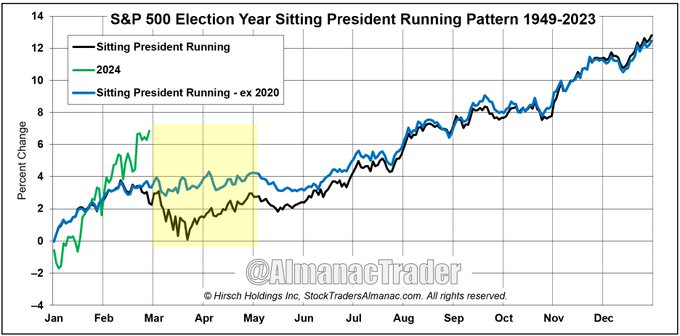
- Jeffrey A. Hirsch@AlmanacTrader – Mar 1 – Ex-2020 S&P 500 Flatter Election Year March
But after 4 months of solid gains the market is poised for a modest pullback of maybe 3-6%.
S&P 500 Support: 4800 old ATH.
Craig Johnson of Piper Sandler also sees the market vulnerable to a correction of about 10% to 4,600 beginning soon unless the financial, health care sectors in RUT start acting strong in a “broadening” move.
And,
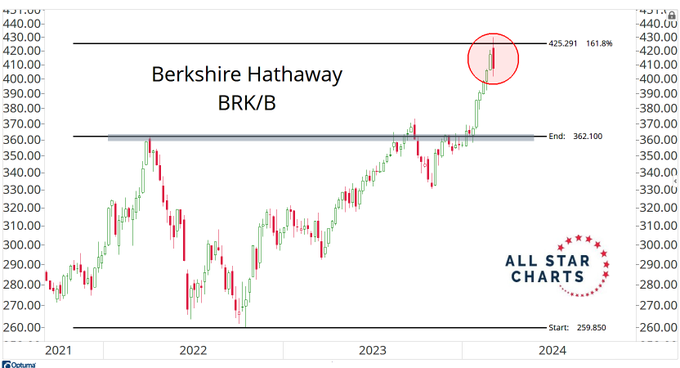
- J.C. Parets@allstarcharts – Fri – How about that weekly candle in Berkshire. Right at the 161.8% extension of the 2022-2023 base. Probably not a coincidence.
Finally, on the other hand of the first other hand,
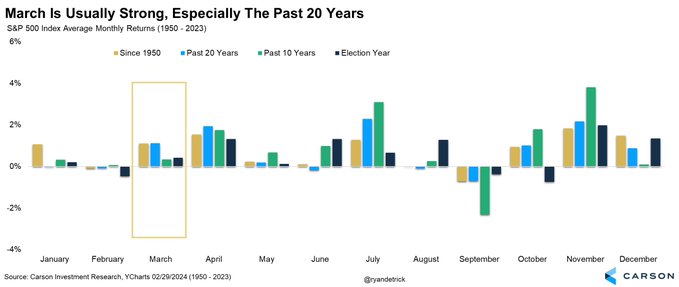
- Ryan Detrick, CMT@RyanDetrick – Mar 1 – March is the 5th best month overall and 4th best the past 20 years. After Feb >5%? Higher 5 out of 6 times since 1950.
3. Last week in markets
US broad indices did well in inverse order of market cap:
- VIX down 4.8%; Dow down 11 bps; SPX up 1.1%; RSP up 1.2%; COMPX up 1.7%; NDX up 2% SMH up 6%; RUT up 2.9%; IWC up 4.1%; DJT down 55 bps;
US sectors;
- AAPL down 1.7%; AMZN up 1.9%; GOOGL down 4.7%; META up 3.8%; MSFT up 1.3%; NFLX up 6.3%; NVDA up 4.4%; MU up 11.3%; BAC up 1.4%; C down 75 bps; GS down 96 bps; JPM up 78 bps; SCHW up 3.1%; IBKR up 3.3%; KRE down 88 bps; IBN up 2.8%; HDB up 1.6%;
Dollar flat to down 6 bps;
- Gold up 2.3%; GDX up 2.6%; Silver up 1.9%; Copper down 34 bps; CLF up 4.4%; FCX down 2.3%; Oil up 4.1%; Brent up 2%; OIH up 1.4%; XLE up 1.4%;
- ACWX up 44 bps; EEM down 25 bps; FXI down 91 bps; KWEB up 35 bps; EWZ flat; EWY down 35 bps; INDA up 25 bps ; EPI down 47 bps; SMIN down 35 bps;
Treasury yields down:
- 30-yr down 4.7 bps; 20-yr down 5.9 bps; 10-yr down 7 bps; 7-yr down 9.1 bps; 5-yr down 11.6 bps; 3-yr down 12.5 bps; 2-yr down 15.7 bps; 1-yr down 5.3 bps;
- TLT up 61 bps; EDV up 1%; ZROZ up 1.2%; HYG down 18 bps; JNK down 30 bps; EMB up 32 bps;
4. “Everything coming together for India Now” –
That is the title of a 25-minute CNBC interview with Jenny Johnson, President & CEO of Franklin Templeton. Again we are glad CNBC-India is putting their on-air interviews on YouTube now. Calling this India’s decade, Ms. Johnson shows her depth about India & Indian markets.
What seems unique with India is how different sections in India have built different specialized skillsets that have lasted & built wealth over generations. The mainly urban class have done so for 1-2 generations via high education & careers in large technological companies & investment banks. The traditional business community was somewhat absent in these sectors. But now their younger generation is marrying their family skills in business with their technological-investment experience to build startups & generate wealth faster. The result is a boom in luxury housing.
Check out the clip above between minutes 3:55 to 4:00 to see a big & lasting difference between these young wealthy & their parents. Their parents/uncles used (& still do) decorate their homes with European fashion. The younger set, as you can see, have all-Indian paintings & artifacts & that trend, we think, will accelerate.
To shift to a more localized level, you have the diamond trade:
- Anurag Shukla@Anuraag_Shukla – Feb 29 – Jains from Palanpur, Gujarat now dominate diamond business in Antwerp and have taken over the Orthodox Jewish community. So how did followers of a faith based on moderation and non-attachment come to dominate this most glittery of professions? https://www.aljazeera.com/features/2023/12/2/diamonds-are-in-my-blood-the-jain-jewellery-traders-of-antwerp

Now go from these traders in Antwerp to see the new Diamond Bourse in Surat, India:
Then you have the Civilizational Bond between India & South East Asia that is beginning to be generate geopolitical advantages for India. Sri Lanka spokesman highlighted this as they chose India for a specific purpose over China saying that both countries are important allies but only India has a civilizational bond with Sri Lanka.
And today, March 3, 2024 marked the end of ceremony at the hallowed grounds of Sanam Luang. The Indian Government sent Holy Relics of Lord Buddha to be enshrined with his two disciples, Arahata Sariputra, Arahata Maudgalayana at the Sanam Luang, a unity achieved after 2,500 years. What other country can give such an ancient & Holy gift?
As Indian financial & military power increases, there will be a greater focus on the Civilizational bonds between India & South East Asia. That, in itself, is likely to enhance interest in Multinationals (both business & military) in locating in India as a hub for operations from Emirates near the Straits of Hormuz to the ASEAN region & Malacca Straits. All this is input for a 10-year benefit for India & Indian markets.
Now for the short-term, it appears that $IBN (US ADR for ICICI Bank) is breaking out, both individually & relative to INDA.
Send your feedback to editor.macroviewpoints@gmail.com Or @MacroViewpoints On X.