Summary – A top-down review of interesting calls and comments made last week in Treasuries, monetary policy, economics, stocks, bonds & commodities. TAC is our acronym for Tweets, Articles, & Clips – our basic inputs for this article.
Editor’s Note: In this series of articles, we include important or interesting Tweets, Articles, Video Clips with our comments. This is an article that expresses our personal opinions about comments made on Television, Tweeter, and in Print. It is NOT intended to provide any investment advice of any type whatsoever. No one should base any investing decisions or conclusions based on anything written in or inferred from this article. Macro Viewpoints & its affiliates expressly disclaim all liability in respect to actions taken based on any or all of the information in this article. Investing is a serious matter and all investment decisions should only be taken after a detailed discussion with your investment advisor and should be subject to your objectives, suitability requirements and risk tolerance.
1. “its growthy out there“
That or words to that effect was the description from Lloyd Blankfein this week and his “base case is this can keep going“. Richard Bernstein has said this for awhile and added after Wednesday’s data:
- Richard Bernstein @RBAdvisors – Jan 18 – Indust Prod & Cap Util both stronger than expected. Are you still focusing on income instead of growth?
Then came Thursday’s strong data with:
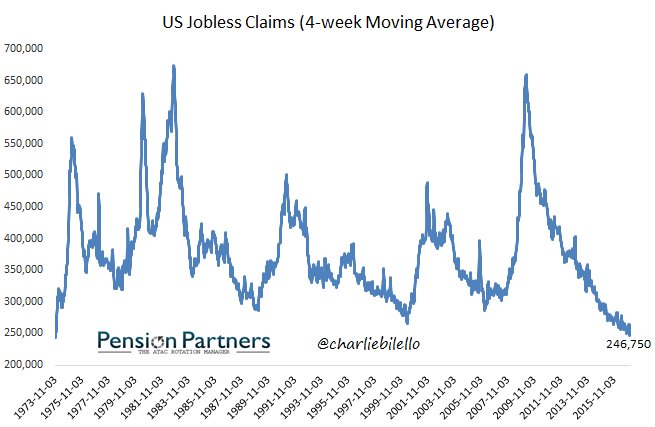
- Charlie Bilello
@charliebilello US Jobless Claims hit their lowest level since… November 1973 A 43-Year Low…
 But some are not convinced:
- David Rosenberg on Friday – Ongoing divergence between hard and soft data – Once again, we were served with a slate of data yesterday that provided a buoyancy read in terms of the “soft” sentiment surveys while the “hard” activity figures were a general disappointment
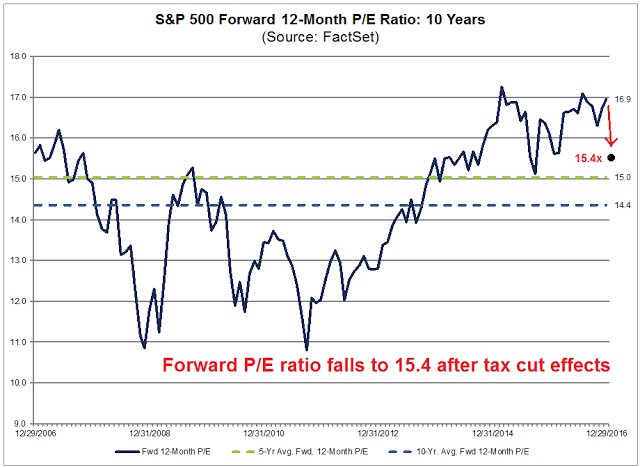
May be, the hard data is waiting for something, the same thing valuation is waiting for:
- Cam Hui, CFA @HumbleStudent – Jan 17 – An oldie but goodie: Top-down meets bottom-up: How expensive are stocks? $SPX $SPY http://buff.ly/2jyS3mI
2. Rates
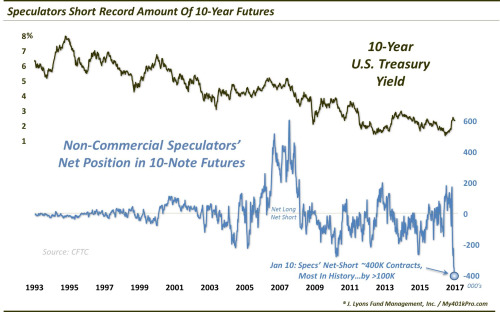
The data did not seem to be a disappointment to growth bulls & rate bears. Treasury yields which had come down hard on Tuesday (possibly due to Mr. Trump’s interview over the weekend) rebounded the rest of the week. And the Treasury curve steepened with long yields up 6-7 bps while 2-3 year yields up 1 bps to flat. Even the back up of 6-7 bps seemed tame compared to the perceived strength of the data. May be that refusal of yields to shoot up is simply due to the massive short position in long duration Treasuries. The short position is so large that some have begun calling it a bullish tailwind:
- Dana Lyons @JLyonsFundMgmt – ICYMI>ChOTD-1/17/17 A Huge Potential Tailwind For Bonds? $IEF $TNX Post: http://jlfmi.tumblr.com/post/1
56010974775/a-huge-potential-t ailwind-for-bonds …
 Mr. Lyons wrote:
- we find that Speculators have pulled a 180 [from July 2016] and now hold their largest net-short position of all-time – by a lot. At a net-short position of nearly 400,000 contracts, it is more than 100,000 larger than any other in history.
- A short-squeeze is only unleashed by rising prices. Therefore it will take a convincing bounce in bonds in order to persuade these folks to unwind their shorts. As we mentioned last week, a break below the current level in the 10-Year yield, near 2.33%, may indeed result in a sizable pop in bond prices and spur the aforementioned unwind.
- Thus, this 10-Year test continues to be perhaps the most compelling development across the financial markets at this time.
The 2.33% level was broken at the close on Tuesday; even the 2.30% level was broken intraday on Tuesday morning. The rebound took the 10-year yield above 2.50% on Friday morning even though it closed at 2.47%. Remember the FOMC meeting is less than two weeks away and yields have tended to rise before FOMC meetings since last fall.
What about a fundamental or economic reason to like long duration Treasuries? Lacey Hunt of Hoisington Management pointed to Velocity of Money this week to Bloomberg. In fact, he says “the rout since the election of Donald Trump is just a bump in the road for an extended rally“
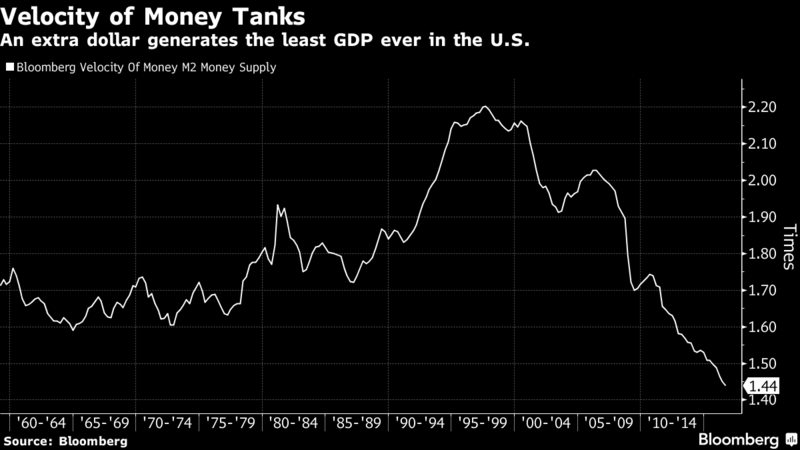
- “When debt is at high levels and increasingly counterproductive, the most important lesson of economic history is that the velocity of money falls,” said Hunt said, who helps manage $3.6 billion in assets. “I’m still long bonds, especially the long-end,” the part of the yield curve that’s the most sensitive to rising inflation.
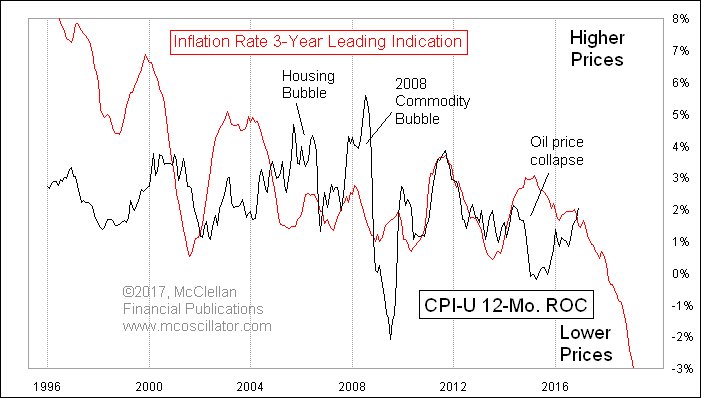
Speaking of inflation:
- Tom McClellan
@McClellanOsc – I’m not too worried about “highest inflation in 5 years”. It’s just rebound from oil collapse. Leading ind. says downward trend resumes.
So we have the potential of a huge short squeeze, velocity of money fundamental reason & possibility of inflation coming down. So why wouldn’t every one jump into the 30-year T-Bond? One reason might be the expectation of President Trump beating expectations & taking decisive steps to raise the growth rate of the economy. Second reason might be fear of what the FOMC might say or do on February 1. And the third could simply be the wisdom of Captain Bart Mancuso of the submarine USS Dallas in the movie Hunt for Red October – “the hard part about playing chicken is knowing when to flinch“
[embedyt] http://www.youtube.com/watch?v=OEiHxV2JuPw[/embedyt]
One such “when” might be just before the FOMC meeting on Feb 1 on the expectation of a milder than expected FOMC statement & the potential of a weaker than expected NFP number on February 3. Of course, that is simply speculative license on our part.
3. Stocks
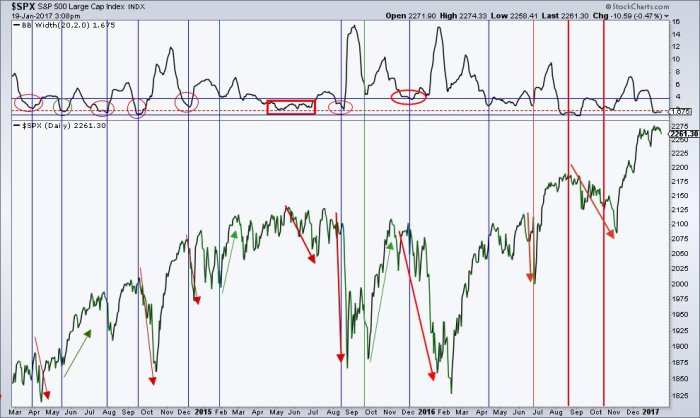
We have gone through weeks of choppy market. Is that a healthy consolidation or is it a prelude to a decline? Given the fall in volatility, contraction in Bollinger Band width etc., one conclusion could prove right:
- Peter Atwater @Peter_Atwater – Sure feels like we’ve once again reached another “Trump equals lady or tiger” market moment. Up or down, next move feels big.
Being two-handed, we can take a look at both sides. But in which order?
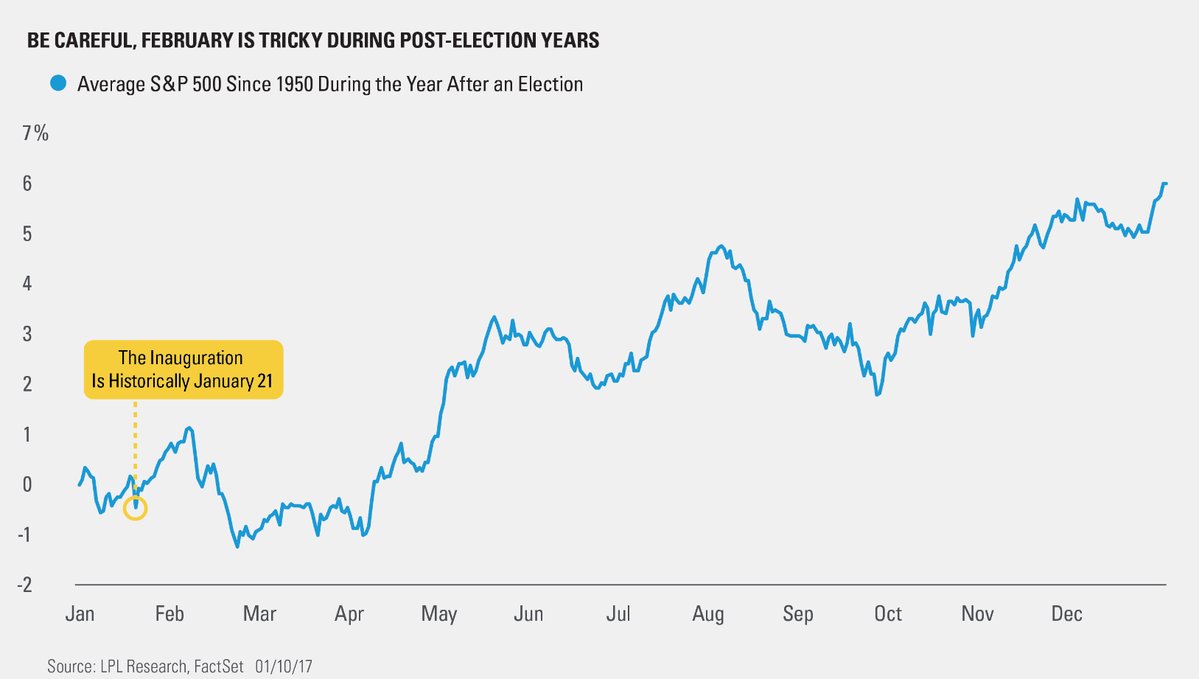
- Ryan Detrick, CMT
@RyanDetrick – Could there be a post inauguration sell-off? History says#SPX bounces for two weeks, then the big drop is in Feb. https://lplresearch.com/2017/01/11/could-there-be-a-post-inauguration-sell-off/ …
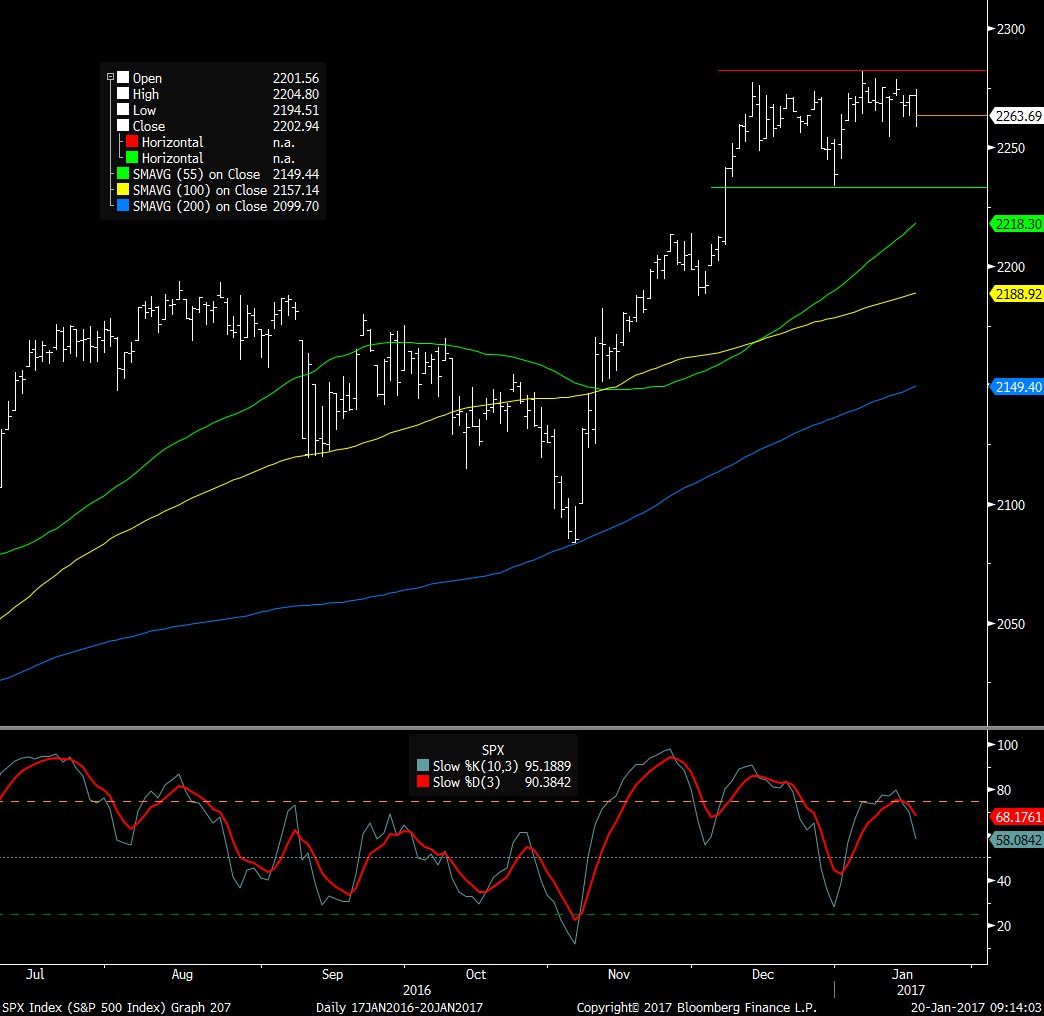
- FxMacro @fxmacro – SPX has been consolidating the Trump rally for the last month in a very tight range typically the trend will resume and break higher
- Joe Kunkle @OptionsHawk – Jan 19 – I $SPY inverse H&S
- J.C. Parets
@allstarcharts – the Nasdaq 100 is flirting with a new all-time record closing high. I generally don’t consider this to be a bearish characteristic$QQQ
- Mark Arbeter, CMT
@MarkArbeter – Market$SPX tightly bound. Has led to quick moves in both directions, but mostly lower. Major BB constriction.$SPY
4. International Stocks
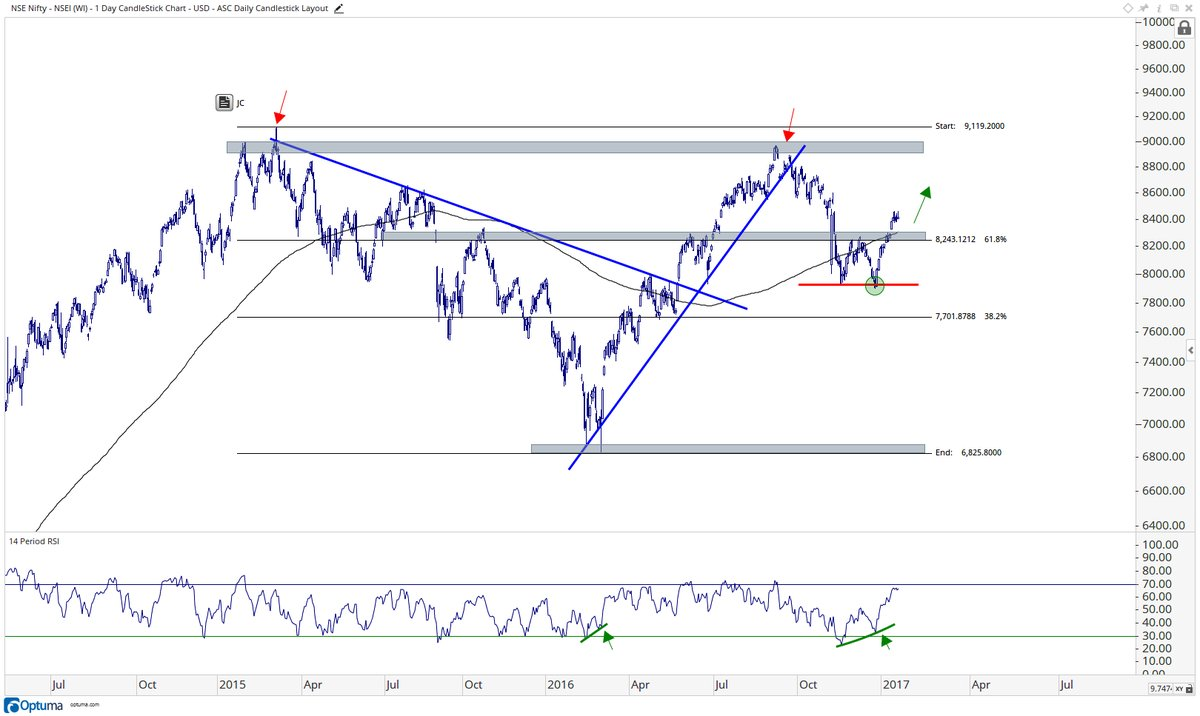
Jeff Gundlach said in his webcast last week that you can be secular long in India. We have felt that way for years and especially since August 2013. Fundamentally speaking, the contraction from the Demonetisation drive seems to be ending and growth seems to be resuming. The Indian market has been consolidating its September 2013 to 2014 rally for the past two years. But what about technically?
- J.C. Parets @allstarcharts – Jan 18 – Here’s the Nifty 50 looking to me like it wants to retest 9000 $NIFTY
And jumping to the midpoint of the New York – Mumbai journey:
- J.C. Parets
@allstarcharts – it’s hard to be bearish stocks an asset class when the London FTSE 100 is breaking out of a 17-year base to new all-time highs$FTSE