Summary – A top-down review of interesting calls and comments made last week in Treasuries, monetary policy, economics, stocks, bonds & commodities. TAC is our acronym for Tweets, Articles, & Clips – our basic inputs for this article.
Editor’s Note: In this series of articles, we include important or interesting Tweets, Articles, Video Clips with our comments. This is an article that expresses our personal opinions about comments made on Television, Tweeter, and in Print. It is NOT intended to provide any investment advice of any type whatsoever. No one should base any investing decisions or conclusions based on anything written in or inferred from this article. Macro Viewpoints & its affiliates expressly disclaim all liability in respect to actions taken based on any or all of the information in this article. Investing is a serious matter and all investment decisions should only be taken after a detailed discussion with your investment advisor and should be subject to your objectives, suitability requirements and risk tolerance.
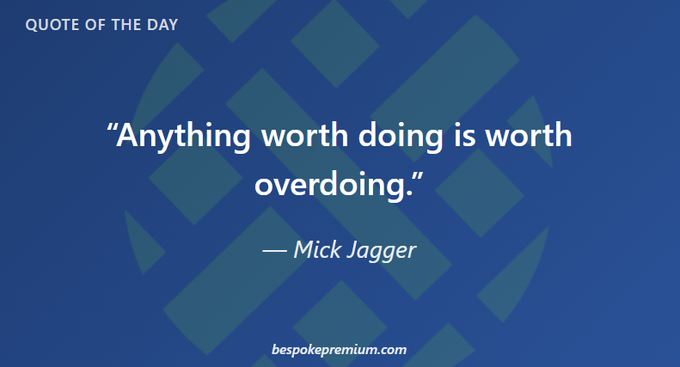
1. Mick Jagger vs. Kenny Rogers
First we saw from Bespoke:
Then came the Know when to fold them by Kenny Rogers.
But you came out of last week just fine if you followed Maximus or Detrick following Maximus.
- Ryan Detrick, CMT@RyanDetrick – Jul 31 – KOSPI up 17% today for the greatest single one day return ever. KOSPI down 2% for the week. Are you not entertained?

The old lesson is when you are absolutely convinced that you know, they show you that you didn’t really know. Another rephrase could be that when you become maxi-proud of your situational awareness, realize that you have become situationally blind.
Forget last week and look at where markets find themselves:
- David Marlin@Marlin_Capital – 8-1 – Last week saw the 2nd largest Hedge Fund de-grossing of the last decade. $SPX $QQQ $IWM
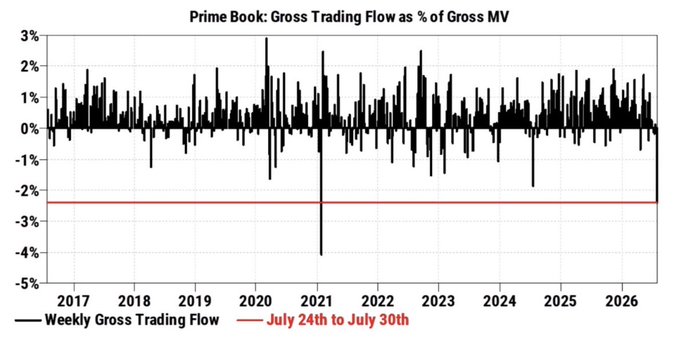
If last decade is too short for you, then how about last 20 years?
- Connor Bates@ConnorJBates_ – 8-1 – Momentum Washed Out. JPM notes the current Momentum drawdown is the deepest long-leg-driven selloff of the past 20 years.
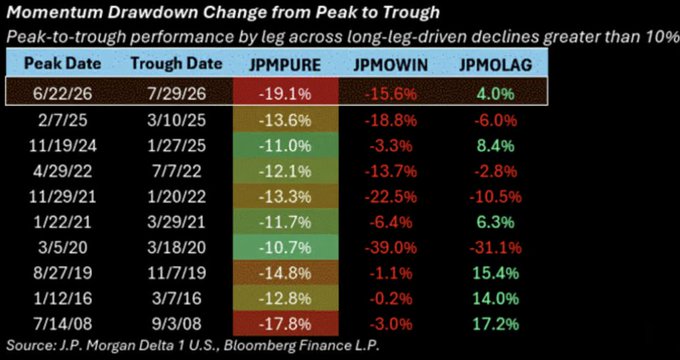
The corollary?
- The Market Ear@themarketear – – GS volatility desk says the coast is clear on semis: “…increasing inbounds from LO and SMH sitting just above its 100dmaleads us to believe that Semis is a clean place to reload. We saw vol compress on yesterday’s rally and expect this to continue.”
2. Markets Last Week
2.1 US Indices:
- VIX down 13.5% to 16.11; Dow up 1.9%; SPX up 1.1%; RSP up 67 bps; NDX up 52 bps; RUT up 3 bps; MDY down 64 bps; XLU down 4.2%; SMH down 3.7%; SOXL down 17.4%
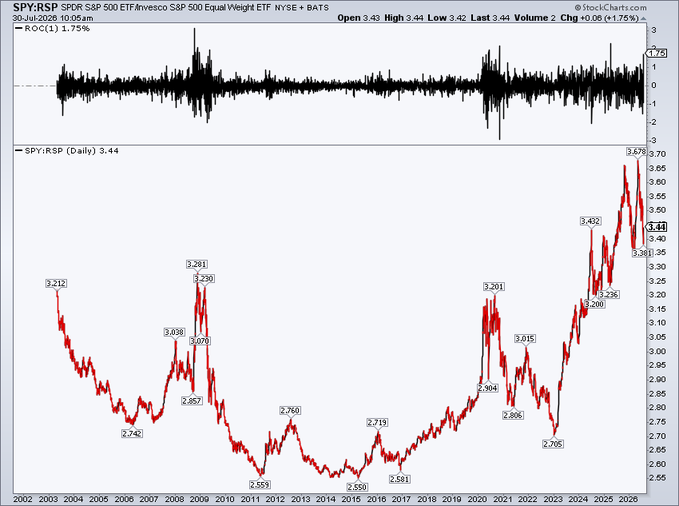
Speaking of “overdoing”, is broadening being overdone?
- Mike Zaccardi, CFA, CMT 🍖 @MikeZaccardi – $SPY vs $RSP … best day outside of crises… +1.75ppt
Since it was all about semis,
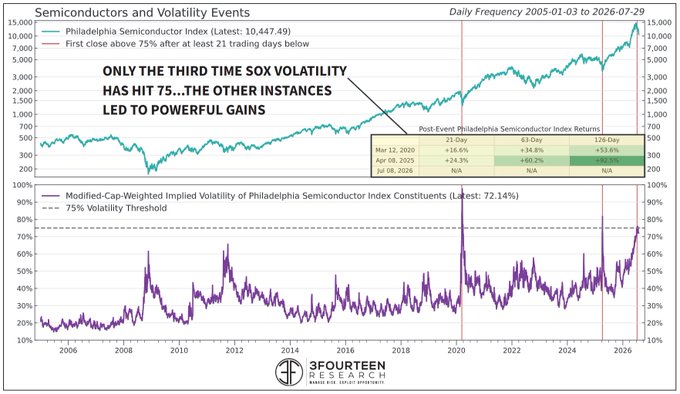
- Warren Pies@WarrenPies – Jul 31 – The Leopold liquidation pushed semiconductor single-stock volatility up to 75% (SOX Index). This is only the third time semi volatility has reached this level. The other two instances: March 2020 and April 2025.
And broadly speaking:
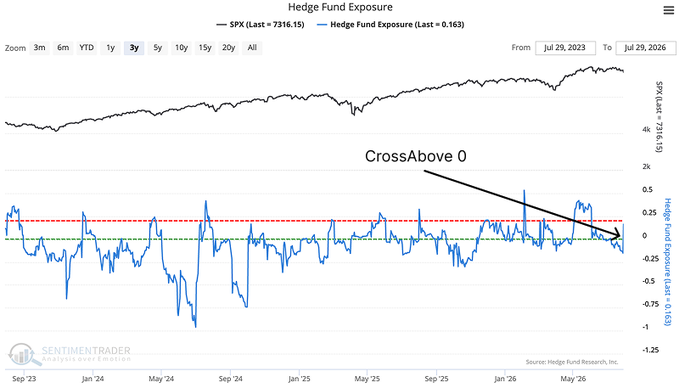
- SentimenTrader@sentimentrader – July 30 – Hedge funds backed away from stocks, then changed their minds fast. They went from an 84 day low in exposure to above zero in 2 sessions. After prior moves this quick, the S&P 500 was positive 91% of the time 2 months later. The 1 year mean return was 12.5%. The better longer term returns came while exposure was still below zero. Read full analysis: https://users.sentimentrader.com/users/sentimentedge/hedge-fund-exposure-rebounds
And they added a day later:
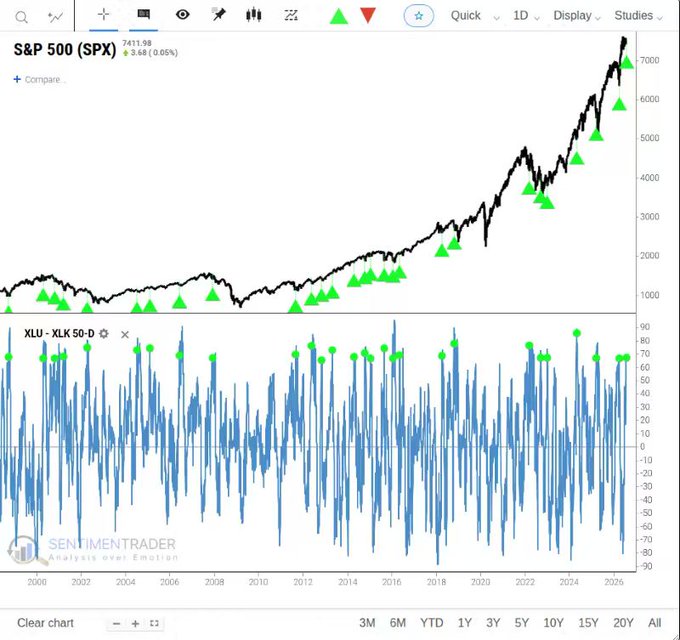
- SentimenTrader@sentimentrader – – Utility stocks are in an uptrend. Tech stocks mostly aren’t. Over 95% of utility stocks trade above their 50-day average while fewer than 30% of tech stocks do. That gap has opened fewer than 30 times in 30 years, and the S&P 500 rallied 77% of the time over the next 4 months. This week’s TradingEdge Weekly video covers the utility-tech divergence, unleaded gas near historic highs, COT positioning at an extreme, and two sectors entering seasonal weakness. The full SentimenTrader market view:
2.2 MAG 7:
- AAPL down 7.2%; AMZN up 17%; GOOGL up 11.4%; META down 6.5%; MSFT up 21.8%; NFLX up 2.3%; NVDA down 2.9%; MU down 10.6%; IBM up 4.4%; IGV up 7.5%; CRM up 12.4%; PANW up 2.5%; NOW up 12.6%
Slope is the signal?
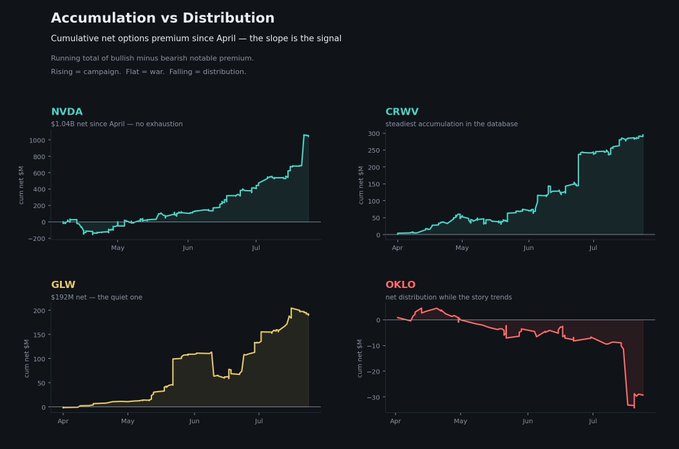
- OpticalFlow@OpticalFlow3868 – Four tapes, one chart type: cumulative net options premium since April. The slope IS the signal. $NVDA: $1.04B net and still climbing — persistent buyers, no exhaustion. $CRWV: the steadiest accumulation line in the database. $GLW: the quiet one nobody discusses. $OKLO: falling. Net distribution while the SMR story trends daily. Rising = campaign. Flat = war. Falling = someone knows the story better than the timeline does.
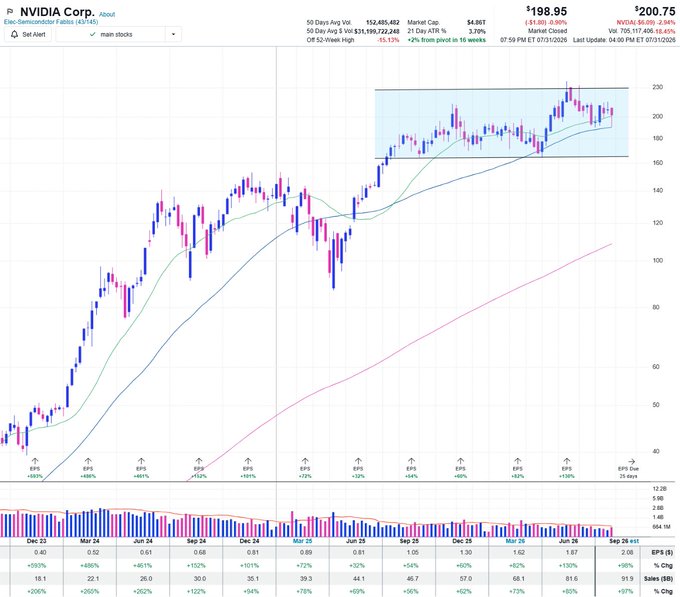
Pay attention to $NVDA:
- HCPG@HCPG – 8-1 – $NVDA – bounce on 50sma weekly but still deep in channel. But it has acted better recently and has our attention.
2.3 Key Financials:
- BAC down 16 bps; C up 20 bps; GS down 4%; JPM down 40 bps; KRE up 44 bps; EUFN up 3.2%; SCHW up 3.2%; APO up 2.4%; BX down 1.7%; KKR up 2.1%; XHB down 4.4%; ITB down 2.8%; NAIL down 9.1%; IGV up 7.5%; CRM up 12.4%; PANW up 2.5%; NOW up 12.6%
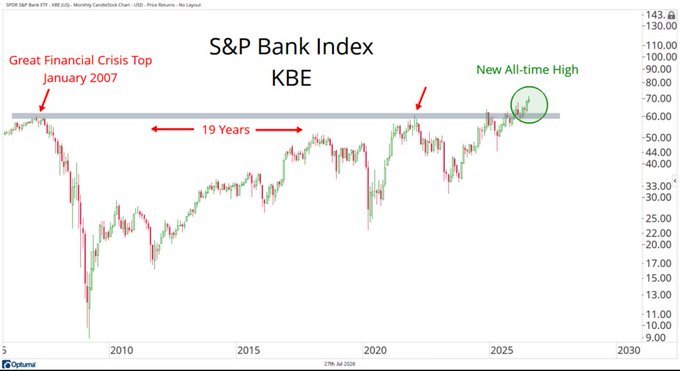
If Banks are good, could life be bad?
- Ryan Detrick, CMT@RyanDetrick – Jul 31 – In 2007, banks were the warning, as they peaked early that year, even as the overall market didn’t peak until October. Well, now we have banks breaking out after years of basing, once again sending a warning. Only this warning is this bull is alive and well. Nice chart from @JC_ParetsX here.
2.4 – Dollar & Metals
- Gold up 1.3%; GDX down 1.5%; Silver down 70 bps; Copper up 3.2%; CLF down 3.4%; FCX up 5 bps; MOS down 81 bps; Oil down 5%; Brent down 6.9%; OIH down 1.8%; XLE down 12 bps; PBR up 3.4%;
Strazza Reports pointed out:
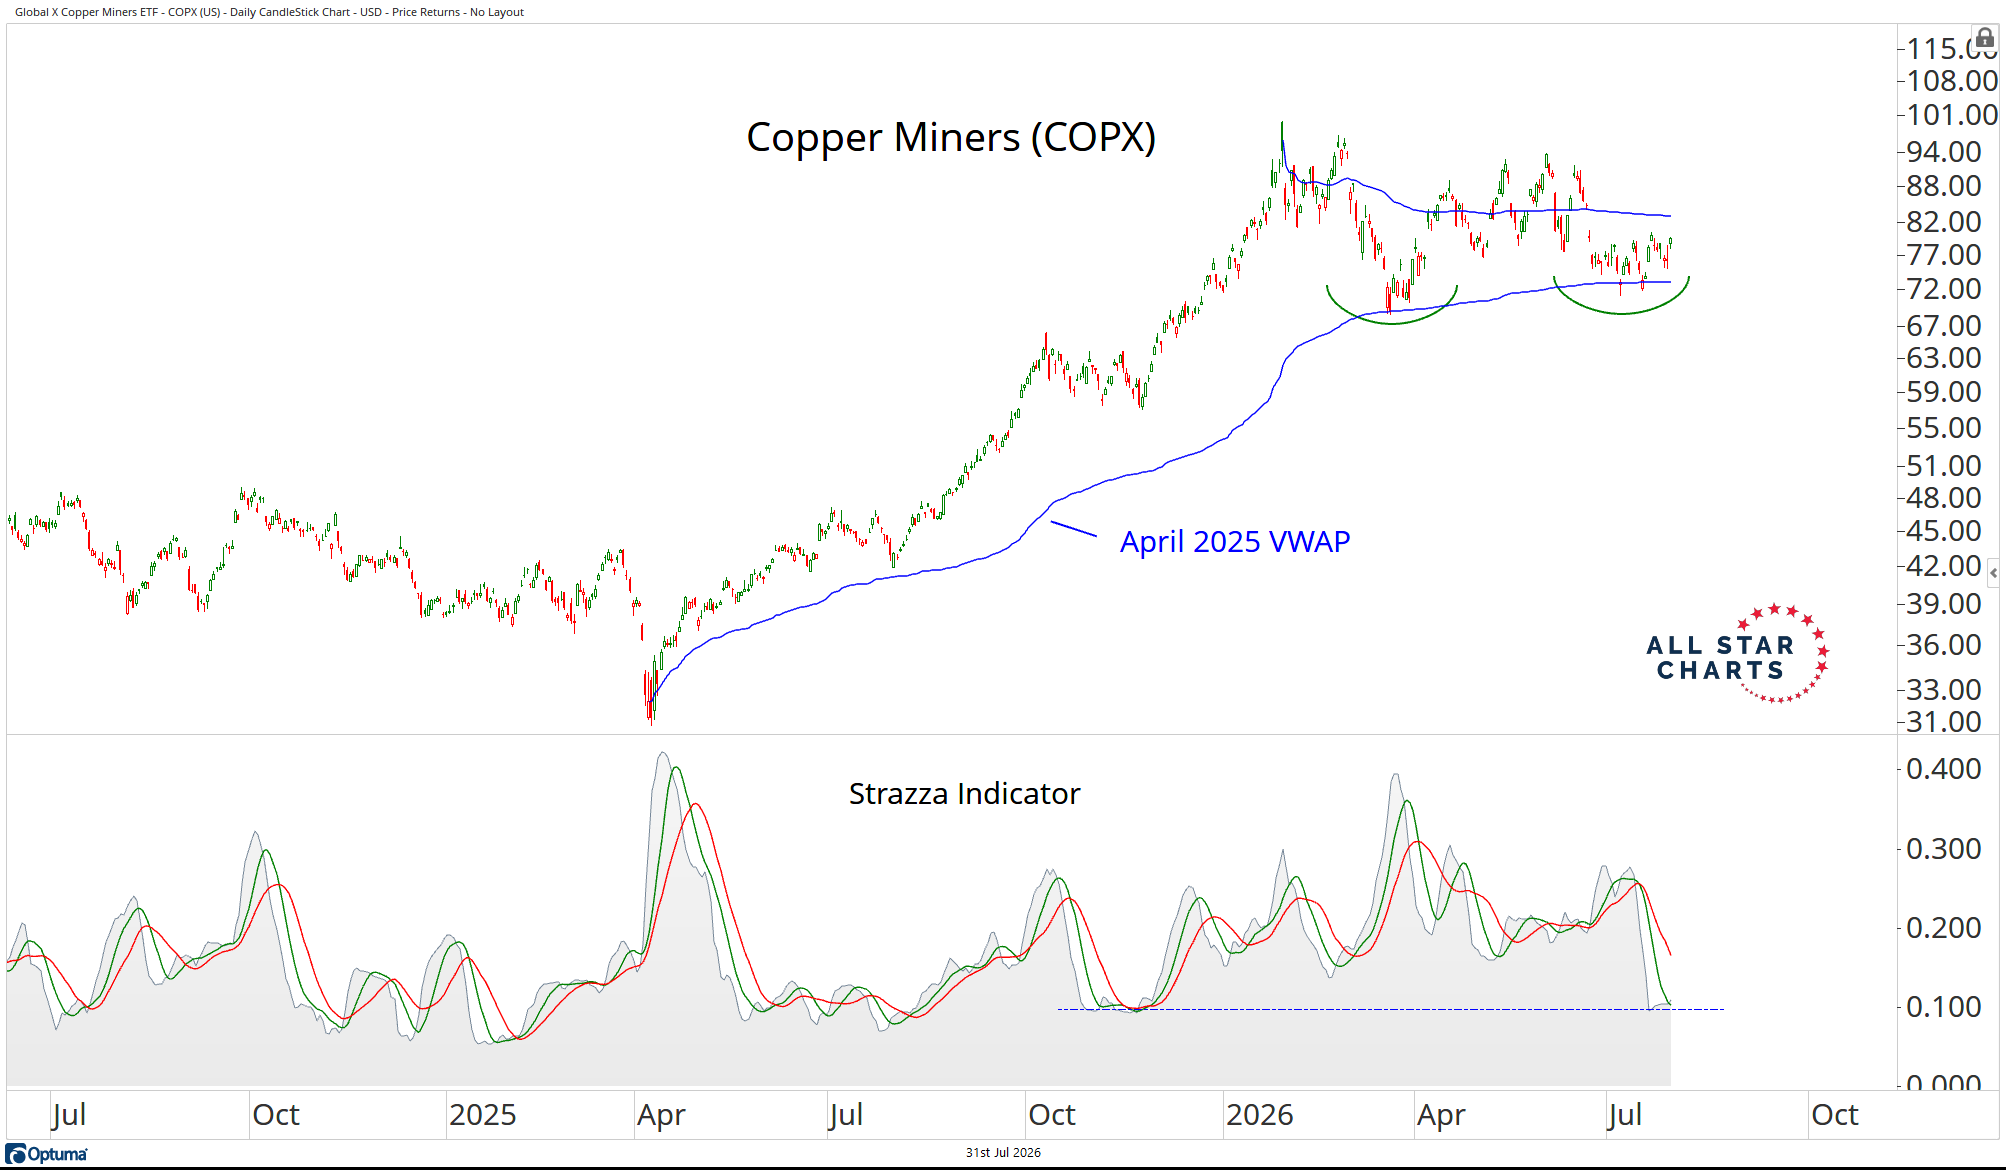
- The dollar is finally starting to crack, and when it does, the entire metals complex wakes up. Gold and silver get the headlines, but the industrial side of the trade might be even better. A single AI data center can eat through 50,000 tonnes of copper. The world needs more copper than it can mine, and the dollar is getting out of the way. The Copper Miners ETF $COPX is currently exhibiting a squeeze score of 95.6 and a long-term squeeze score of 94.7. Here’s what the chart looks like:
Strazza Reports added:
- COPX is coiling above the April 2025 VWAP as price works through a multi-month continuation pattern following a powerful advance. ….. A breakout above the all-time high VWAP could ignite the next leg higher in one of the strongest trends anywhere in the market.
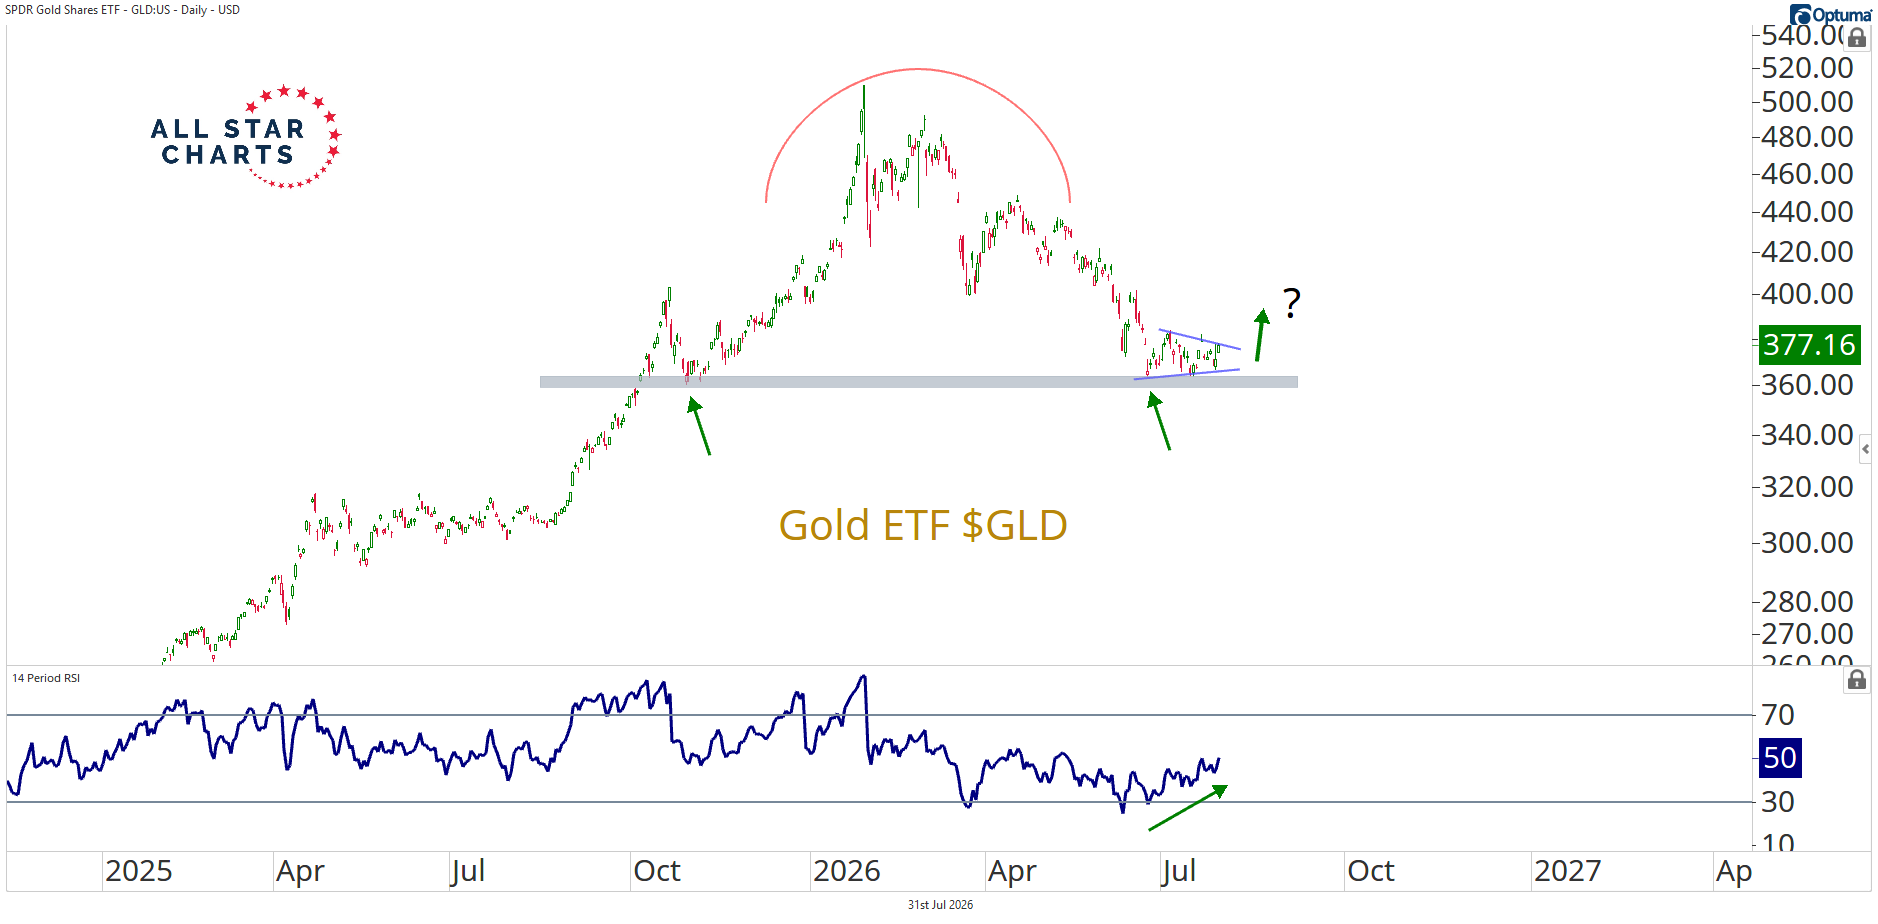
On the other hand, JC Parets is unwilling to get out of Gold.
- The ETF is sitting right on top of an important support zone defined by a shelf of pivot lows from last year. At the same time, the 14-period RSI is flashing a bullish divergence, with momentum improving even as price has struggled to make new lows. Risk is well defined here. Now the ball is in the Dollar’s court. As long as the DXY remains trapped inside its range, the backdrop for Gold continues to improve. And as long as GLD holds above 360, I think the thesis remains intact. This is a hard trade, and I could absolutely be wrong.
2.5 – International Stocks:
- EEM up 1.2%; EMXC up 25 bps; FXI up 5.6%; KWEB up 8.4%; BABA up 8%; EWZ up 2.6%; EWY down 3.6%; EWJ up 1.3%; EWG up 4.2%; INDA up 3.7%; INDY up 3.2%; EPI up 3.1%; SMIN up 2.8%; IBN up 1.6%; HDB up 3%;
2.6 Treasuries & Interest Rates
- 30-year Treasury yield up 8.8 bps on the week; 20-yr yield up 7.5 bps; 10-yr up 3.3 bps; 7-yr up 1.8 bps; 5-yr down 0.3 bps; 3-yr down 3.4 bps; 2-yr down 5.8 bps; 1-yr down 7.7 bps;
- TLT down 1.2%; EDV down 2.3%; ZROZ down 2.8%; HYG up 32 bps; JNK up 30 bps; EMB up 2 bps
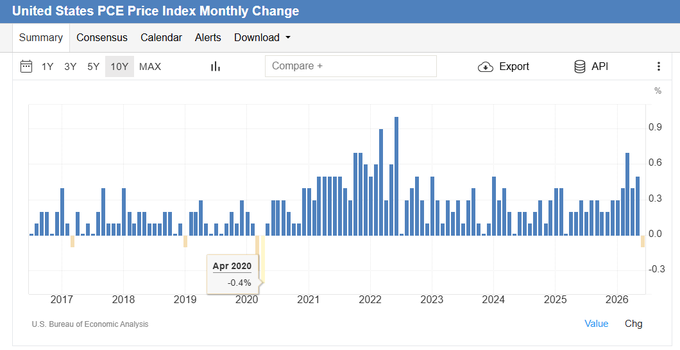
While everyone on TV & Print is focused on inflation,
- Mike Zaccardi, CFA, CMT 🍖@MikeZaccardi – First deflationary PCE Price Index m/m print since April 2020
Our friend Rosie remain un-rosy:
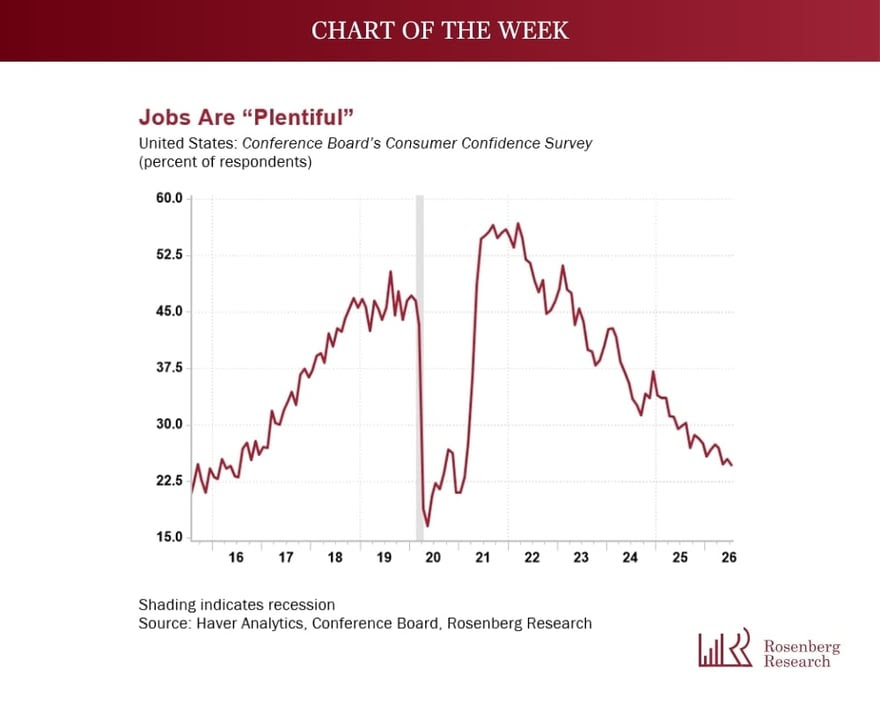
- The Fed held, but the more telling signal this week came from the Conference Board’s July Consumer Confidence report. Confidence slipped, and not for the usual reasons. Inflation expectations eased, interest rate fears steadied, and stock market optimism held firm. The culprit was the labor market. As our Chart of the Week shows, the “Jobs Gap” respondents seeing jobs as plentiful versus hard to get, has compressed to a level last seen in early 2021, when the unemployment rate stood at 6.2%. That is a warning the Fed’s hawks appear content to ignore, and one that will be hard to look past by September.
Speaking of the chorus to Fed Hawks & their dedicated followers, allow us to re-focus on the proven “cognoscenti” who remain wedded to Powell’s backward-intelligence posture. It seems clear that Fed Chair Warsh is bringing in a highly necessary forward-intelligence focus that must be driving the backward-elite nuts. It doesn’t guarantee that Warsh will prove right (but that is our bet) but it does protect us from the risk of utter dogmatic stupidity that propels so many to cry “inflation” when the global economy is slowing down.
Regarding the markets, the most positive story we saw is that “Perimeters of a Deal Reached” with Iran based on a call from MBS of Saudi Arabia. If this is believed to be true & if it actually proves true it could be great for US & global financial markets.
Send your feedback to editor.macroviewpoints@gmail.com
