Summary – A top-down review of interesting calls and comments made last week in Treasuries, monetary policy, economics, stocks, bonds & commodities. TAC is our acronym for Tweets, Articles, & Clips – our basic inputs for this article.
Editor’s Note: In this series of articles, we include important or interesting Tweets, Articles, Video Clips with our comments. This is an article that expresses our personal opinions about comments made on Television, Tweeter, and in Print. It is NOT intended to provide any investment advice of any type whatsoever. No one should base any investing decisions or conclusions based on anything written in or inferred from this article. Macro Viewpoints & its affiliates expressly disclaim all liability in respect to actions taken based on any or all of the information in this article. Investing is a serious matter and all investment decisions should only be taken after a detailed discussion with your investment advisor and should be subject to your objectives, suitability requirements and risk tolerance.
1.“Completely Different“ ... “humility“
How did Art Cashin describe the FOMC statement & the presser of Fed Chairman Powell? He said “it is a completely different Fed“. How did Economist Judy Shelton describe the attitude exhibited by Chairman Powell? She said “I was struck by the humility of Fed Chairman Powell“.
Both are accurate descriptions. Go back & compare the demeanor of Chairman Powell during the presser following the December FOMC meeting vs. his demeanor this past Wednesday. It was a huge climbdown and correctly so. He has been chastened, we believe, by the intensity of the market’s reaction during both the sell off and the rally. What we all saw is a Powell who now is wedded to discretion being better than valor and a Powell who now understands how market reaction can torpedo both Fed’s models and the actual economy.
In our opinion, Chairman Powell wants to position his Fed as a patient & stable institution that keeps its poise in a highly intense global economy that is facing a slowdown & a big trade fight and in an US economy that is facing intense political combat. Powell succeeded in doing so. The basic message he conveyed is that his Fed would be a supportive force in the midst of turmoil. Kudos to him.
Those who babble about the Fed’s caving in to the markets do not get the basic truth that Chairman Powell has grasped. The grand plan behind Bernanke’s QE Forever was to make the economy, at least the spending power of the US economy, dependent on asset values. That has made the US economy highly vulnerable to rapid & dislocating market selloffs. That is why, we believe, Chairman Powell bent over backwards to project even a more dovish Fed during his presser than what dovish-prepared markets expected. But & at the same time, he has NOT made any commitments regarding reducing or pausing his monthly QT.
Frankly, this was Powell harking back to his early comment about patience displayed by Greenspan in mid-1990s. Kudos to him for his discretion & common sense.
2. Present vs. Later
What did the Treasury Curve say on Thursday about present vs. future?
- Charlie BilelloVerified account @charliebilello – Most inverted US Yield Curve since August 2007. 1-yr treasury yield 4 bps higher than 7-yr yield…
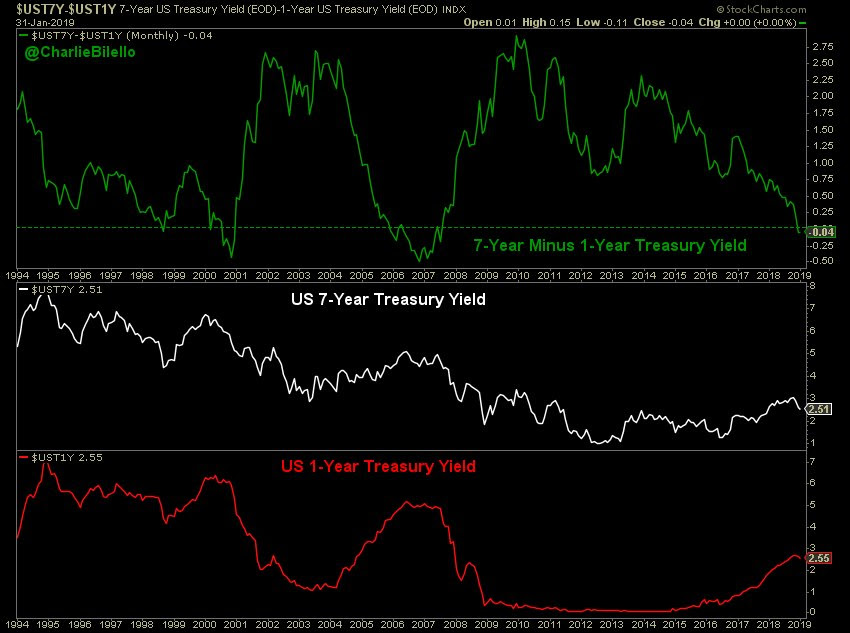 The 1-yr yield remained higher than the 7-year yield even after the 304,000 strong NFP report at 8:30 am on Friday. It was the strong ISM-Services number that finally propelled the 7-year yield up 7.5 bps on the day to close higher than the 1-year yield. But the entire 2-5 year curve remains lower in yield than the 1-year yield even after the 304K jobs number and the very strong ISM-Services number.
What gives? Is the Treasury market telling us the Fed will begin cutting rates from 2020? How does that fit with the strong, strong data we see? It fits if you take into account “expectations”:
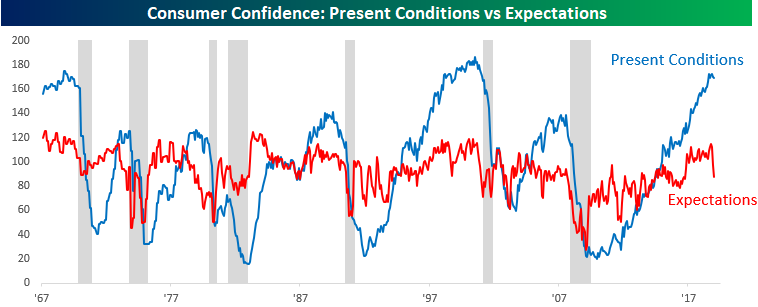
“When the gap between the Present Situation and Expectations indexes has exceeded 50 — it is currently at 82.3 — “recessions weren’t far behind,” as Paul Hickey of Bespoke reportedly wrote. The CNBC article also stated:
- “The difference between the two readings has only been wider three times in the survey’s history going back to 1967, according to Bespoke Investment Group. Those came in January through March of 2001, the final month being the beginning of a recession.”
This fall in expectations was enough for Jeffrey Gundlach to change his opinion to:
- Jeffrey GundlachVerified account @TruthGundlach – Jan 29 – The most recessionary signal at present is consumer future expectations relative to current conditions. It’s one of the worst readings ever.
When did the expectations number fall so much? According to the CNBC article,
- “the Expectations Index tumbled from 97.7 to 87.3 from December. Since October, the expectations reading has plunged 24 percent.”
Wasn’t December the worst month for the US stock market in a long time? And didn’t the October-December period show sustained selling in the stock market? Of course.
What this shows is that virtually all consumer-based economic indicators, including the above Consumer Confidence Index of the Conference Board, are now dependent on the moves in the US stock market. That is what, we believe, Chairman Powell now understands and that is the reason for his humility during his presser and his steadfast dovishness.
But is the present really as strong as the 304,000 jobs added number suggests?
- David Rosenberg @EconguyRosie – The key in today’s data was the job decline in the Household survey. Employment among working-age adults fell for the third straight month. Great recession harbinger.
Merriam-Webster defines “harbinger” as – “something that foreshadows a future event : something that gives an anticipatory sign of what is to come“
With this definition, shouldn’t the 2-5 year interest rate curve be lower than the 1-year rate? Yup, the Treasury market is saying.
3. Bonds Rebound
The ISM-Services data led to a sharp rise in interest rates, especially the short term rates. But rates across the curve fell on the week thanks to the Fed:
- 2-year yield fell by 8 bps; 3-yr by 7 bps, 5-yr by 7 bps, 7-yr by 6 bps, 10-yr by 5.5 bps & 30-yr by 2.7 bps.
But the real action in January has been in other bonds & bond-influenced stock sectors.
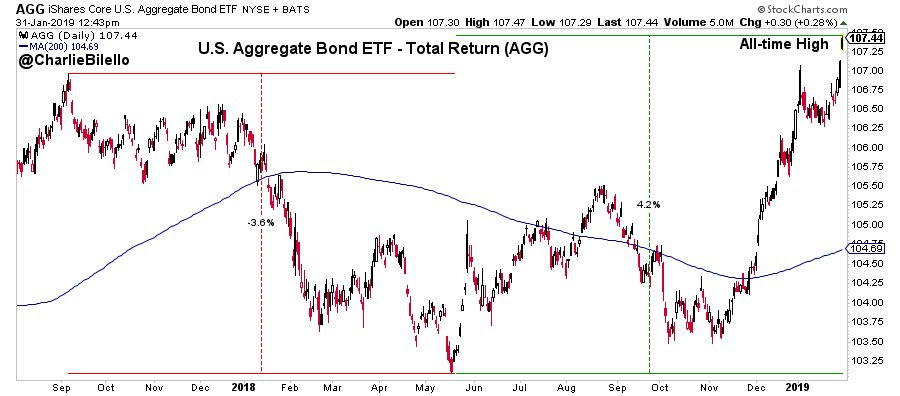
- Charlie BilelloVerified account@charliebilello – Jan 31 – The horrific bond bear market of 2017-18 (-3.6% decline) is over. Aggregate bond ETF back at new all-time highs. $AGG
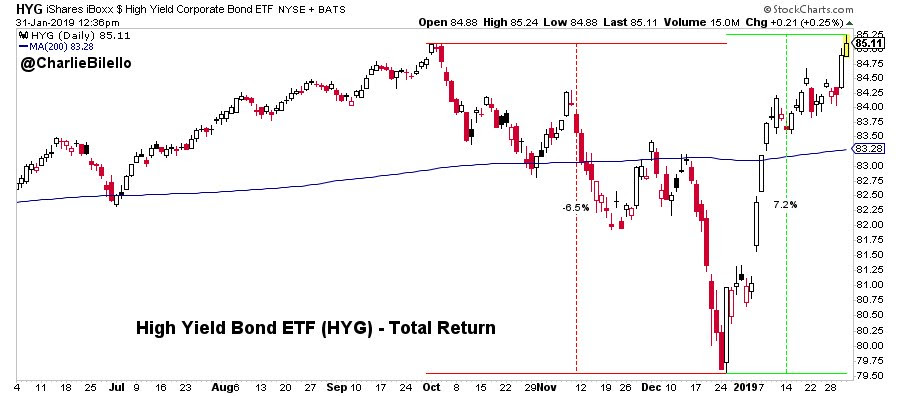
- Charlie BilelloVerified account @charliebilello – Jan 31 – US High Yield bonds hit new highs. Staircase down, Elevator up. $HYG
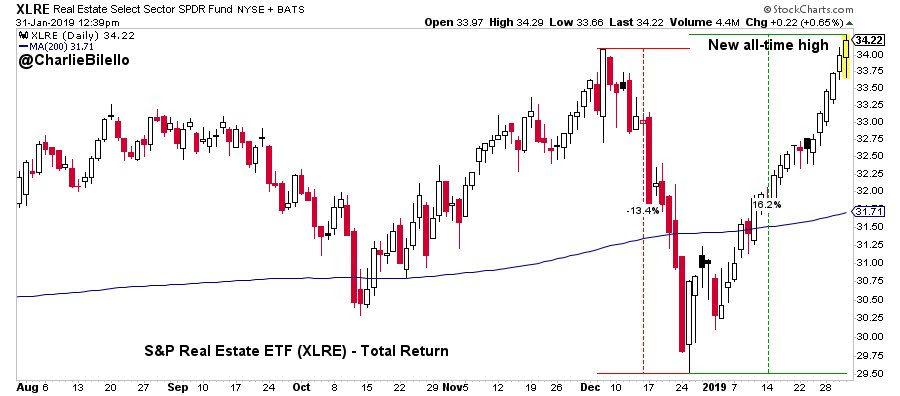
- Charlie BilelloVerified account @charliebilello – Jan 31 – Real Estate is first S&P sector to recover its correction losses & hit a new all-time high. Elevator down (-13%), Elevator up (+16%). $XLRE
Not just US bonds but,
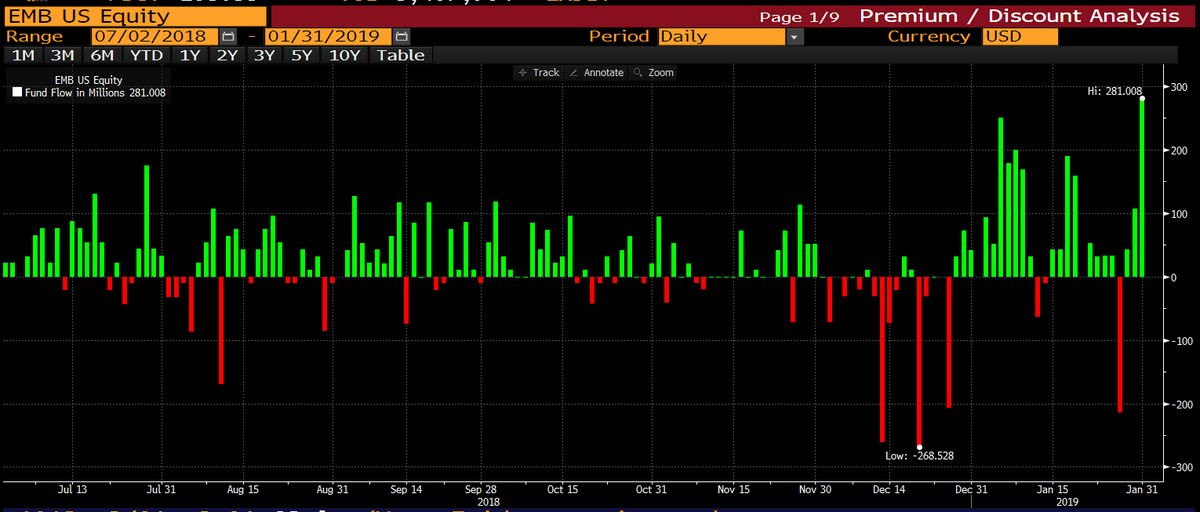
- Lisa AbramowiczVerified account @lisaabramowicz1 – Emerging-markets bonds are in a sweet spot again. The Fed is being patient, the world economy is relatively solid, albeit slowing, and the dollar is weakening. Not surprisingly, the biggest U.S. EM debt ETF saw the largest one-day flow yesterday since last summer.
Treasury bonds have done nothing of the sort and they appear somewhat overbought. But where does the recent movement stand when you take a 40-year view?
- Urban Carmel @ukarlewitz – Jan 31 – As yields sink, here’s a 40 year view of bond prices (move opposite yields) $usb $tyx $tlt
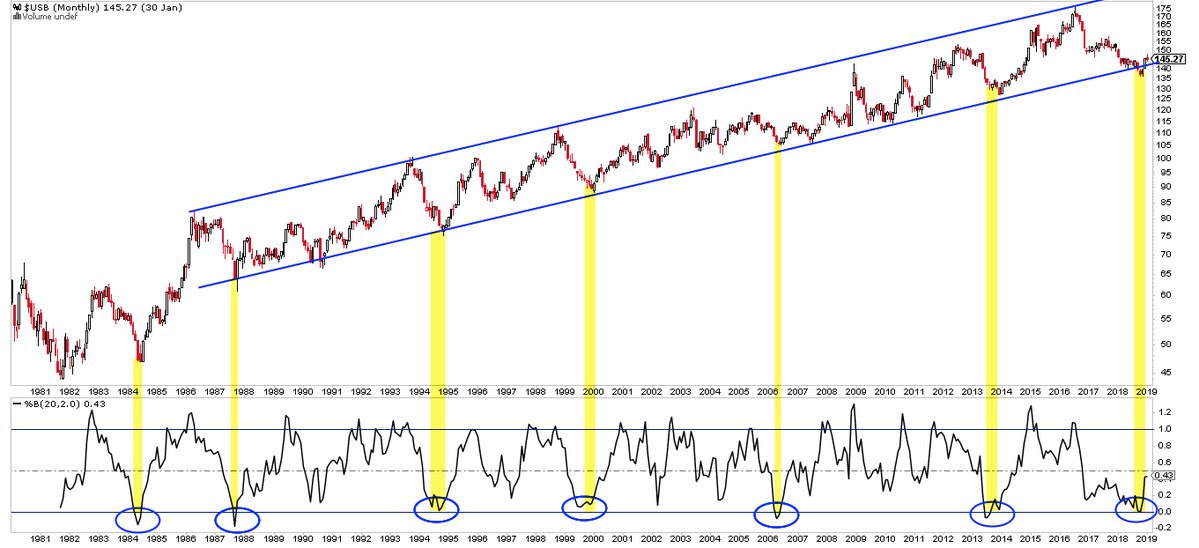
hmmm!
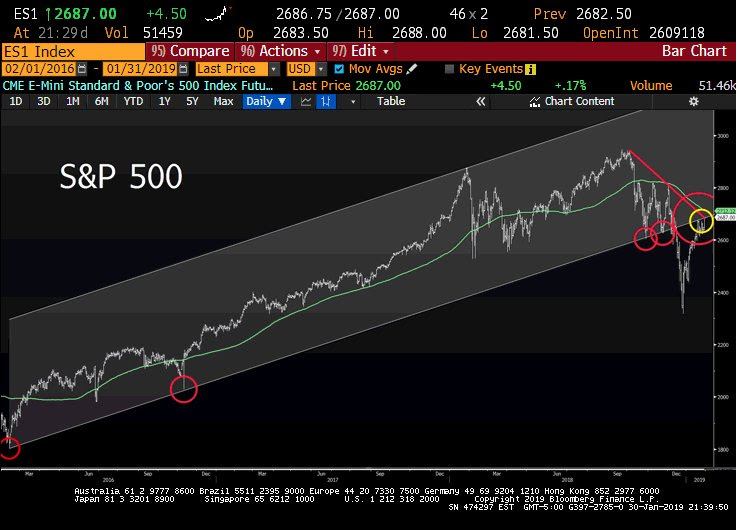
4. US Stocks
A great January for the US Stock market with S&P up 8%. What does that mean for the long and near term?
Our position is simple & straight forward. The Fed being done, huge oversold condition of December 2018 should point to a good year for US stocks, perhaps like 1985, 1995, unless the US economy faces a recession.
But we have no clue about the near term. And even if the above analogies prove true, that doesn’t rule out a down February.
So below are some thoughts from smart people:
- Lawrence McMillan of Option Strategist – Since there are no sell signals, we remain short-term bullish. Enjoy the ride while it lasts, employing trailing stops and rolling long calls up to higher strikes. Just don’t become too relaxed; stay vigilant.
In that spirit,
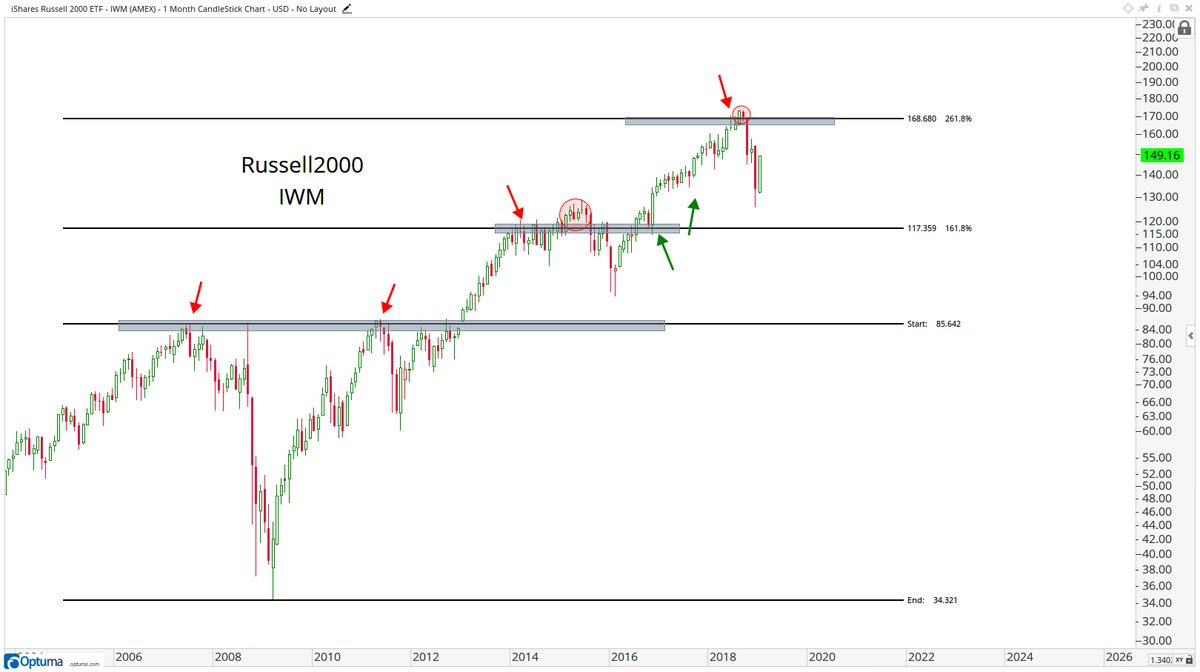
- J.C. Parets @allstarcharts – I think the Russell2000 Monthly Chart probably tells the story about the current market best: Stuck below overhead supply bigger picture, but with still more room to the upside short-term $IWM $RUT
Little less in that spirit:
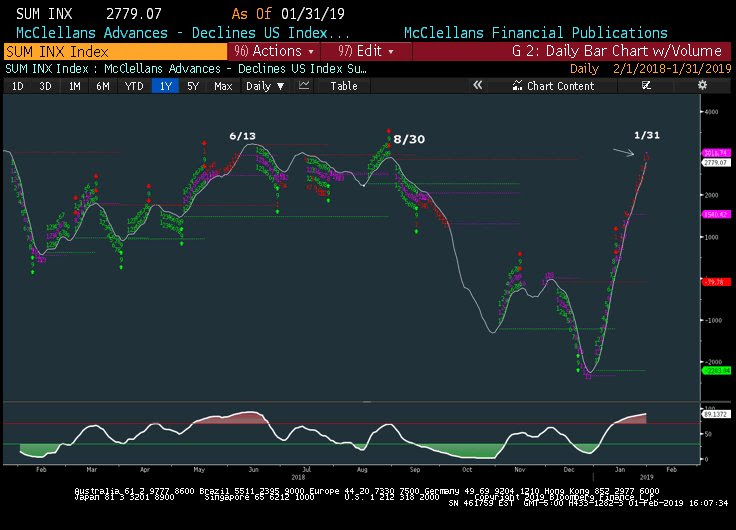
- Mark Newton @MarkNewtonCMT – Smoothed Breadth, as per the Summation index, is now BACK at former peaks from last year & registering signs of exhaustion- This likely paves the way for a stalling out next week- Watch for Negative A/D Tues-Thur
On the other hand,
- Peter Ghostine @PeterGhostine – [$QQQ] … The upside we had been on the lookout for was reached yesterday. http://www.61point8.com/
Portals/0/article%20images/ 2019/20190201/20190201QQQ1.png …
A little more in this spirit:
- Lawrence McDonald @Convertbond – Jan 30 – Would you Buy or Sell this stock?
Finally, an implementation of this spirit:
- Thomas Thornton @TommyThornton – Jan 31 – Hedge Fund Telemetry Trade Ideas Sheet back to net short (-8%) for the first time since mid December when positioning changed from over 65% net short from all of Q4 to 90% net long to mid January.
Finally, a look back to January 2001 by Lawrence McMillan:
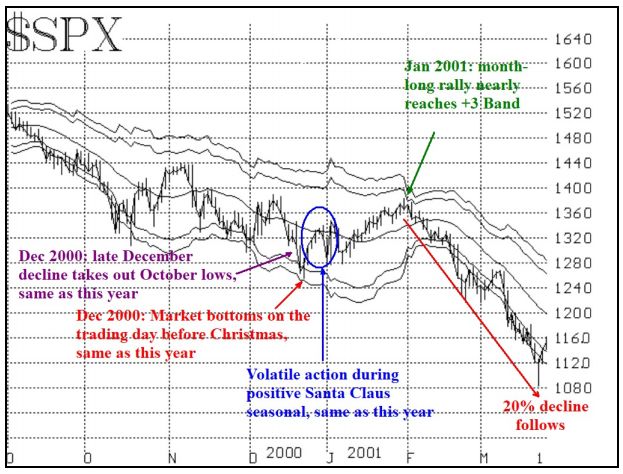
Now, we’ve reached the end of January – the exact time when the market turned southward again in 2001. So the first four comments on the chart of 2000-2001 are applicable to 2018-2019 as well, including the last one: that the January rally has reached the +3ó “modified Bollinger Band” (mBB).
For more details, read his article The Specter of 2001 Still Haunts This Market.
5. Global Stocks
S&P is still the king, right?
- ValueWalk @valuewalk – What Correction? S&P Forecast To Approach Pre-October Levels http://dlvr.it/Qxqt7m $$
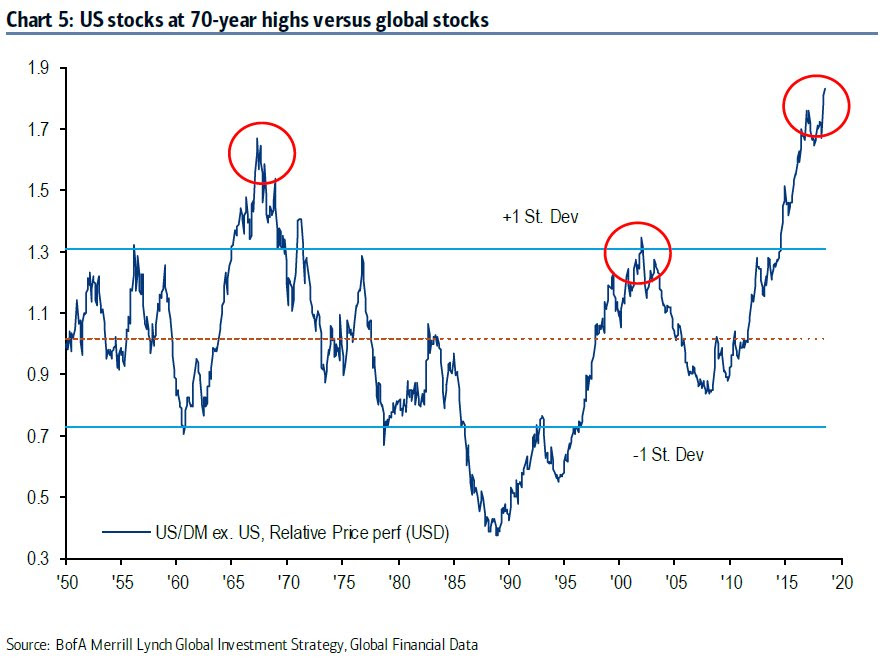 But what if we only focus on a portion of global stocks? You get the new consensus trade.
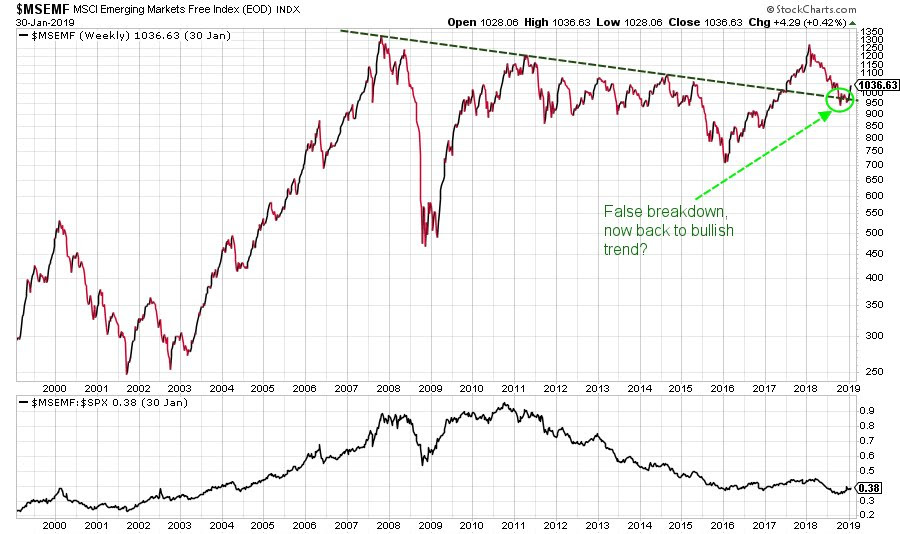
- Ryan Detrick, CMT @RyanDetrick – Jan 31 – Emerging markets continue to look great and should continue to lead here thanks to cheap valuations, solid earnings, and this chart.
 The above is a top-down macro view. How does it look from a bottoms-up micro view?
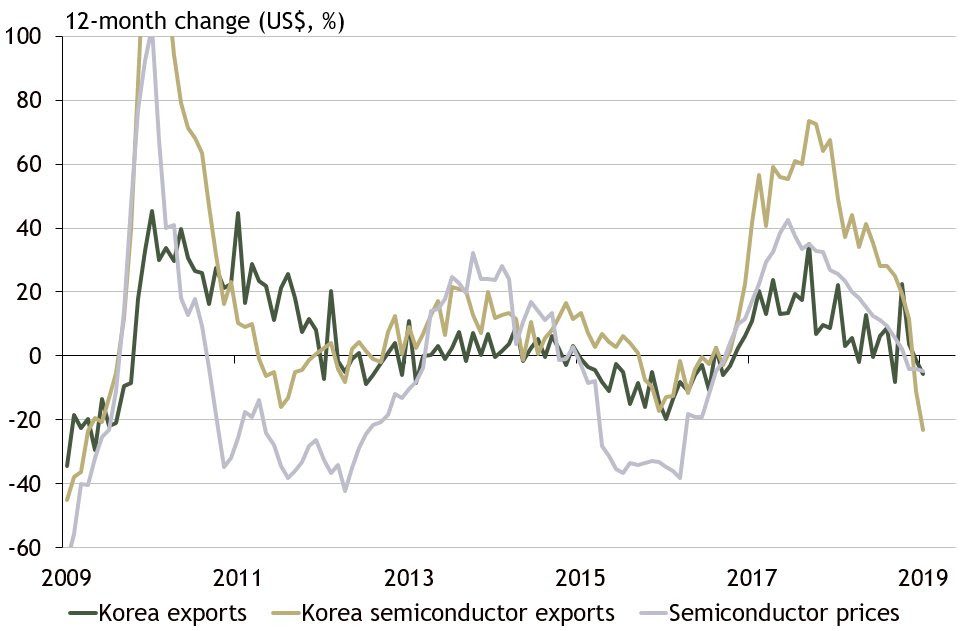
- adam wolfe @adamkwolfe – It’s getting more difficult to ignore the sharp slowdown in the Asian tech hardware supply chain. Korean semi exports were down 23%YoY nominally in January, roughly 15% in real terms based on ASR’s tracking of semi prices.
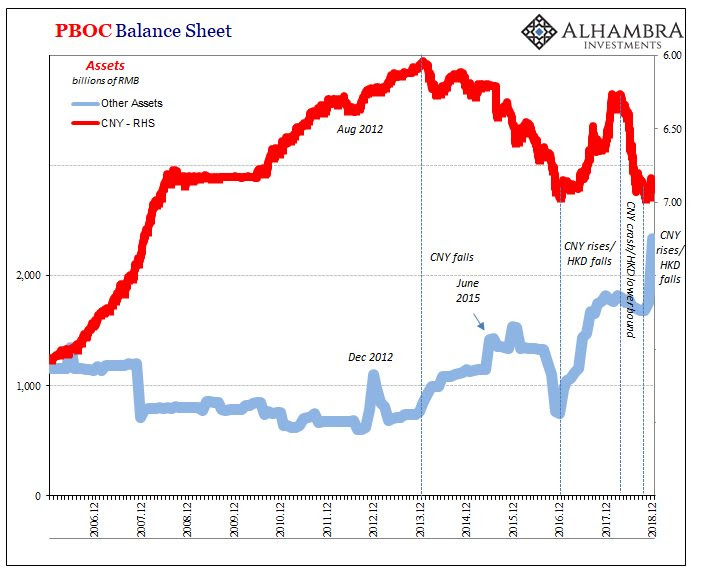
What about China? A not so rosy picture in Three For One In China Still Yields A Minus Situation by Alhambra Investments:
- “The Western media sees a near-omniscient central bank doing things right to combat a slowdown of some outside origin. Instead, all the signs are there for a central bank trying very hard to hold things together under siege from so many things going wrong“
 What about India?
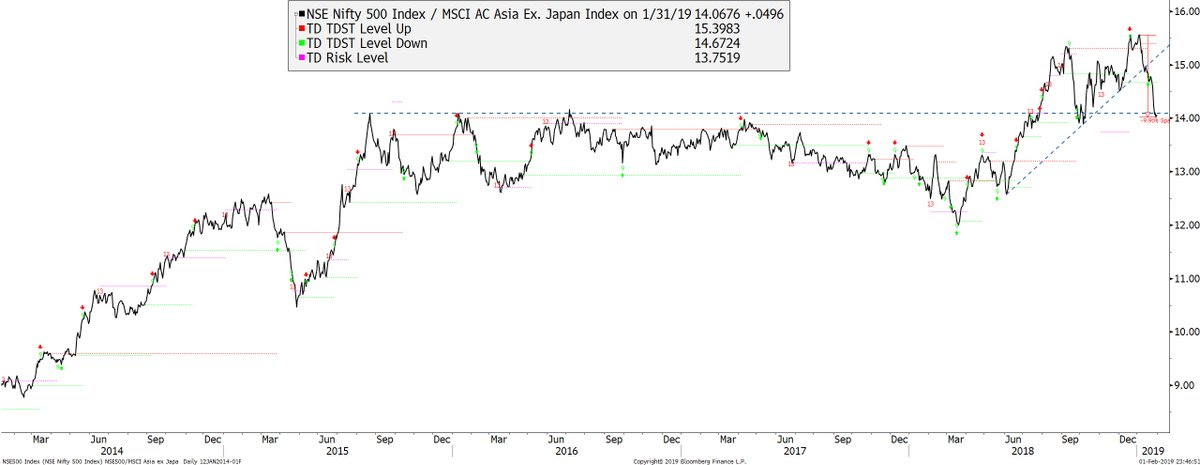
- Real Vision Research @RVAnalysis – #Indian Equities have been underperforming rest of #Asia (ex-Japan) to the tune of nearly 10% from the peak this year. The ratio is testing a 5-year support/ resistance. A close below would signal further deterioration. #JointheDots
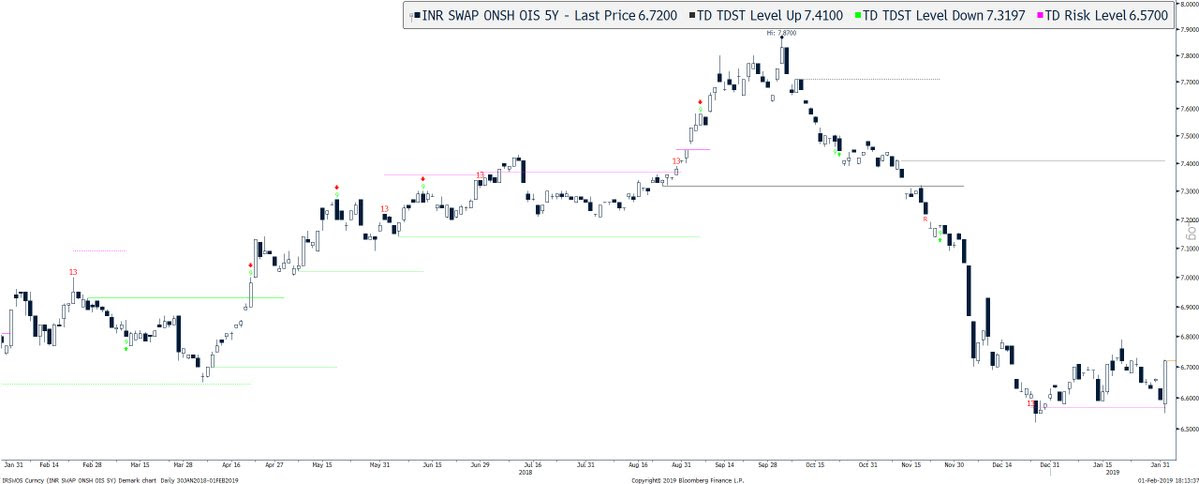
What about the currency & rates?
- Sunchartist @sunchartist – INR 5 Year OIS swap rate rise a massive 12.8 bps to form a major reversal pattern
6 . Gold
What a week for Gold? Not only did Gold rally above $1,300 & $1,315 but gold miners rallied very hard with both GDX & GDXJ up over 6% on the week.
Some smart guys got even more bullish on Gold this week not just on an absolute basis but on a relative basis as well:
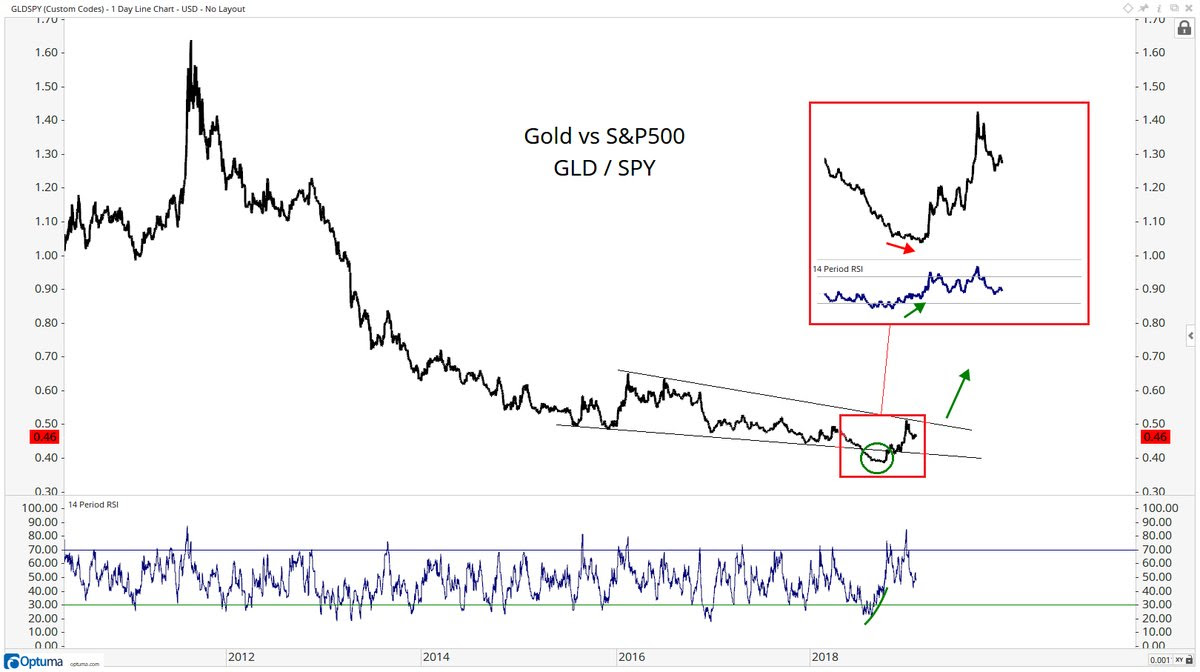
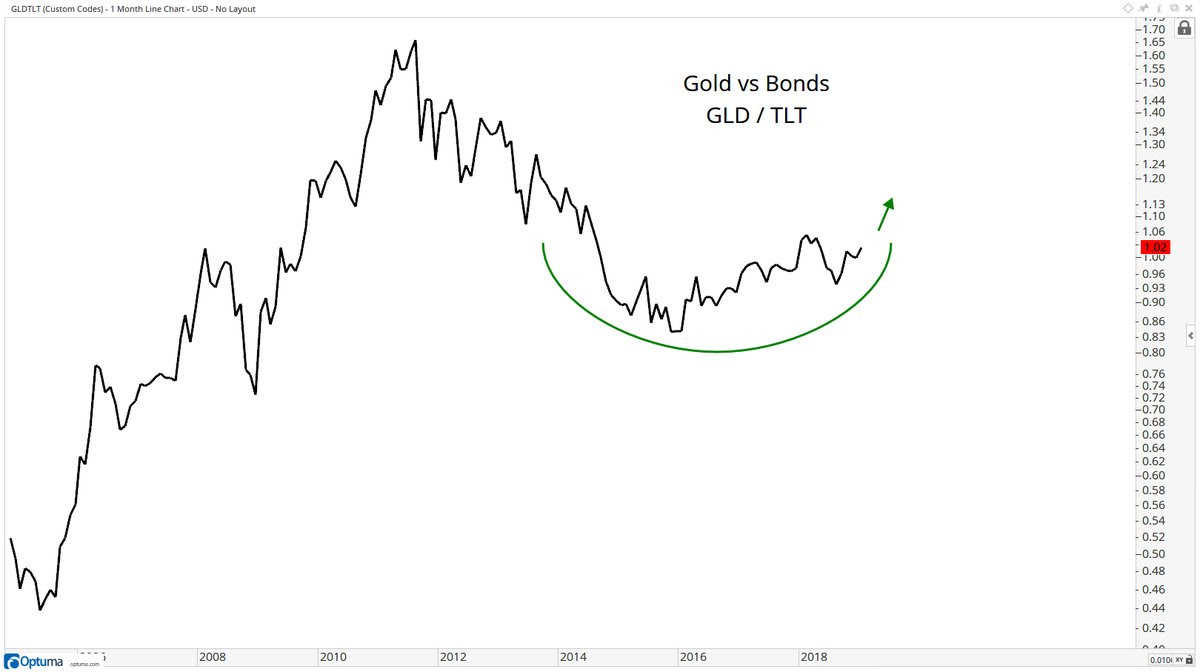
Not just vs. stocks but also,
- J.C. Parets @allstarcharts – Here is the Gold vs Bonds chart. This is how it looks to me $GLD $TLT
Last week Carter Worth of CNBC Options Action said Sell Amazon & Buy TLT. That worked very well. What pair trade did he suggest this Friday? Buy Gold & Sell GOOGL.
Folks, here you have a case of sell the stock but buy the product. We could not find this clip using the “search” function on CNBC.com. We found older clips but not this one. So we went to Google.com and searched for “Carter Worth on Gold on CNBC today” and Presto!
So here is a pair trade for CNBC management – Short GOOGL and use the proceeds to license Google Search for CNBC.com.
7. Oil
Oil was up 3.4% this week, even more than Gold. But Oil stocks were only up 3-3.5%, about half the rally of Gold Miners.
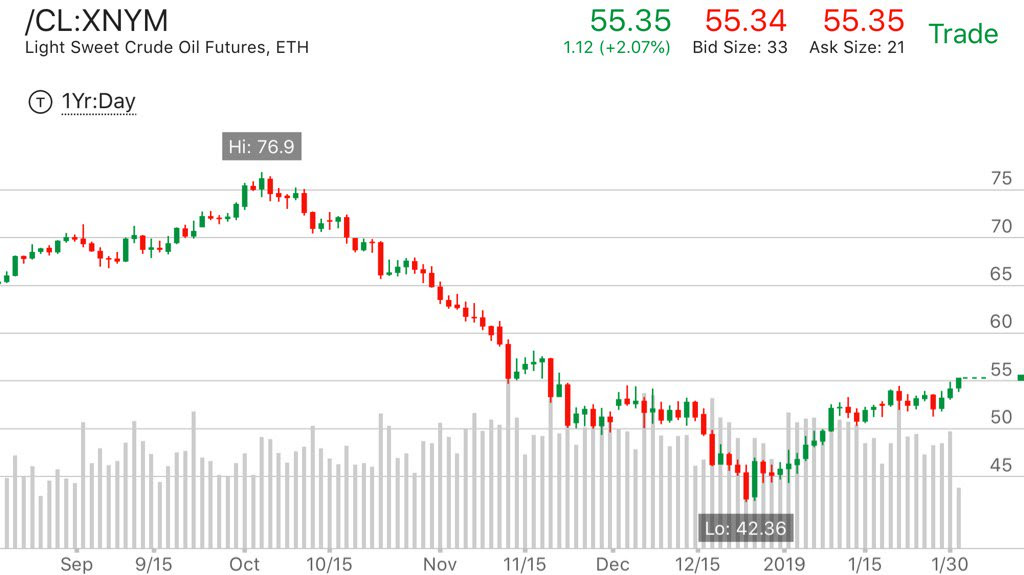
- Peter BrandtVerified account @PeterLBrandt – $CL_F breaking out to upside from H&S
A more detailed case below:
- Greg HarmonVerified account @harmongreg – Oil Strength Building http://dragonflycap.com/oil-
strength-building/ … $CL_F $USO
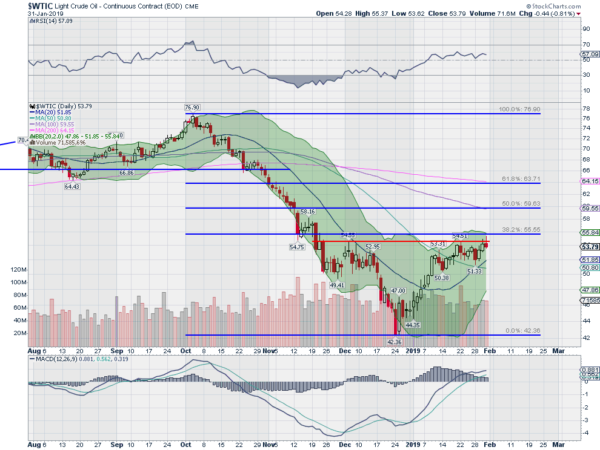
- “A closer look at the chart for Crude Oil shows real promise for more upside though. The small pause and bounce in November on the way down, and then the recent drift back and reversal, have created a possible Inverse Head and Shoulders pattern in the price action.”
- ” .. neckline of the pattern at about 54.50, sits just below a 38.2% retracement of the drop from October. A break above the neckline gives a target to about 66. This would bring Crude Oil back over the 200 day SMA and the 61.8% retracement. Momentum is on the edge of the bullish zone with the RSI running flat just under 60, while the MACD is positive. Keep an eye on this chart.”
Well, Oil did close at 55.34, well above this 54.50 neckline.
8. India, Budget, Election & Amazon
Last week we wondered whether Amazon would talk about their problems with law & price in India. They did in response to questions from analysts. It is strange that a company that understands the raucous politics in America and a CEO who owns a highly partisan newspaper like Washington Post have been so tone deaf to politics in the world’s most raucous electocracy, India. He actually could have learnt a thing or two from President Trump.
Farmers are a very small community in America as numbers go. But President Trump understands how important they are as a part of his base. So, in every trade negotiation, he talks about how American farmers would be thrilled with his trade success. Farmers are much important as a lobby in India. That is why Prime Minister Modi came out on Friday with a large transfer of money to farmers.
And farmers are connected to consumers by a huge bloc of wholesale merchants, retail shop keepers & others who assist in the supply chain. These merchants form the backbone of Modi’s party. How did Amazon miss this basic fact of life & that too in an election year of massive consequence?
In any case, the problems of Amazon in India are just beginning. The next regulatory hurdle is customer data that eventually must be housed in India. That should have been a huge opportunity for Amazon & AWS. They could have jumped ahead of MasterCard, Visa & others to offer data servers in India & used that to support small retail shopkeepers too.
But the long term rewards could still be huge for Amazon & Walmart-Flipkart but as Indian companies. They should look at Colgate, Unilever, P&G, Pepsi, Coke & build a similar presence for very long term success. And ideally, Amazon India should go public in India & in globally as a US ADR.
We think the Indian market is like what the American market was over 100 years ago. Dominant European companies could never capture the US market at that time because that US market needed utilitarian & inexpensive products not elegant high priced European brands. That America needed Ford workers to become the market for Ford cars. India is there today. When Amazon talks about low pricing for consumers, Amazon forgot that it needs the huge retail supply chain to be customers for its products too.
It might be of interest to read the section Parallels to how and why America won over Europe 100 years ago from our article on February 7, 2009 titled Will The Indian Market Be To America What The American Market Was To Europe 100 Years Ago? The comparison might be stretched in places but the basic question does have merit, we think.
Send your feedback to editor@macroviewpoints.com Or @MacroViewpoints on Twitter