Summary – A top-down review of interesting calls and comments made last week in Treasuries, monetary policy, economics, stocks, bonds & commodities. TAC is our acronym for Tweets, Articles, & Clips – our basic inputs for this article.
Editor’s Note: In this series of articles, we include important or interesting Tweets, Articles, Video Clips with our comments. This is an article that expresses our personal opinions about comments made on Television, Tweeter, and in Print. It is NOT intended to provide any investment advice of any type whatsoever. No one should base any investing decisions or conclusions based on anything written in or inferred from this article. Macro Viewpoints & its affiliates expressly disclaim all liability in respect to actions taken based on any or all of the information in this article. Investing is a serious matter and all investment decisions should only be taken after a detailed discussion with your investment advisor and should be subject to your objectives, suitability requirements and risk tolerance.
1.”nothing bad, nothing horrible“
That was the reaction of Rick Santelli to Friday’s economic data. It wasn’t good data but, on the heels of Thursday’s PMI data, Friday’s news was not as bad. Also except for Treasury yields melting into broad & deep yield inversion, other asset classes are not showing serious R-concern, as the following chart published by @themarketear shows:
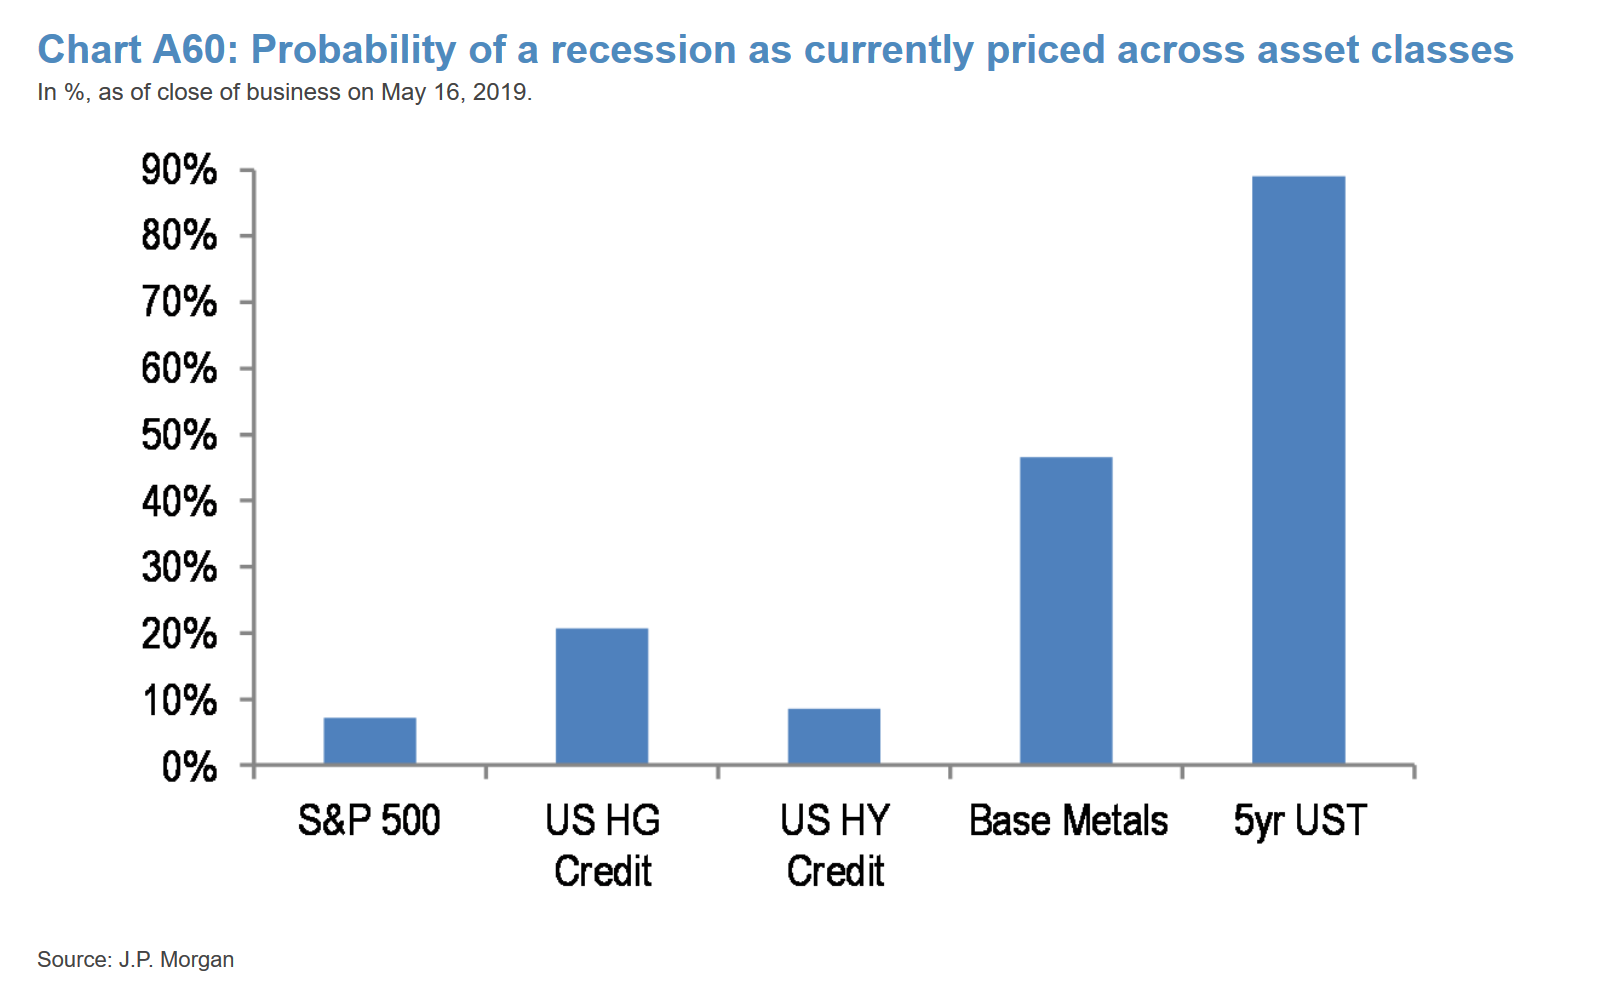 So the big question is whether the Treasury levels are ridiculously low mainly because of global yield hunger or whether the “resiliency” exhibited above by other asset classes is a repeat of the “resiliency” we all saw in the summer of 2007. Recall that year’s decline in other asset classes, especially stocks, came much later in the year. And by the time the Bernanke Fed realized the spreading weakness, it was too late to stop it.
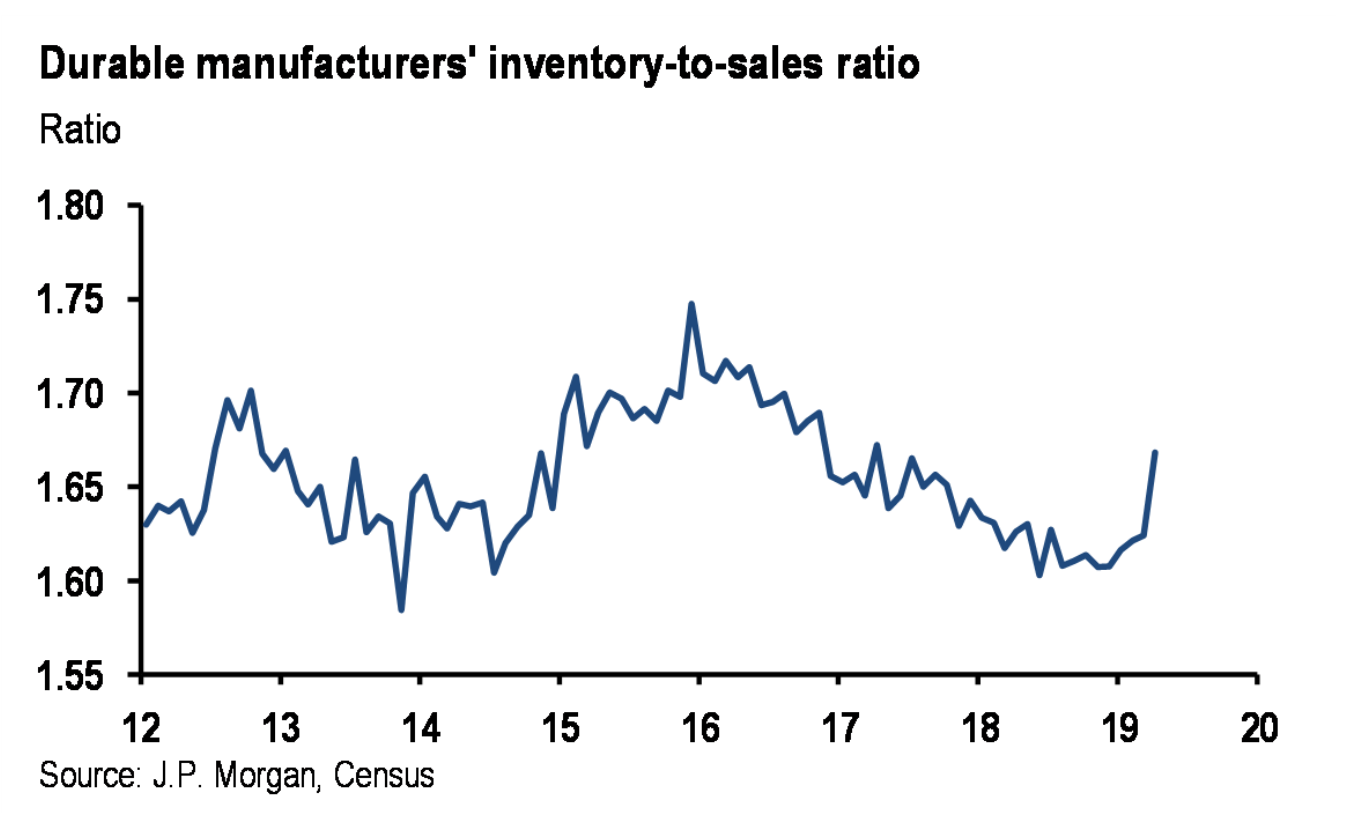
Perhaps, the durables report was not bad or “horrible” because of inventory buildup, as the chart below published by The Market Ear shows:
- Deteriorating Q2 GDP should put Fed on watch
 Is “dismal” less bad than “horrible”?
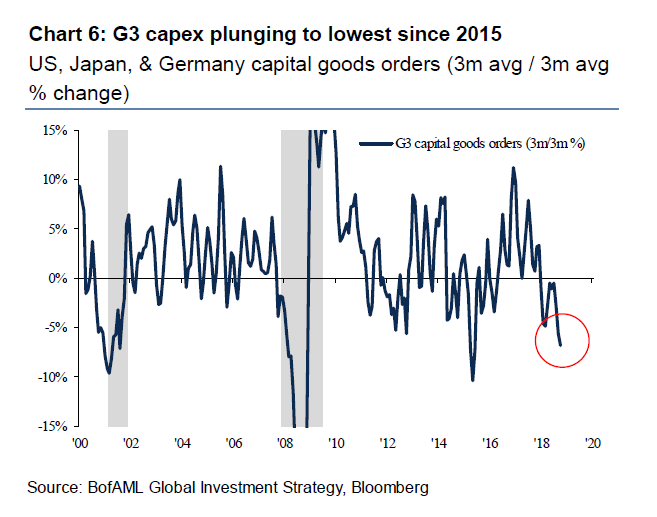
- David Rosenberg @EconguyRosie – Very dismal durable goods orders today. Capex about to join housing in recession. High-tech in the eye of the trade storm — order books down 0.4% in April and contracting in 4 of the past 5 months.
Looking at this via a G3 overview lens,
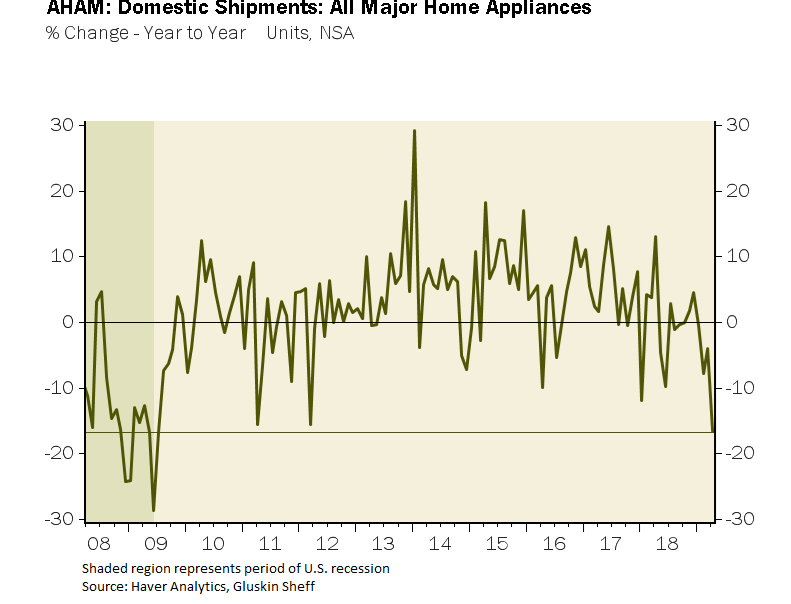
Forget G3 & all that big stuff. What about spending on home appliances that made Home Depot a secular growth stock?
- David Rosenberg @EconguyRosie – Look at this chart of major appliance shipments – collapsing 17% YoY in April – and tell me we aren’t heading into a recession.
 Yeah but, housing sales should be booming with collapse in 10-year interest rates, right? Not exactly:
- David Rosenberg @EconguyRosie – The bond market has acted in such a benevolent fashion in generating a 13 basis point decline in mortgage rates in April to 4.14%, and even that couldn’t stop existing home sales from dropping 0.4% for the month. Classic ‘pushing on a string’.
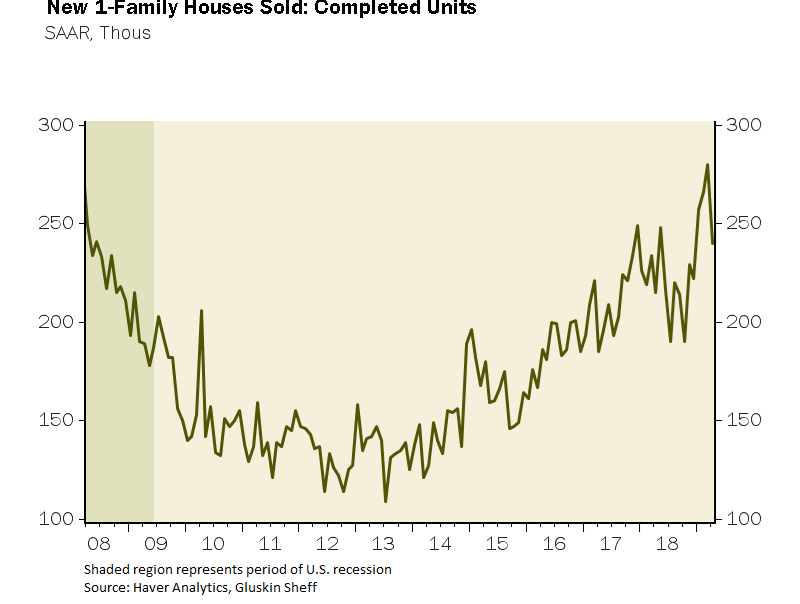
That’s fine but don’t homebuilders make money on sales of new homes?
- David Rosenberg @EconguyRosie – The details beneath the surface of today’s housing report were u-g-l-y: Sales of new homes recently completed (as opposed to buying on ‘plan’) collapsed 14% last month. Yikes!
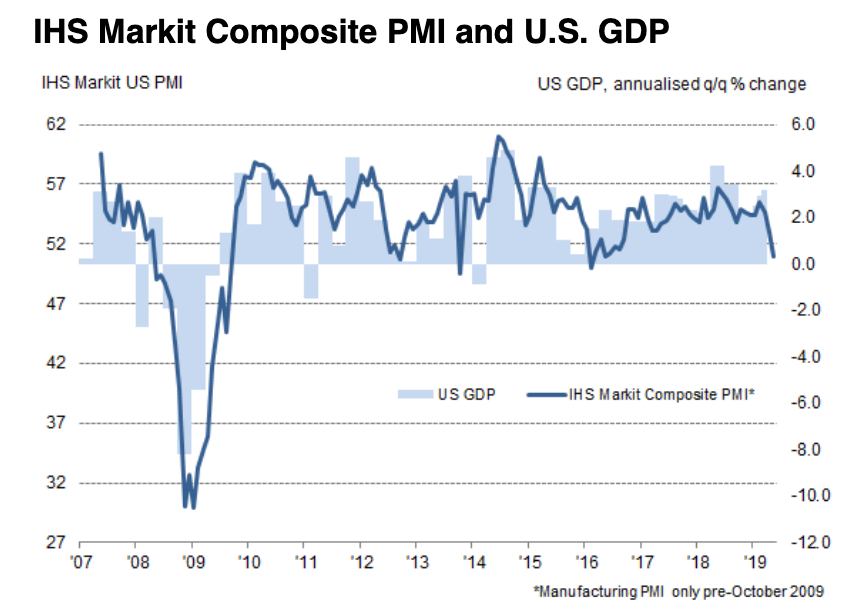
But aren’t the PMIs the real story of the economy? Don’t those tell us the real story of business confidence?
- Jesse Felder @jessefelder – ‘Inflows of new business showed the smallest rise seen this side of the global financial crisis. Business confidence has meanwhile slumped to its lowest since at least 2012.’ https://www.markiteconomics.
com/Public/Home/PressRelease/ c0a77762175240d989bf5090d001cf f2 … ht @SoberLook
 Well, that hits hard where there is little tolerance for pain!
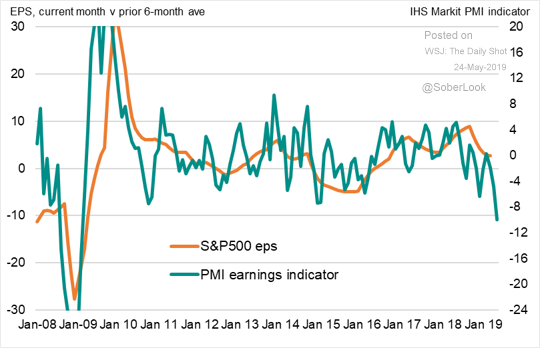
- Jesse Felder @jessefelder – ‘According to the IHS Markit PMI, corporate earnings will be under pressure going forward.’ https://blogs.wsj.com/
dailyshot/2019/05/24/the- daily-shot-renewed-trade- tensions-are-choking-us- business-growth/ … via @SoberLook
But what about the real indicator the Fed looks at as they tell us?
2. Inflation Expectations – Real & Perceived
What is the “real” picture? Real meaning what people paint with real money, not just 2-3 or even 14 academics but the entire marketplace of investors:
- Lisa AbramowiczVerified account@lisaabramowicz1 – Markets have seen the biggest two-day drop in 5-10 year inflation expectations since mid-2017, based on futures contracts.
And this is the true story of the fall in Treasury yields – inflation expectations falling have driven yields lower. Meaning another fall in yields could be ahead of us if the US economy starts exhibiting slower growth.
But who would care? Not the see no slowdown, hear no slowdown, speak of no slowdown gang. Are we being unfair? Not really because the same blind, deaf & mute gang refuse to acknowledge the fall in inflation expectations. Not only that but they demand the all the market participants suspend their beliefs too!
- Jesse Felder @jessefelder – ‘These inflation expectations built into the market, the Fed’s going to push back. They’re just too low.’
- https://www.bloomberg.com/news/articles/2019-05-23/the-fed-seems-to-want-markets-to-suspend-disbelief-on-inflation
Remember Jay Powell’s presser in December and that ridiculous spectacle of Powell explaining the sacrosanct Fed model. That Powell seems to be back. not just Powell but the entire FOMC. Because they only see/hear/speak what their slow moving models tell them to. Of course, they are the Ph.D. experts while the Treasury market is stupid.
In the meantime, Treasury rates went down hard again this week in a bull-flattening, a danger sign to every one except the model-bound Fed. The 30-year yield fell the most (7.2 bps), then the 10-year (6.9 bps), then the 7-year (5.9 bps), then the 5-year (5.4 bps), then the 3-year (3.9 bps ), then the 2-year (3 bps). At what point was this trend broken – the 3-month yield fell by 4.4 bps to 2.349%. And the German 10-year rate fell about 5 bps lower than the Japanese 10-year rate this week and the German 30-year rate (53 bps) is now sitting virtually on top of the Japanese 30-year rate (51 bps).
But the 3-month yield, even at this low 2.349% yield, is now higher than all maturities up to the 10-year yield which closed at 2.324%. Can the Fed spell INVERSION? Not until their Fed models spell it for them!
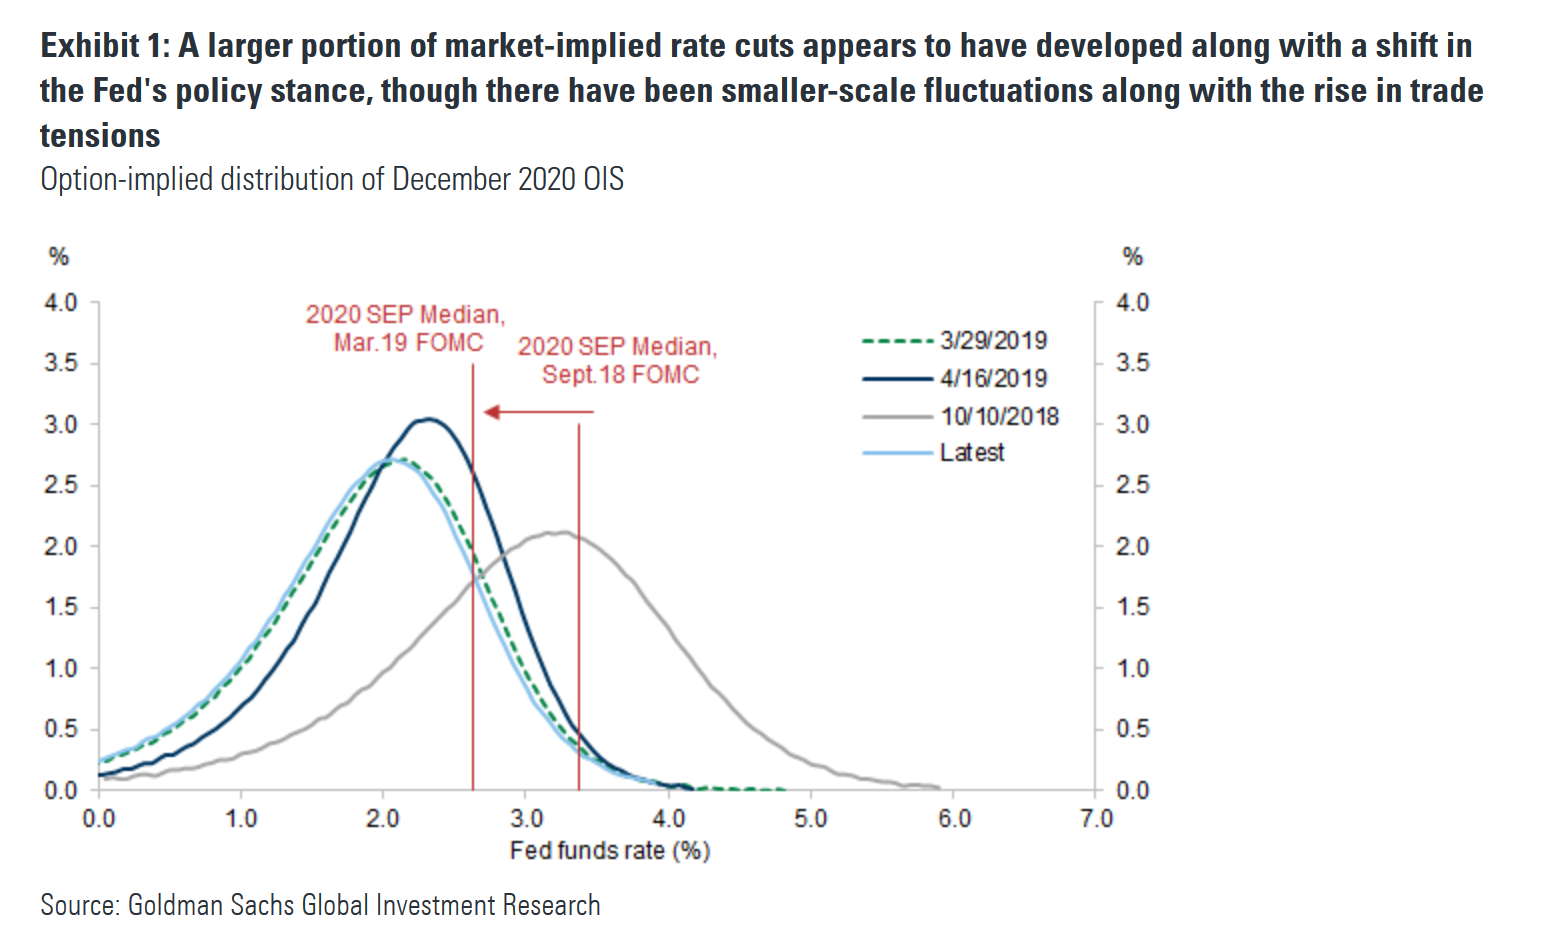
But Goldman Sachs seems to concur with the Fed that the market-based pricing of a Fed ease is excessive at least according to The Market Ear:
- “market pricing of Fed easing appears to be almost as stretched as it was in late March. Current rate cut pricing appears excessive without a marked deterioration in either economic fundamentals or financial conditions; the front end of the yield curve is more inverted than it has been ahead of past mid-cycle easings.”
- “While the timeline for an escalation of the trade conflict suggests there’s some room to stay short rates at the very front end, we believe hedging shorts further out is prudent. The trade conflict appears to have had a limited impact on markets thus far, and further escalation is likely to increase downside risks, but more so in risk assets than for interest rates”
We have a simple question for the “infallible” Fed & the luminaries at Goldman Sachs – Has the economic & corporate data strengthened from late March to now? No, is our answer. So is it possible that Treasury rates have fallen once again because the Fed’s disbelief allowed the slowdown to marinate into the economy & make it worse?
If that is so, then would another rise in Treasury rates make the slowdown marinate some more & seep into more sectors of the economy or would such a rise in interest rates improve the housing market, improve rising credit delinquencies & improve corporate earnings?
Frankly, the Fed in its arrogant conviction in its “infallible” models doesn’t care. How do we know? Look at the Williams dismissal below:
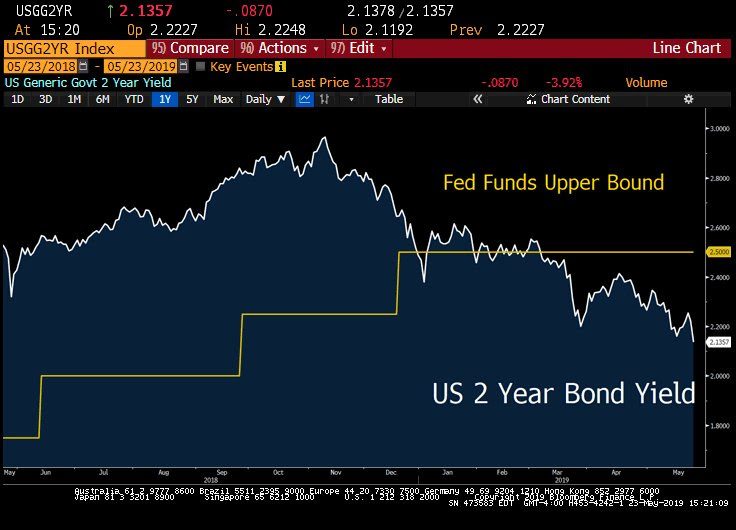
- Lawrence McDonald@Convertbond– New York Fed President John Williams says he doesn’t see “any strong argument today” for an interest rate move — in either direction. I’m sorry, 2s beg to differ John. #Bonds
Hmm! We wonder whether Mr. McDonald remembers another head of a financial institution who refused both publicly & privately to believe what the bond market was saying about his firm! Didn’t that man end up causing a near meltdown of the financial system? Didn’t some one write a book about that titled A Colossal Failure of Common Sense?
Wait! That author was Lawrence McDonald. So if the Powell Fed actually creates a recession in America because of their arrogant conviction in their “infallible” modes, then Mr. McDonald could write a sequel about Powell’s colossal failure of common sense. It would make a sad but interesting read.
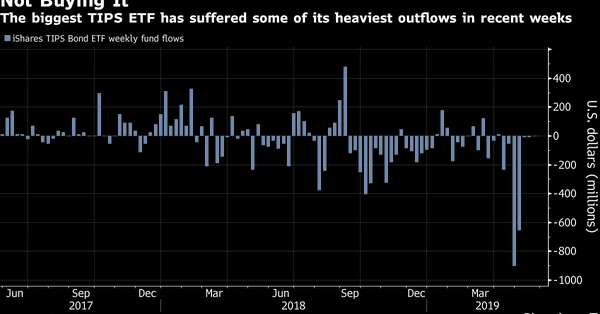
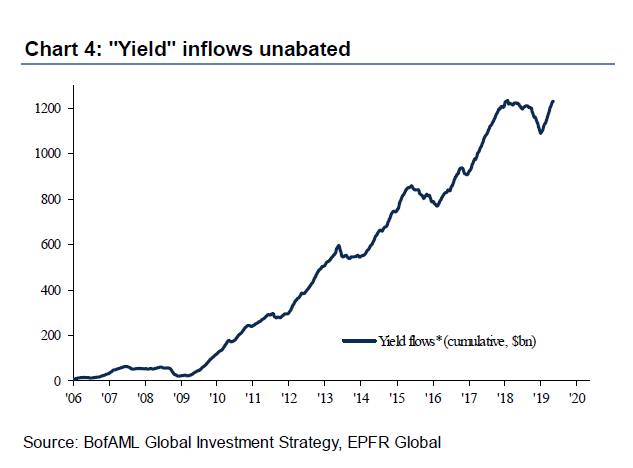
3. “Irrational” exuberance in Treasuries?
The inflows are something to see, courtesy of the Market Ear:
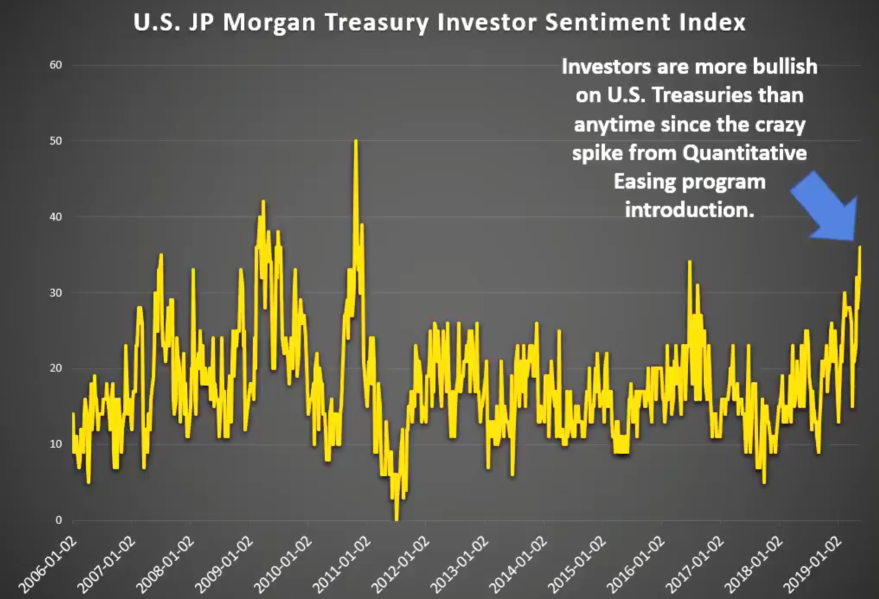
But what has been impact of these inflows on positioning?
- Babak@TN – US JP Morgan Treasury Investor#Sentiment Index once again at bullish extreme h/t@kevinmuir
But is the Daily Sentiment Index for Treasuries also at an extreme?
- Babak@TN – Daily#SentimentIndex for Treasury Notes 76%, off recent highs of 86% on March 26th and 85% on Jan 3rd DSI for Treasury Bonds at 83%, also off recent high of 93% on March 22nd and early Dec 2018 as well as Jan 2019, at same extreme level.
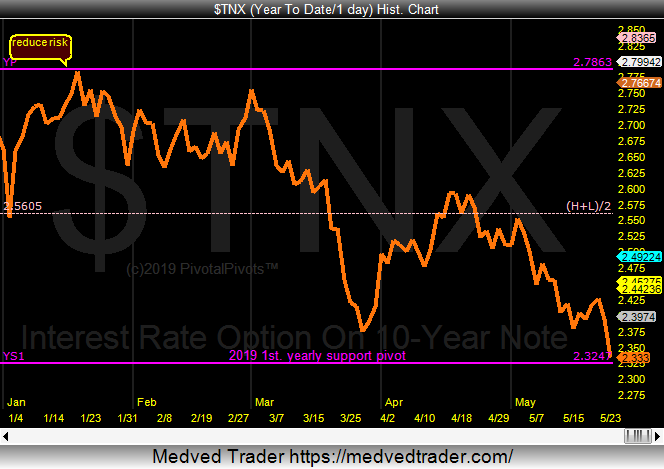
And the 10-year yield has reached the 2.32% target established weeks ago by a brave & now proven correct guru:
- Jeff York, PPT@Pivotal_Pivots – per my earlier predictions, 10 year bond yields $TNX today are testing support on the Yearly S1 pivot point(YS1) @ 2.32%. The high this year, was at the Yearly Pivot point(YP). YP to Ys1 is a textbook algorithmic move @PivotalPivots.
But what if the Fed doesn’t lower rates? Doesn’t the overnight rate of 2.50% rein in the fall in the 10-year rates & especially the 2-year rate? In that case, what might be some targets in the near term?
Anne Mathias of Vanguard said on BTV that she thinks a target for the 2-year yield is 2.14%; she said the limit for the 10-year yield is a little below 2.30%, perhaps 2.25% until the end of June when the tariff situation should become clearer.
But we have a lot of data coming in before the end of June including the Non Farm Payroll number in 2 weeks & the FOMC meeting the week after.
That data will probably tell us whether this past week’s exuberance in Treasuries was rational or not so rational.
4. U.S. Stocks
Remember what Ryan Detrick tweeted last week:
- Ryan Detrick, CMT@RyanDetrick – Friday – May 17 – This was the first 4-week losing streak for the Dow in 3 years. Hasn’t been down 5 weeks in a row in 8 years!
Sadly, this week became the first time since 2011 when the Dow closed negative for 5 straight weeks. Not just that, but Lawrence McMillan of Option Strategist, sounded more cautionary in his Friday’s summary:
- “Equity-only put-call ratios remain strongly on sell signals. They are continuing to rise daily, and they are really not far up their charts yet — meaning there is plenty of room to go before they become “oversold.”
- “Breadth has been poor of late, and thus both breadth oscillators are once again in agreement, and they are on sell signals.”
- “Volatility, however, is not worried about any of these things. $VIX is at extremely low levels, considering the internal damage that has been done to the market. A sustained move back above 17 would be bearish.”
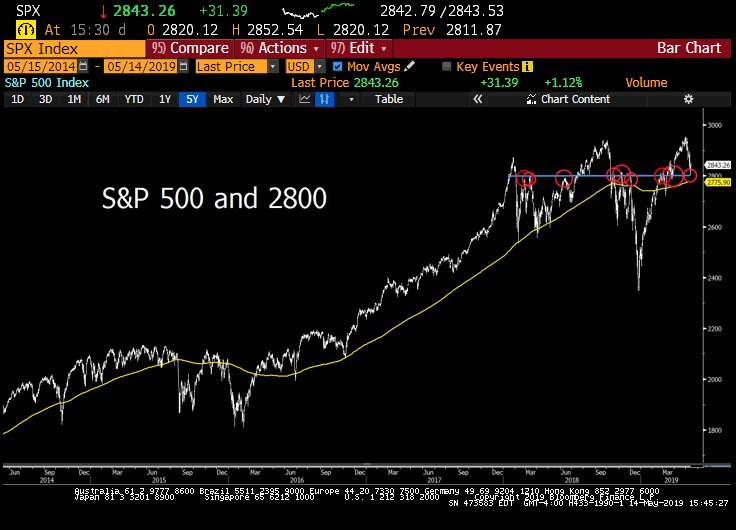
- “In summary, there are plenty of negative indicators, mixed with a few oversold buy signals. But all that really matters is the 2800 level. The bulls can still resuce this market as long as $SPX does not close below 2800.”
How big a magnet is the 2800 level?
- Lawrence McDonald@Convertbond–
- S&P 500 2019 May 23: 2800 May 13: 2800 Mar 28: 2800 Mar 15: 2800 Feb 24: 2800
- 2018 Dec 3: 2800 Nov 7: 2800 Oct 17: 2800 Oct 10: 2800 Aug 15: 2800 Aug 2: 2800 July 20: 2800 June 13: 2800 Mar 13: 2800 Jan 16: 2800
- *That’s a lot of “all-time highs” wrapped around 2800
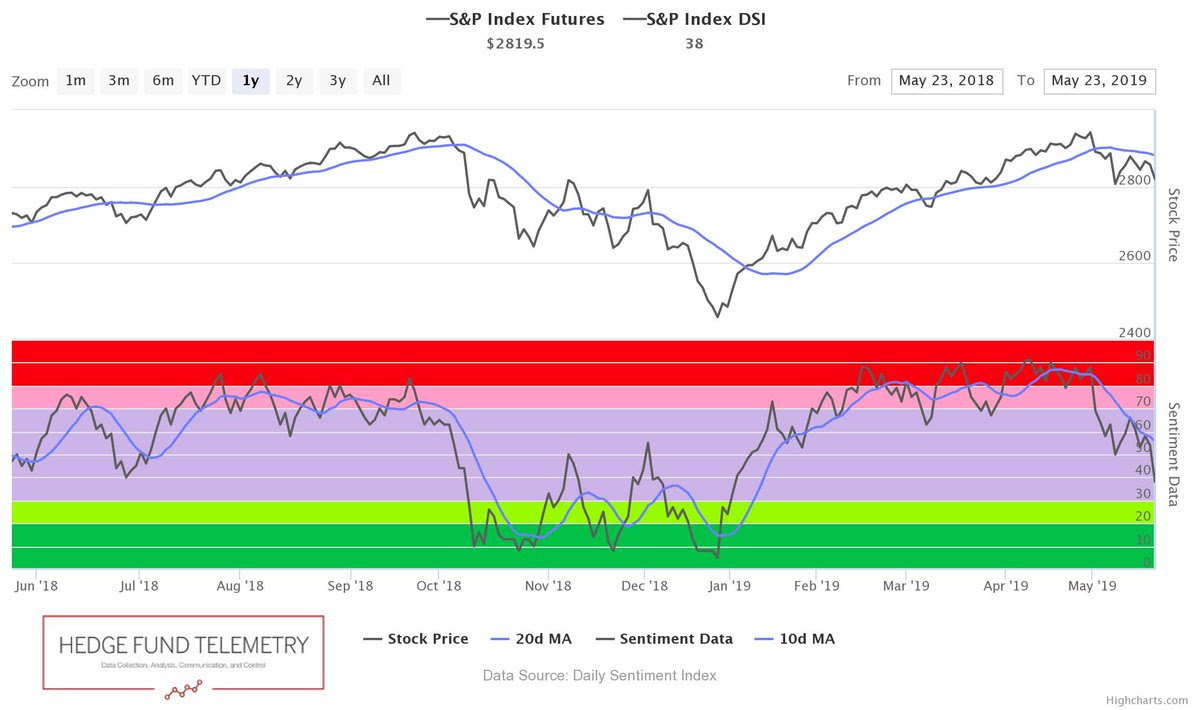
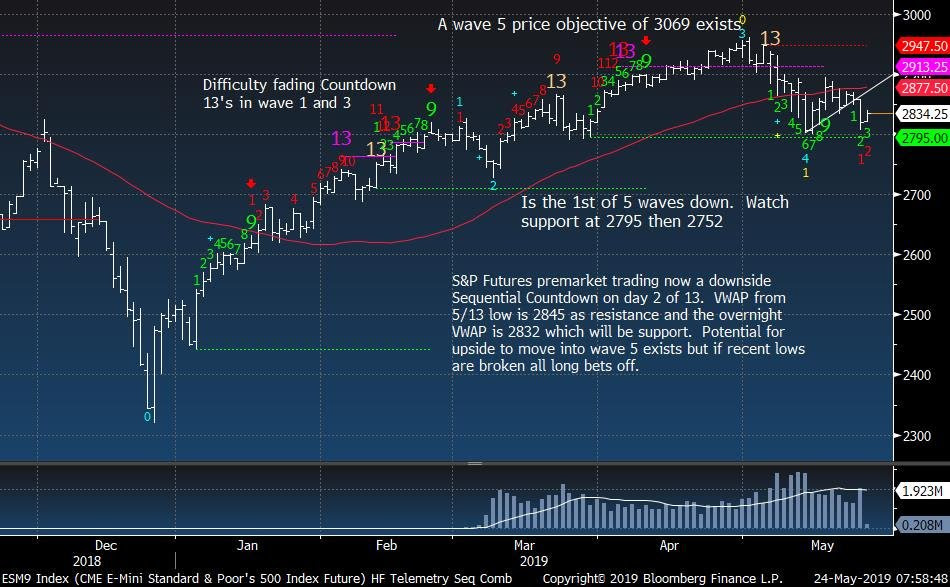
Any input from a DeMarkian?
- Thomas Thornton@TommyThornton–
$SPXbullish sentiment is at 38%. Down from recent peak at 90%. When under 50% risk to larger drop increases. 2800 is the tipping point. S&P futures daily has a downside DeMark Countdown on day 2 of 13.
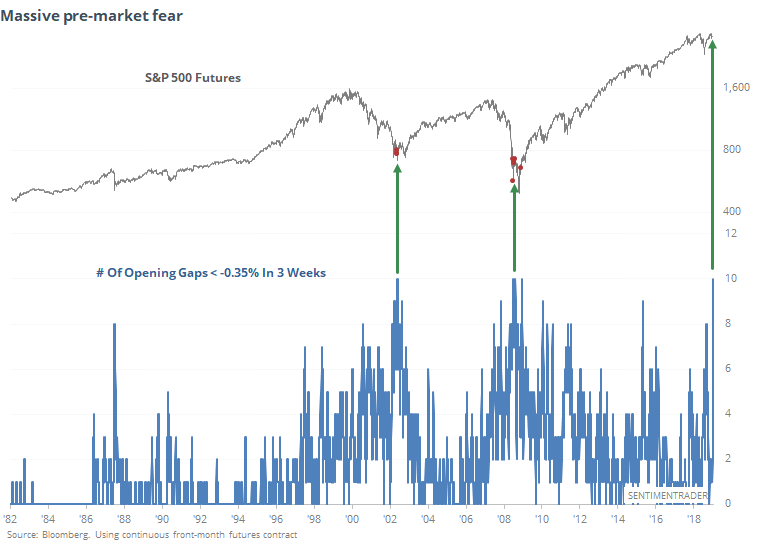
Since 2800 is only 26 handles away, wouldn’t it be wiser to wait to see what happens next week instead of opining now? But we can always speculate about the long term. In that spirit, below are 2 references to 2007-2008 with completely opposite outcomes:
- SentimenTraderVerified account @sentimentrader – Since the inception of the S&P 500 futures market, there have been two time periods with this much pre-market anxiety. * The bottom of the 2002 bear market * The bottom of the 2008 bear market
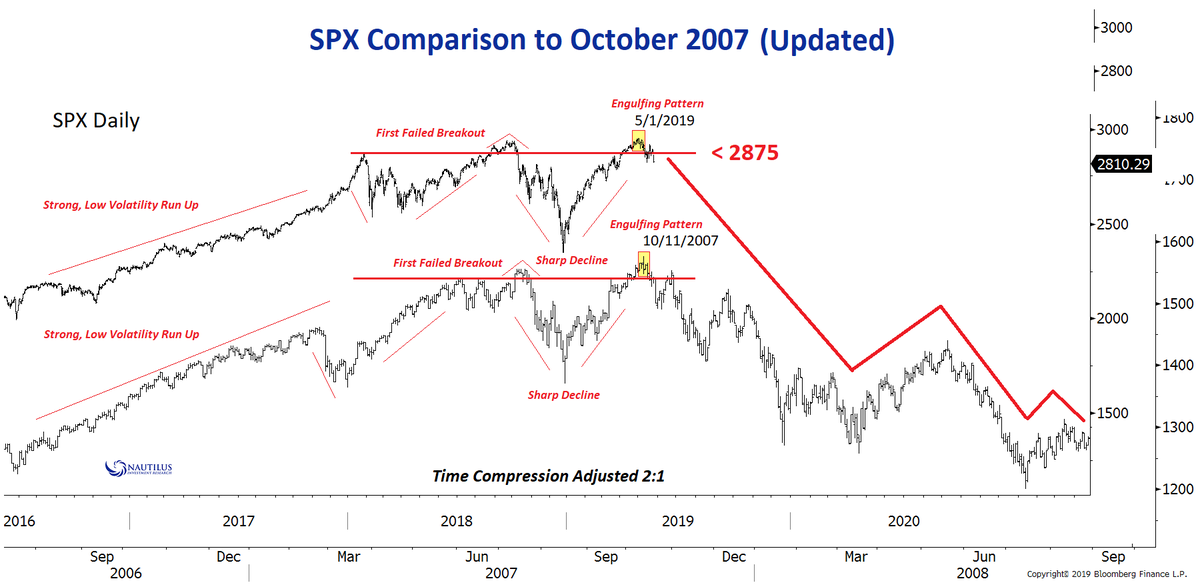
 And,
And,
- Nautilus Research@NautilusCap – $SPXComparison to October 2007 – update.
It all depends on how quickly & how effectively the Fed cuts interest rates. That has been our core conviction since the beginning of 2019 & that conviction is getting strengthened with every month’s data.
5. Emerging Market Unlike Most
Our last week’s article focused on the sell offs in Emerging Market Stocks, Currencies & even Bonds. EEM was down 4% on the week that ended May 16; EWZ was down almost 8% and EWY was down almost 4%. But one emerging market was unscathed that week.
We had noticed that but kept mum to avoid jinxing the election results announced this week. The Indian electorate demonstrated to the world that people don’t have to be of the right skin complexion, social status, educational credentials to vote in their best interests. That is why Electocracy works & none works better than the Indian electocracy.
The biggest free electorate in the world rose to its challenge and delivered an even greater victory to Prime Minister Narendra Modi, a victory even greater than the one in 2014. PM Modi won 303 seats this week, more than his 282 wins in 2014. His NDA coalition won 348 seats compared to 336 seats in 2014.
The Indian Sensex exploded up by 1400 points last Monday because of stunningly positive exit polls and the actual victory was even greater than the polls.Those who sold ahead of the election have been left by the way side.
(INDA – Sensex- ytd) (INDY – Nifty 50 – ytd)
The story of India is a huge set of people getting progressively higher incomes. And the best way to participate in its is in a Buffet-like way – by compounding returns from basic consumer demand stocks held for decades. Gundlach is absolutely correct when he says buy broad Indian ETFs and hold them for your grandchildren. They will remember you even more fondly.
And as the President said,
- Donald J. TrumpVerified account @realDonaldTrump – Congratulations to Prime Minister
@NarendraModi and his BJP party on their BIG election victory! Great things are in store for the US-India partnership with the return of PM Modi at the helm. I look forward to continuing our important work together!
6. Most Importantly

Send your feedback to editor@macroviewpoints.com Or @MacroViewpoints on Twitter